거래 로봇을 무료로 다운로드 하는 법을 시청해보세요
당사를 Twitter에서 찾아주십시오!
당사 팬 페이지에 가입하십시오
스크립트가 흥미로우신가요?
그렇다면 링크 to it -
하셔서 다른 이들이 평가할 수 있도록 해보세요
스크립트가 마음에 드시나요? MetaTrader 5 터미널에서 시도해보십시오
지표

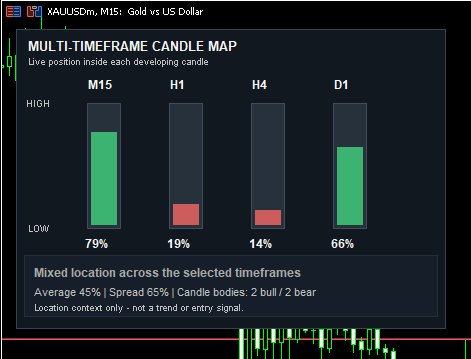
Multi-Timeframe Candle Map - MetaTrader 5용 지표

Talal N Z Aljarusha
Talal N Z Aljarusha
3 (2)
MT5 tools developer focused on Smart Money Concepts, market structure, liquidity mapping, and professional chart visualization.
조회수:
277
평가:
(1)
게시됨:
MQL5 프리랜스 이 코드를 기반으로 한 로봇이나 지표가 필요하신가요? 프리랜스로 주문하세요 프리랜스로 이동
Multi-Timeframe Candle Map shows where the current price is sitting inside the developing candle of four selected timeframes.

The idea is simple. A raw price distance is difficult to compare between M15, H1, H4 and D1 because every candle has a different range. The indicator normalizes the location into a percentage:

position = (current price - candle low) / (candle high - candle low) * 100

A reading near 0% means price is close to that candle's low. A reading near 100% means it is close to the high. Each timeframe is drawn as a vertical gauge so the relationship can be read without switching charts.

What the panel shows

- Four configurable timeframes
- Vertical price position from candle low to candle high
- Near Low, Lower Half, Upper Half and Near High classification
- Current candle body direction
- Time remaining before each candle closes
- Average position across the selected timeframes
- Spread between the highest and lowest readings
- A summary when several timeframes are located near the same edge

The spread value is useful when reading agreement. A small spread means the selected candles have similar normalized locations. A large spread means the timeframes are describing different parts of their ranges, so the context is mixed.

Inputs

InpTimeframe1 to InpTimeframe4 select the candles displayed in the panel.

InpUseBidPrice uses the live Bid price. When disabled, the current candle close supplied by CopyRates is used.

InpEdgeThreshold defines what is considered near a candle high or low. With the default value of 20, readings from 0-20% are Near Low and readings from 80-100% are Near High.

InpAlignmentCount controls how many timeframes must be near the same edge before the panel reports an alignment.

InpEnableAlerts optionally reports a new high-edge or low-edge alignment.

The code is also intended as a practical example for developers. It demonstrates CopyRates across multiple timeframes, percentage normalization, timer-based refresh, chart-object panels and state-controlled alerts.

This indicator does not predict direction and does not generate entry signals. A candle can be near its high and still reverse, or remain near its high while the trend continues. The readings should be treated as location context only.

SR Zone Scanner SR Zone Scanner

Multi-timeframe Support & Resistance zone scanner with strength rating and instant alerts — M15, H1, H4, D1.

Equity Guard — Daily Loss Limit Guardian with Panic Panel Equity Guard — Daily Loss Limit Guardian with Panic Panel

Account-level daily loss guardian: when your daily loss reaches a configurable trigger, it closes all positions and pending orders and keeps the account flat until the next daily reset. Limits in percent or money, configurable reset time (server time), draggable visual panel with live gauge, and manual CLOSE ALL / LOCK buttons with click-to-confirm. Works on any broker, symbol, account size and currency — hedging and netting, no DLLs.

Consecutive Bars (with history) indicator for MT5 Consecutive Bars (with history) indicator for MT5

An oscillator that shows 2 line studies: 1 for consecutive up bars, and 1 for consecutive down bars.

MACD Signals MACD Signals

Indicator edition for new platform.