Yaser Sabbaghi
Yaser Sabbaghi
4.4 (64)
  • 情報
10+ 年
経験
8
製品
625
デモバージョン
4
ジョブ
0
シグナル
0
購読者
I am a financial market application designer and developer. I have published these Indicators as a Decision Support System (DSS) to fortify traders' financial market trading quality.

These published indicators, EAs, and money robots empower you by providing insight to predict market trends more accurately and make you an unyielding trader with high accuracy in entering and exiting the market.

The worth and applicability of these published indicators are validated by published Expert Advisors (EAs). Developed indicators empower these EAs to trade as money robots with additional sophisticated built-in intelligence.

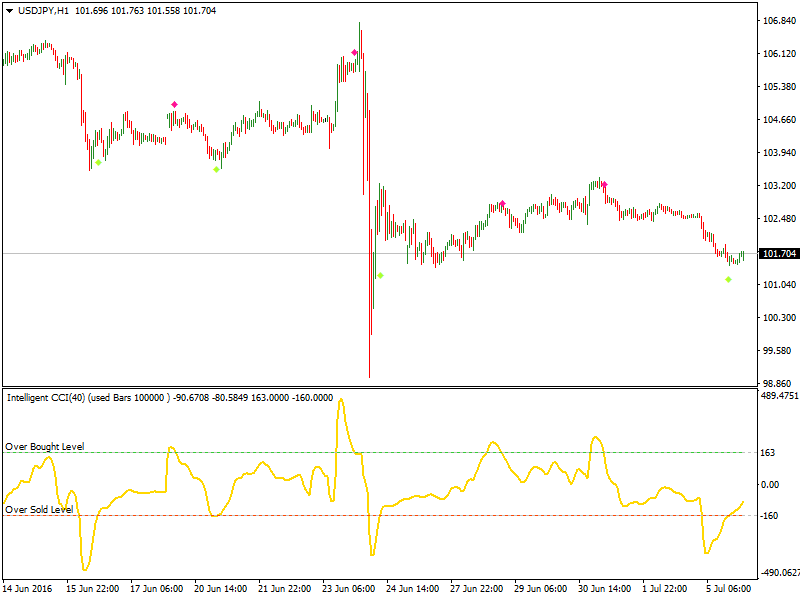
The EAs are reinforced by Intelligent CCI, Exponential Momentum and "CPM" (Currency Power Meter), and Statistical Support Resistance indicators. EAs have several capabilities, including 1) Detect Market Trend, 2) Predict Market perspective, and 3) Measure Market Momentum.

The published signals presented here provide evidence to support one of our developed EAs, called "Smart, Safe and Steady". These Signals come either from an account with fully automated trading by EAs, or from an account with manual trading aided by our developed indicators.

If you need to build and develop a customized Indicator or EA for your trading strategy, please do not hesitate to send me a message.

You can also join the Telegram group to use Free signals and analytical posts via the following link:
Yaser Sabbaghi
Yaser Sabbaghi
One year past from first version of "Intelligent CCI".
Now it is in 1.6 version with variation in BUY and Sell signalling by drawing arrows in your chart.
This is intelligent because calculate the OverBought and OverSold areas dynamically.
Check the last signals over USDJPY.
Yaser Sabbaghi
パブリッシュされた投稿USDCAD, Flag pattern is going to reach the target
USDCAD Bearish FLAG pattern is going to reach the target. Intelligent CCI indicator is in oversold area and the -163 is the border. By leaving oversold and crossing up the -163 there is a bullish movement there. Probably the BUY signal happen around 1.280 in the Demand Zone...
Yaser Sabbaghi
パブリッシュされた投稿USDCHF, In Bearish channel
As we had an analyst here that USDCHF is in TOP and traders need to take action for Bearish opportunity at this post https://www.mql5.com/en/blogs/post/673240 Now we are in Bearish channel with estimated target first at 0.9730 and probably then at 0.9556...
Yaser Sabbaghi
パブリッシュされた投稿USDCHF, Daily is in Top
USDCHF Daily is in a Bearish channel from 11/2015 and it it has just made a top. So it is a good situation to take SELL but a fake Bullish break out may happen. In case the "Intelligent CCI" indicator fall below 78 it is confirmed time for SELL...
Yaser Sabbaghi
パブリッシュされた投稿GBPUSD, Bearish to 1.4546 about 100 Pips
GBPUSD is Bearish as it has just broke its trend line. Target is 100 Pips to 1.4546. It is valid until the indicator is below its trend line...
Yaser Sabbaghi
パブリッシュされた投稿Intelligent CCI, USDCAD
This is in oversold at H4 time frame. And the bullish trend line is broken as it was the last chance for USDCAD to remain bullish...
共有されたプロダクト
レビュー: 5
49.00 USD

It is CCI indicator with very smooth and noiseless movement that calculates four levels of buy, sell, overbought and oversold dynamically. Professional traders know well that level of 100, 200 or -100 and -200 are not always right and need fine adjustments. This indicator calculates those levels dynamically by using mathematics and statistic methods in addition to shows divergence between indicator and price. Like original CCI, for best result you have better to set proper value for CCI period

xinchao
xinchao 2018.03.13
Hi, if ibuy it, can I pay by neteller ?
Yaser Sabbaghi パブリッシュされたプロダクト
レビュー: 1
50.00 USD

Advanced and affordable momentum indicator that fade the fake move of market. It is smoothed because of special sophisticated exponential averaging calculation. It is also similar to special type of CCI with more tolerance to overbought or oversold conditions with built-in momentum indication. This indicator is able to empower your trading as a trend detector, CCI and market momentum scale measurement. Features Smoothed to filter uncomfortable noises. Non-Lagging Exponential averaging. Line or

Yaser Sabbaghi
Have a look at Simple Moving 200 as it would be a pull back point and it acts as resistant. The target of Bump and Run reversal pattern is about the height of rectangle and it would be 1127...
Yaser Sabbaghi
in case of trend line break out and Bump&Run pattern confirmation, the target of Long would be 1138 ~ 1140. Follow the green lines for Gold in the chart...
Yaser Sabbaghi
パブリッシュされた投稿Gold H1 chart, from the point of CCI Indicator signals it is going again Short.
I have used Intelligent CCI indicator that is able to detect the main trend. It makes the signal arrows appears according to main trend. CCI has left Over-Bought level down when the level dynamically is calculated being 109...
Yaser Sabbaghi
パブリッシュされた投稿Gold H1 chart, What is going on with gold on behalf of Indicator points vs human points?
humans are caught his feelings. They predict or forecast the market as they wish or they do as they hop the market to be. But the intelligent one indicators that control the weakness in over-sold and over-bought areas are the tools to help humans to make better decision...
Yaser Sabbaghi
パブリッシュされた投稿Gold
Let see what is going to happen, 1- Intelligent CCI has left Dynamic Oversold area at -150. 2- PA has touched Supply zone and pulled back...
Yaser Sabbaghi
パブリッシュされた投稿Gold H1
I have Buy Signal with CCI, but the main trend is Sell yet. And this is the reason that I need to be more patient...
Yaser Sabbaghi パブリッシュされたプロダクト
レビュー: 5
49.00 USD

It is CCI indicator with very smooth and noiseless movement that calculates four levels of buy, sell, overbought and oversold dynamically. Professional traders know well that level of 100, 200 or -100 and -200 are not always right and need fine adjustments. This indicator calculates those levels dynamically by using mathematics and statistic methods in addition to shows divergence between indicator and price. Like original CCI, for best result you have better to set proper value for CCI period