Rajesh Kumar Nait
Rajesh Kumar Nait
4.9 (31)
  • 情報
4 年
経験
34
製品
41
デモバージョン
0
ジョブ
0
シグナル
0
購読者
こんにちは、私は情報技術のB.Techを持つMQL開発者のRajeshです。プログラミング経験が12年以上あり、ウェブ開発に特化した元PHP開発者から、フルタイムのMQL5プログラマーおよび暗号通貨トレーダーに転身しました。

現在の役割では、デイトレーダーとして毎日$SOLを取引し、私のセラーページで先端プログラムを販売しています。これらのプログラムには、WebSocketとAPIを介してすべての人気取引所からチャートをロードするネイティブWebSocket暗号通貨取引所接続ユーティリティが含まれています。VPSでシームレスに動作し、外部DLLは必要ありません。

暗号通貨のチャート分析や取引ツールに興味がある場合は、DMで気軽に連絡してください。私のMQL5セラーページで暗号製品や取引所の統合をチェックしてください。ISTタイムゾーンで1日12時間のサポートを提供しています。

期間限定で、すべての製品が30%割引で提供されています。お見逃しなく!
Rajesh Kumar Nait
Rajesh Kumar Nait
Rate my Win11 Theme
Adekunle Michael Olanrewaju - Themichl LLC
Adekunle Michael Olanrewaju 2025.06.03
dopee! 10/10
Rajesh Kumar Nait
Rajesh Kumar Nait 2025.06.03
thanks
Rajesh Kumar Nait
Rajesh Kumar Nait
I do not use any indicator to trad. But i have some belief in these two powerful indicators only : VWAP and TWAP
Conor Mcnamara
Conor Mcnamara 2025.05.28
I use a select few which are reliable, fast, and non repainting. Then I'll use only one qualitative indicator for statistical reasons. I don't like seeing a chart without indicators personally because I dislike visual chaos, I prefer to see organized chaos
Rajesh Kumar Nait
Rajesh Kumar Nait 2025.05.29
That's great. Mus use what works in making $$$ and your analysis strong.
Rajesh Kumar Nait
Rajesh Kumar Nait
I was about to buy Snapdragon Laptop but just nearly got saved when I knew MT5 does not have an ARM build. What would we do with battery life if we are not able to open MT5 natively ? :)
Lorentzos Roussos
Lorentzos Roussos 2025.05.28
they sell laptopts?
Rajesh Kumar Nait
Rajesh Kumar Nait 2025.05.29
Qualcomm is a chip manufacturing company for smartphone and tablet. My smartphone has snapdragon 888 processor by qualcomm
Lorentzos Roussos
Lorentzos Roussos 2025.05.29
ow i see
Rajesh Kumar Nait
Rajesh Kumar Nait
Do you believe in FVG? or its just another unsuccessful logic?
Conor Mcnamara
Conor Mcnamara 2025.05.27
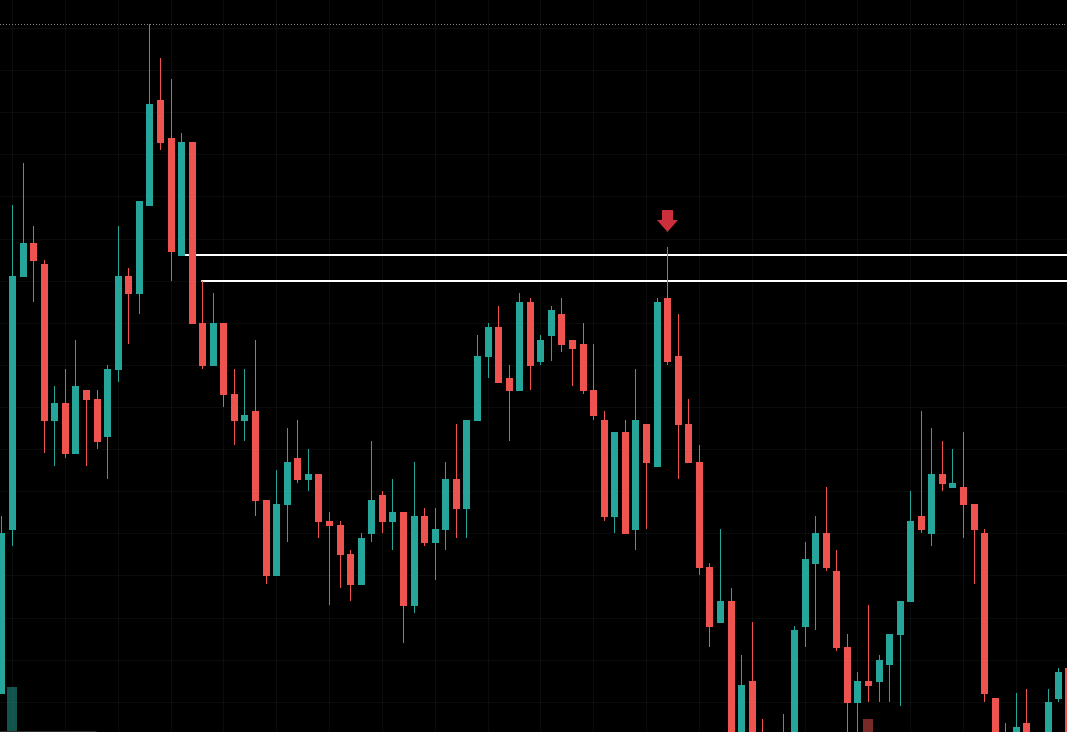
People backtested it to find that it's not truly stable by itself since the pattern can be broken sometimes, but it is still a thing that's significant. My idea would just be to confirm it with other analysis. Usually it respects a level of resistance or support, but if there's no known resistance or support then I might not trust it
Rajesh Kumar Nait
Rajesh Kumar Nait 2025.05.27
yes maybe it works in combination of Break of structure, Shift of structure and Inducement
Conor Mcnamara
Conor Mcnamara 2025.05.27
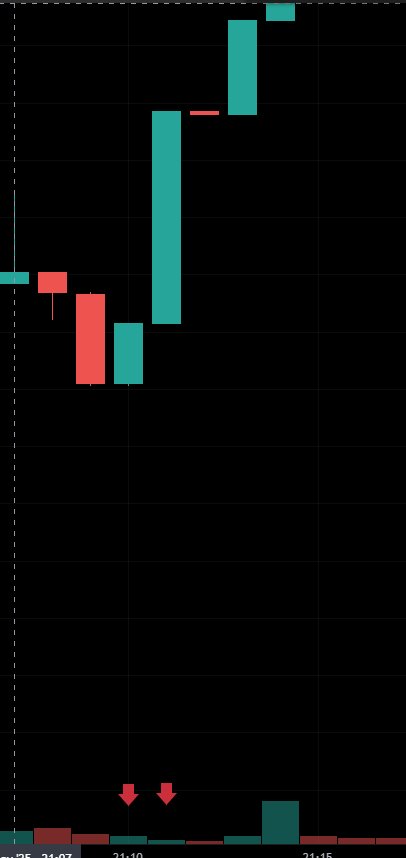
what I see is that any time there's demand, there are lots of retail traders wanting to chase it, next thing there's an FVG and many people are liquidated because of fear and trading before the FVG took place, so I think this is a key time when institutional traders apply the inducement strategy. so when I see demand, I'm waiting, because it is good to anticipate the formation of the fvg. PO3 concept is a real phenomenon that repeats.
Rajesh Kumar Nait
Rajesh Kumar Nait
I am unable to post indicator for this for some reasons but here is interesting concept. ❓Why Is Candle Range Increasing While Volume Is Low?
This is counterintuitive, but there are solid market microstructure reasons why this happens:

🔍 1. Liquidity Vacuum / Stop-Hunt Trigger
When a market rapidly moves up on low volume, it often means:

Liquidity was thin on the sell side.

A few aggressive buyers cleared the sell wall, triggering:

Stop-losses from shorts (adding buy pressure).

Limit orders above recent lows (creating a vacuum effect).

Result: Price jumps quickly, but volume is still low because not many contracts needed to be traded to move price.

🧠 Think of it like this:
"Price moves the fastest when nobody is willing to sell anymore — not when everyone's buying."

🔍 2. Passive Sellers Withdrew Orders
Another reason: Market makers pulled liquidity because the prior candles looked weak, and they didn’t want to get caught in a reversal.

With fewer passive limit sell orders in the book, even small buy orders push price up more.

This shows up as big candles but low volume.

🔍 3. False Sense of Demand – It’s Not Strength (Yet)
Sometimes big candles on low volume are fake breakouts or traps:

It looks strong, but it’s mostly short covering or bot-driven.

If buyers don’t step in after that candle, it may reverse again — so you want to see confirmation with volume after the big move.
Conor Mcnamara
Conor Mcnamara 2025.05.26
Most of the time I would say it's a fake breakout that you don't want to trade, big investors putting in big capital to shake the market
Rajesh Kumar Nait
Rajesh Kumar Nait 2025.05.26
yes candle size + greater volume amount may support real move
Rajesh Kumar Nait
Rajesh Kumar Nait
Many of my publication are removed. Mods are deleting. No notification, no reason explanation.
Rajesh Kumar Nait
Rajesh Kumar Nait
Coding your EA in MQL5 is dream come true. Its very tough but not impossible. Here is how you can do that. 1. Learn MQL5 2. Code your EA: In my case my EA is 100% Pure Price action which involves no indicator. its only based on OHLC info of candlestick, To code any EA you must have logic. if you have logic then you either need a programmer or code your EA yourself for success in financial market. 3. Coding an EA will show you truth about trading because programming dont lie. Programming is based on logic and its the heart of "mechanical system" in financial market. When you trade with any strategy you just found to be working for few days, You may win for few days but you lack data about how it performed on last 1 years of chart. AI suggest to trade any strategy on 1min chart, you need to test on atleast last 100 trades or minmum 6 months of chart. So do no trade and waste your money because you think something works or you have a holy grail. But only start trading when you have a backtest data which supports you which is only possible by coding EA, backtesting it and optimizing it. optimizing EA is very tough, You have to play with parameters to get the result which you feel confident to trade with $100k. IF you do not have logic or time to think about strategy, Rent H200 GPU and feed your neural network until it satisfy you with a million dollar profit making strategy as fast as possible.
Rajesh Kumar Nait
パブリッシュされた投稿The World's Best Risk Strategy: Kelly Criterion
What is it? The Kelly Criterion is a mathematical formula that calculates the optimal amount to risk on each bet/trade to maximize long-term growth while avoiding ruin...
Rajesh Kumar Nait
パブリッシュされた投稿Wavelet Transform and why people used it to denoise 1min chart and its comparison with Fourier Transform
📈 What is a Wavelet Transform in trading research? Wavelet Transform is a mathematical tool that breaks down a price series into different frequency components — but localized in time . Think of it like a microscope for charts: it helps you zoom into different time scales at different moments...
مجید فرهادی
مجید فرهادی 2025.05.05
Mf354694@gmail.com
Rajesh Kumar Nait
パブリッシュされた投稿Institutional Trader's Secret
Institutional trading strategies are typically closely guarded secrets, but some methods have been leaked, reverse-engineered, or shared by ex-traders over the years . Here are some confirmed or highly suspected institutional strategies that have been discussed publicly...
Rajesh Kumar Nait
パブリッシュされたコードCandle Signature
ロウソクのサイン例|研究開発用
Rajesh Kumar Nait
パブリッシュされた投稿Script for Pionex API EA Connector for MT5
///+------------------------------------------------------------------+ //| Library_Pionex.mq5 | //| Copyright 2024, Rajesh Kumar Nait | //| https://www.mql5...
Rajesh Kumar Nait パブリッシュされたプロダクト

Pionex API EAコネクター for MT5 – MT5とのシームレスな統合 概要 Pionex API EAコネクター for MT5 は、 MetaTrader 5 (MT5) と Pionex API をスムーズに統合するツールです。トレーダーは MT5 から直接、取引の実行・管理、残高情報の取得、注文履歴の追跡ができます。 主な機能 🔹 アカウントと残高管理 Get_Balance(); – Pionex の現在のアカウント残高を取得。 🔹 注文の実行と管理 orderLimit(string symbol, string side, double size, double price); – 指定価格で 指値注文 を実行。 orderMarket(string symbol, string side, double size, double amount); – 指定量で 成行注文 を実行。 Cancel_Order(string symbol, string orderId); – ID による特定の注文のキャンセル。

Rajesh Kumar Nait パブリッシュされたプロダクト

Pionex Live MT5 Data and History -- APIアドレスを ツール > エキスパートアドバイザー に追加 api.pionex.com ws.pionex.com 手順: シンボルの作成 CreateSymbols = true を選択 MT5ターミナルを再起動 ( 重要! ) マーケットウォッチでシンボルを選択 し、履歴とリアルタイムデータをロード モード: LiveUpdate – チャートにユーティリティを追加し、取引データを取得 History – 過去の履歴データを指定した日付と時間まで埋める 設定: MaxDate – 更新したい履歴の日付を選択 ALL – 指定した日付から履歴を埋める AutoUpdate = true – MT5を再起動するたびに履歴を自動更新

Rajesh Kumar Nait
Rajesh Kumar Nait
To be a successful trader
1. Learn to adapt as per situation
2. Never Be Determined
Rajesh Kumar Nait
Rajesh Kumar Nait
Myths for me which I completely disagree:
1. News and Fundamental analysis impact market but it also go against technical analysis or price action
2. Using an indicator can make you successful
3. Fibonacci calculations does not work
4. You do not need custom analysis assistant build on mt5 or other program before you do analysis
5. You can trade and be successful from smartphone or tablet or promotion of portability in trading.
Rajesh Kumar Nait
パブリッシュされた投稿Crypto Ticks and Depth Documentation
🔥 CRYPTO TICKS 🔥 🚀 Next-Gen Market Data Streaming 🚀 🌟 Supports Multiple Exchanges: 🔹 Binance (Spot & Futures) | Kucoin | Bybit (Futures & Inverse Futures) | XT : Xt.com Spot and Futures ⚡ Key Features: ✅ Robust Auto Re-connection – Never miss a tick...
Rajesh Kumar Nait
Rajesh Kumar Nait
Is there any way to draw MA only between two indices and not whole chart?
Rajesh Kumar Nait
Rajesh Kumar Nait
How can I use my GTX 970 in trading research?
1. Running Trading & Charting Software
Most trading platforms (e.g., TradingView, NinjaTrader, MetaTrader, ThinkorSwim) rely more on CPU, but they also use GPUs for rendering charts and handling multiple monitors. GTX 970 can:

Smoothly run multiple charts and indicators.
Handle multiple monitors (good for multi-timeframe analysis).
Speed up heatmaps and visualizations of market data.
2. Accelerating Data Analysis & Backtesting
If I am using Python for market research, I can use NVIDIA’s CUDA for faster computations.

Backtesting libraries: I may Use Backtrader or Zipline with GPU acceleration for strategy testing.
Data analysis: Use cuDF (GPU-accelerated pandas) to handle large market datasets faster.
Machine learning: If you're training AI models for price prediction, NVIDIA’s TensorFlow with CUDA can offload computations to your GPU.
3. Running AI/ML Models for Market Prediction
Even though the GTX 970 is older, it supports TensorFlow/PyTorch (CUDA 11.x max) for basic ML models.
I can train simple neural networks for pattern recognition in stock price movements.
Use libraries like TA-Lib (technical analysis indicators) along with GPU-accelerated data processing.
4. GPU-Accelerated Quantitative Research
Monte Carlo simulations: Speed up simulations for option pricing or risk analysis.
Reinforcement Learning (RL): Experiment with Deep Q-Learning (DQN) for algo trading.
Order Book Analysis: Use GPU-accelerated tools for processing high-frequency trading (HFT) data.
5. Cryptocurrency & Alternative Markets
If I trade crypto, GPU acceleration helps in on-chain analysis, sentiment analysis, or even mining
Some platforms like Cryptohopper or 3Commas allow GPU-based automation for backtesting trading bots.
Limitations of GTX 970 for Trading
✅ Good for visualization, backtesting, and basic AI research.
❌ Not great for heavy deep learning or handling massive datasets.
❌ Limited VRAM (4GB) makes it unsuitable for high-end models.