Rajesh Kumar Nait / Profil
- Information
|
3 Jahre
Erfahrung
|
32
Produkte
|
43
Demoversionen
|
|
0
Jobs
|
0
Signale
|
0
Abonnenten
|
Hallo, ich bin Rajesh, ein MQL-Entwickler mit einem Bachelor-Abschluss in Informationstechnologie. Mit über 12 Jahren Programmiererfahrung bin ich vom PHP-Entwickler, spezialisiert auf Webentwicklung, zum Vollzeit-MQL5-Programmierer und Kryptowährungshändler gewechselt.
In meiner aktuellen Rolle konzentriere ich mich darauf, täglich $SOL als Daytrader zu handeln und hochmoderne Programme zum Verkauf auf meiner Verkäuferseite anzubieten. Diese Programme umfassen native WebSocket-Krypto-Börsenverbindungsdienstprogramme und laden Diagramme von allen gängigen Börsen über WebSocket und API. Sie laufen nahtlos auf VPS und benötigen keine externen DLLs.
Wenn Sie an der Analyse von Kryptowährungsdiagrammen oder Handelstools interessiert sind, können Sie mich gerne per DM kontaktieren. Überprüfen Sie meine Kryptoprodukte und Börsenintegrationen auf meiner MQL5-Verkäuferseite. Ich biete 12 Stunden Support pro Tag in der IST-Zeitzone an, 7 Tage die Woche.
Alle Produkte sind für einen begrenzten Zeitraum mit einem Rabatt von 30% erhältlich. Verpassen Sie nicht die Gelegenheit!
Freunde
204
Anfragen
Ausgehend
Rajesh Kumar Nait
Beitrag Ways to capture signals from an EX5 (when MQ5 not available) veröffentlicht
Here are some ways : Monitor trades / positions (most reliable) Watch for new deals/orders/position changes using OnTradeTransaction() or by snapshotting PositionsTotal() and PositionGet... properties...
In sozialen Netzwerken teilen · 1
154
Rajesh Kumar Nait
Beitrag Binance MT5 Crypto Trading Tool Documentation veröffentlicht
Product Link : https://www.mql5.com/en/market/product/110015 1. You need to add your API key and secret in Input field of this utility. When you create your API, make sure you enable Futures to trade Futures 3...
Rajesh Kumar Nait


Saransh Kankane
2025.07.30
hi brother, is it a ipad you using ? how come running Meta Trader on ipad?
Rajesh Kumar Nait
Market strucure has phases
1. Continuation
2. Consolidation
3. Reversal
Do you wonder why price becomes choppy sometimes? Earlier I had no idea about it but when I improvized my strategy I came to know that sometime on crypto usually on weekends, Price keeps some targets pending but keep making micro patterns which fails. For example - A major impulse is made. Inside this impulse many micro impulses also exists. If your strategy is based on Impulse then if you fail to validate if target of major impulse is pending and trade micro impulses then your losing chances becomes so high because biggies already added their order on major impulse now they are waiting for price to reach a target but you may bet against their direction because of micro impulse structures and this becomes a reason of loss. A trader said good entries only comes few times a day, its true, because we should only find and trade Major structures.
Rajesh Kumar Nait
When you master the art of trading, then you only need two things to avoid failure
1. Any solution to avoid human error by 100% such as coding your EA
2. Confidence : Be confident about losing, accept the loss and never bet on any non-mechanical system which works on emotions or no logic.
If you have given 5 years on mastering your strategy, the moment you change your strategy you become a noob again. You, Mr. X and Mr. y all are profitable but the moment you try Mr. X's strategy you start losing. strategies are not sharebable info. They require mastering for years.
Rajesh Kumar Nait
When you have nothing to explore and nothing to edit, it looks boring but some day your research needs to end and you must admit that there is nothing more to find out in this market. One day when you will solve the market and understand the cause of its movement and earn money from it then your life's struggling phase will end and a new era will begin where you can freely watch movies, travel everyday or have financial freedom and your EA will keep tracking all you had in your mind.
Rajesh Kumar Nait
1 minute timeframe = toughest to solve, can start trading with $10, 1 week timeframe = easiest for technical analysis, cant trade for less than $10k. Which you choose?
Rajesh Kumar Nait


I believe these features are still needed for MT5 natively
1. Undo Redo on Chart
2. Max zoom to candle
3. Seconds Timeframe
4. Renko Chart
5. More easier chart alert system
6. Risk reward tool
7. Draw / Brush tool
1. Undo Redo on Chart
2. Max zoom to candle
3. Seconds Timeframe
4. Renko Chart
5. More easier chart alert system
6. Risk reward tool
7. Draw / Brush tool
Rajesh Kumar Nait


I do not use any indicator to trad. But i have some belief in these two powerful indicators only : VWAP and TWAP
Conor Mcnamara
2025.05.28
I use a select few which are reliable, fast, and non repainting. Then I'll use only one qualitative indicator for statistical reasons. I don't like seeing a chart without indicators personally because I dislike visual chaos, I prefer to see organized chaos
Rajesh Kumar Nait
2025.05.29
That's great. Mus use what works in making $$$ and your analysis strong.
Rajesh Kumar Nait


I was about to buy Snapdragon Laptop but just nearly got saved when I knew MT5 does not have an ARM build. What would we do with battery life if we are not able to open MT5 natively ? :)
Alle Kommentare anzeigen (5)
Rajesh Kumar Nait
2025.05.29
Qualcomm is a chip manufacturing company for smartphone and tablet. My smartphone has snapdragon 888 processor by qualcomm
Rajesh Kumar Nait


Conor Mcnamara
2025.05.27
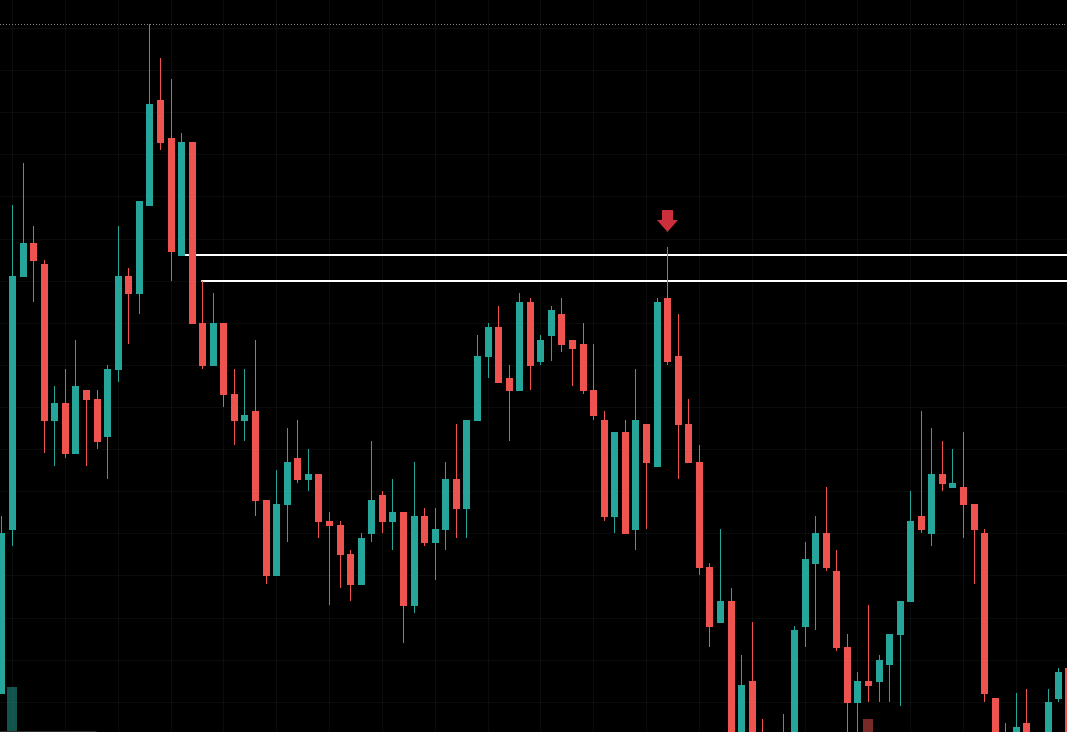
People backtested it to find that it's not truly stable by itself since the pattern can be broken sometimes, but it is still a thing that's significant. My idea would just be to confirm it with other analysis. Usually it respects a level of resistance or support, but if there's no known resistance or support then I might not trust it
Rajesh Kumar Nait
2025.05.27
yes maybe it works in combination of Break of structure, Shift of structure and Inducement
Conor Mcnamara
2025.05.27
what I see is that any time there's demand, there are lots of retail traders wanting to chase it, next thing there's an FVG and many people are liquidated because of fear and trading before the FVG took place, so I think this is a key time when institutional traders apply the inducement strategy. so when I see demand, I'm waiting, because it is good to anticipate the formation of the fvg. PO3 concept is a real phenomenon that repeats.
Rajesh Kumar Nait


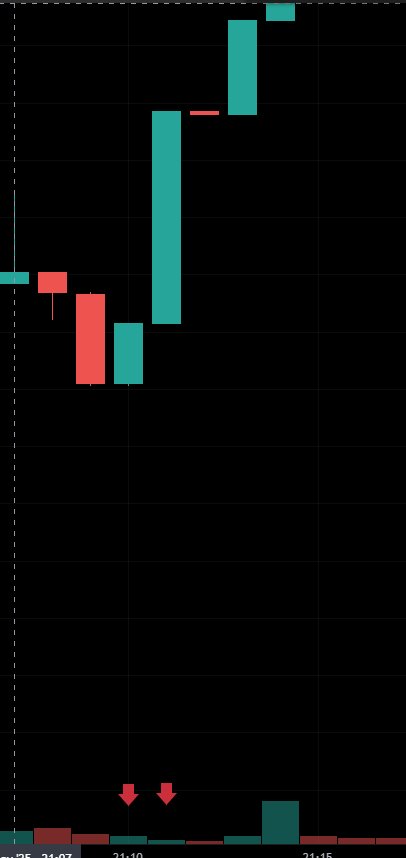
I am unable to post indicator for this for some reasons but here is interesting concept. ❓Why Is Candle Range Increasing While Volume Is Low?
This is counterintuitive, but there are solid market microstructure reasons why this happens:
🔍 1. Liquidity Vacuum / Stop-Hunt Trigger
When a market rapidly moves up on low volume, it often means:
Liquidity was thin on the sell side.
A few aggressive buyers cleared the sell wall, triggering:
Stop-losses from shorts (adding buy pressure).
Limit orders above recent lows (creating a vacuum effect).
Result: Price jumps quickly, but volume is still low because not many contracts needed to be traded to move price.
🧠 Think of it like this:
"Price moves the fastest when nobody is willing to sell anymore — not when everyone's buying."
🔍 2. Passive Sellers Withdrew Orders
Another reason: Market makers pulled liquidity because the prior candles looked weak, and they didn’t want to get caught in a reversal.
With fewer passive limit sell orders in the book, even small buy orders push price up more.
This shows up as big candles but low volume.
🔍 3. False Sense of Demand – It’s Not Strength (Yet)
Sometimes big candles on low volume are fake breakouts or traps:
It looks strong, but it’s mostly short covering or bot-driven.
If buyers don’t step in after that candle, it may reverse again — so you want to see confirmation with volume after the big move.

Conor Mcnamara
2025.05.26
Most of the time I would say it's a fake breakout that you don't want to trade, big investors putting in big capital to shake the market
:


