Oleg Papkov / プロファイル
- 情報
|
9+ 年
経験
|
11
製品
|
232
デモバージョン
|
|
0
ジョブ
|
0
シグナル
|
0
購読者
|
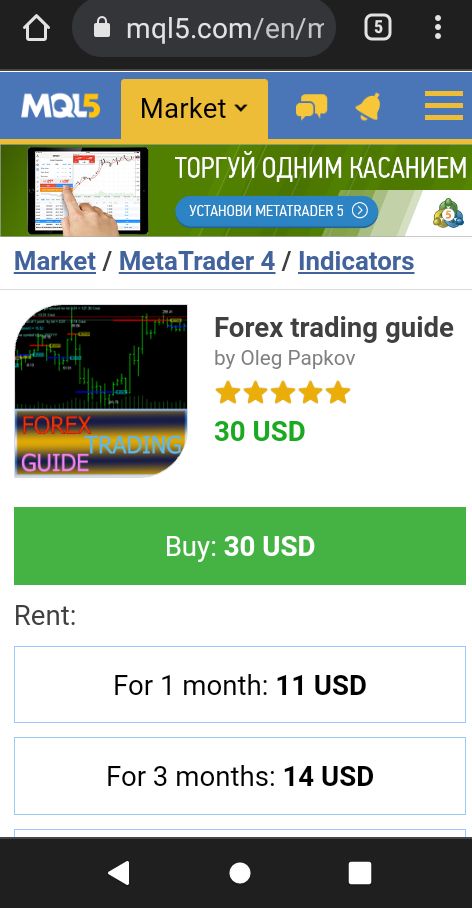
The Forex Trading Guide indicator works based on the standard RSI indicator with an adjustable period. Crossing the internal level calculated mathematically, the indicator gives a signal for opening a trade in a certain direction, showing it on the price chart with the corresponding line (blue - deal up, red - deal down) and the price label of the corresponding color. In other words, if the previous directive was to deal down (the line and the price label in red), then the next directive will be to reverse the deal, deal up (the line and the price label in blue). Appearance of a deal directive is preceded by the appearance of a white line with the price label, colored accordingly. That is, the appearance of a white price label indicates that the intersection of the signal levels has taken place in the indicator;s calculations, and it is necessary to reverse the deal.
The indicator is drawn from the leftmost visible bar to the bar with index 0, i.e. current. The very first leftmost bar (if it is visible on the chart) will be the starting bar for the indicator calculations.
The indicator provides the ability to link the current or manually specified spread, selected lot, selected exchange rate of the national currency to the deposit currency, as well as the multiplier (equal to 100, in case a cent account is used) and price levels assigned by the indicator in order to plot the profitability curve, which shows the estimated accuracy. The profitability curve is designed to simplify the selection of an instrument and its spread for the deposit. The indicator reports the required account margin and the value of one point in the national currency for the selected lot size. It also shows the costs for the current or manually specified spread. The type of the instrument, the direct, indirect quotes and cross rates are reported.
The strategy profitability curve (estimated accuracy) is based on the calculated amount of points between the signal lines with consideration of the spread for the specified lot. The equivalents in the recalculated national currency according to the data entered in the input parameters are indicated above and below the signal lines.
https://www.mql5.com/en/market/product/23038?source=Site+Profile+Seller#description

https://www.mql5.com/ru/market/product/23038?source=Site+Profile+Seller

https://www.mql5.com/ru/users/novocel_ol/seller


The Grid stability plus semi automatic expert Advisor trades on the signals of the RSI indicator. Trades are made in different directions when the indicator reaches values of 30 or 70 . If the indicator is greater than 70 , the Short direction is selected for initial trades, and if the indicator is less than 30 , the Long direction is selected. Profitable trades are closed by take profit. Unprofitable ones are processed by the expert Advisor using the averaging method, a network of transactions
The EA uses the Stochastic indicator. Long and Short trades are opened each in their own range of indicator levels. The lot of transactions changes depending on the established risk level and the results of previous transactions. The EA has two modes of use. 1-without using the averaging network. 2 - using the averaging network. To choose from, according to your preferences. The settings for these modes are different. The default settings are optimized for EURGBP M15 in non-network averaging
クルーズ船 Ship Cruise expert Advisorは、RSIインディケーター信号で取引を行います。 インジケータが30または70の値に達したときの取引は、一方向または他に作られています。 収益性の高い取引は、テイク利益で閉鎖されています。 不採算のものは平均化メソッドを使用してエキスパートアドバイザーによって処理され、トランザクションのネットワークは同じ方向に構築され、損益 選択された楽器(通貨ペア)、口座、預金の初期パラメータを選択するために最適化することは非常に簡単です。 短いまたは長い一方向のすべての取引は、接続の損失の場合には保護され、同じストップロスを持っています。 TPSLマネージャは、平均化ネットワークの状態とその方向の取引数に応じて、総ストップロスの位置を変更します。 設定オプション。 セクション"取引時間" Hours_to_GMT_Offset-ブローカーのサーバーからの既知のGMTタイムオフセットクロック。 時間-オン/オフ。 Begin_hour-開始する時間; End_hour時間の終わり;


