• 情報
no
経験
10
製品
2
デモバージョン
0
ジョブ
0
シグナル
0
購読者
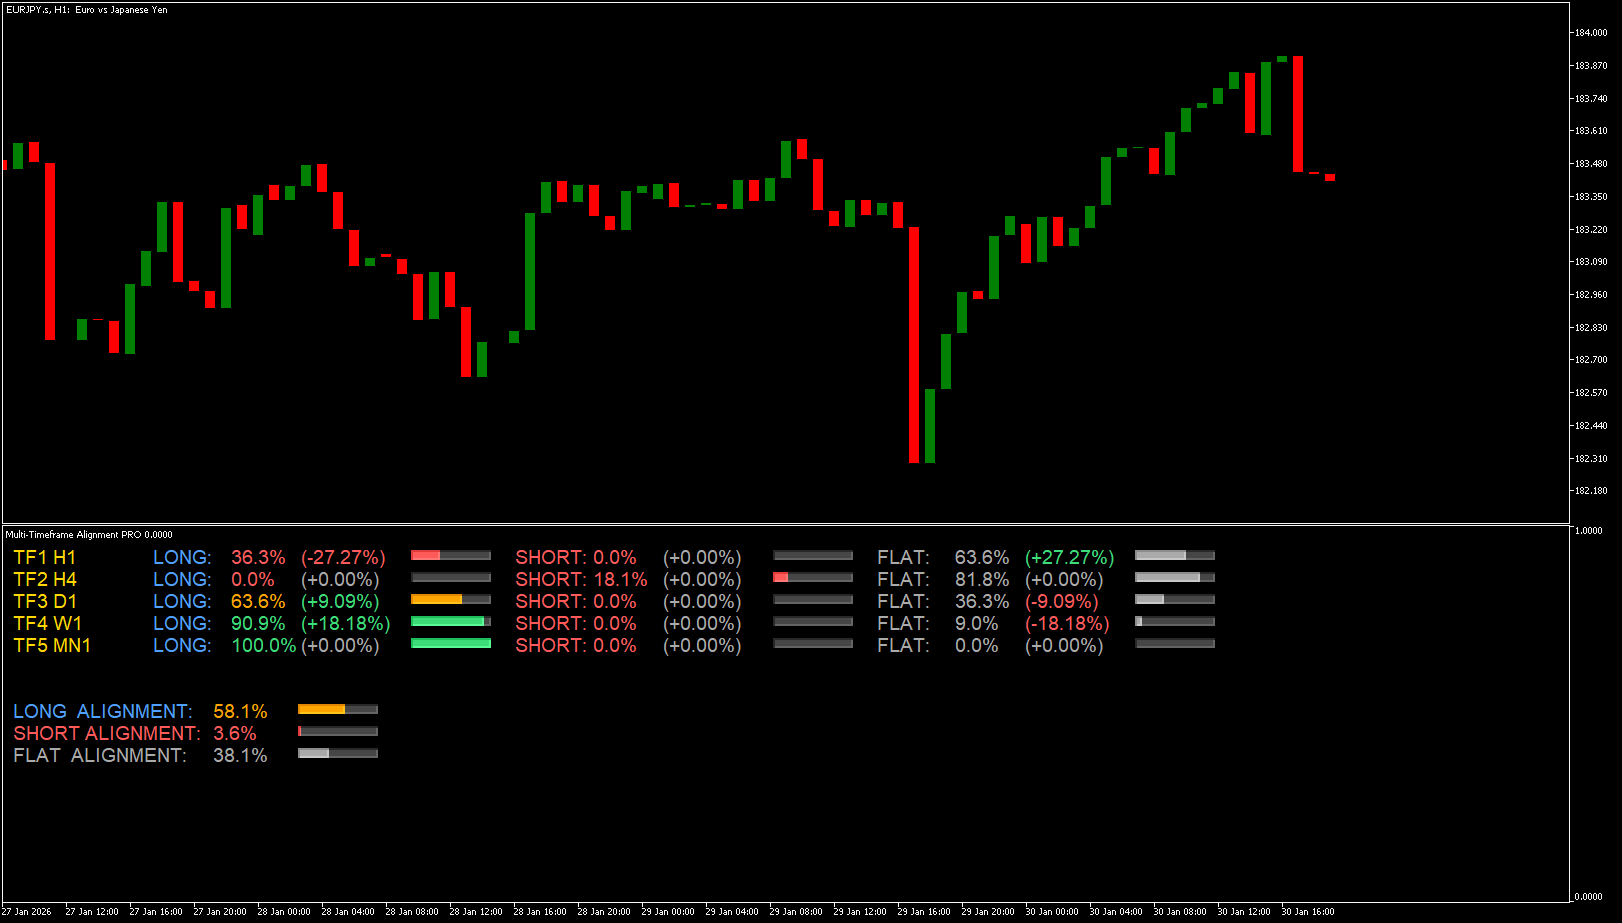
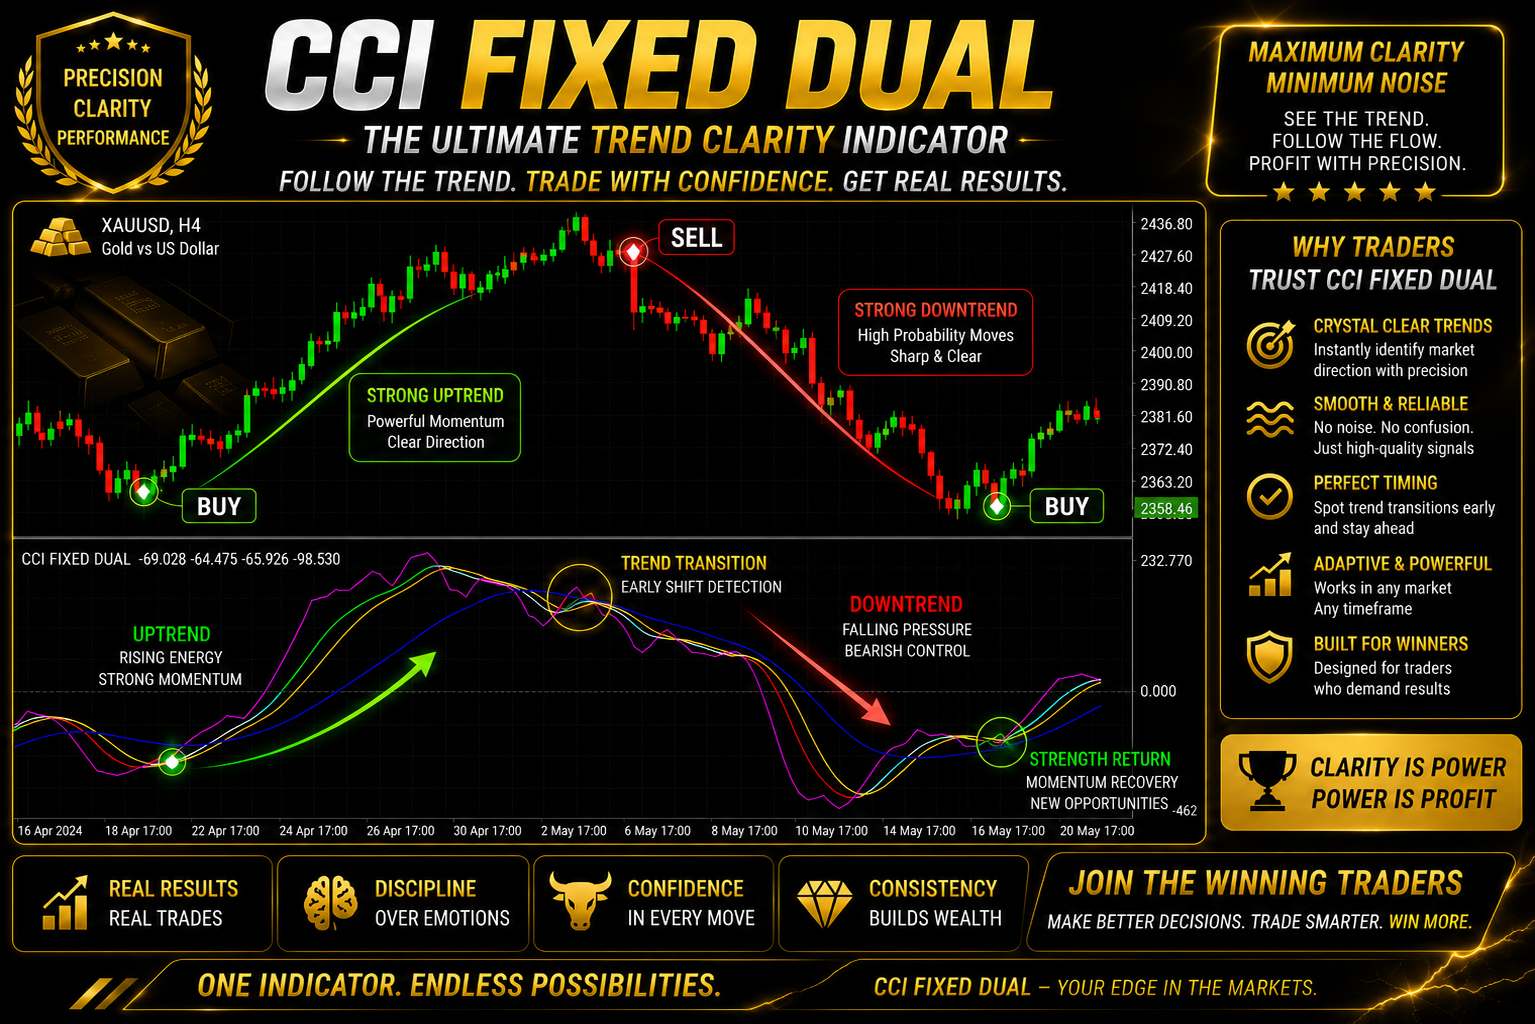
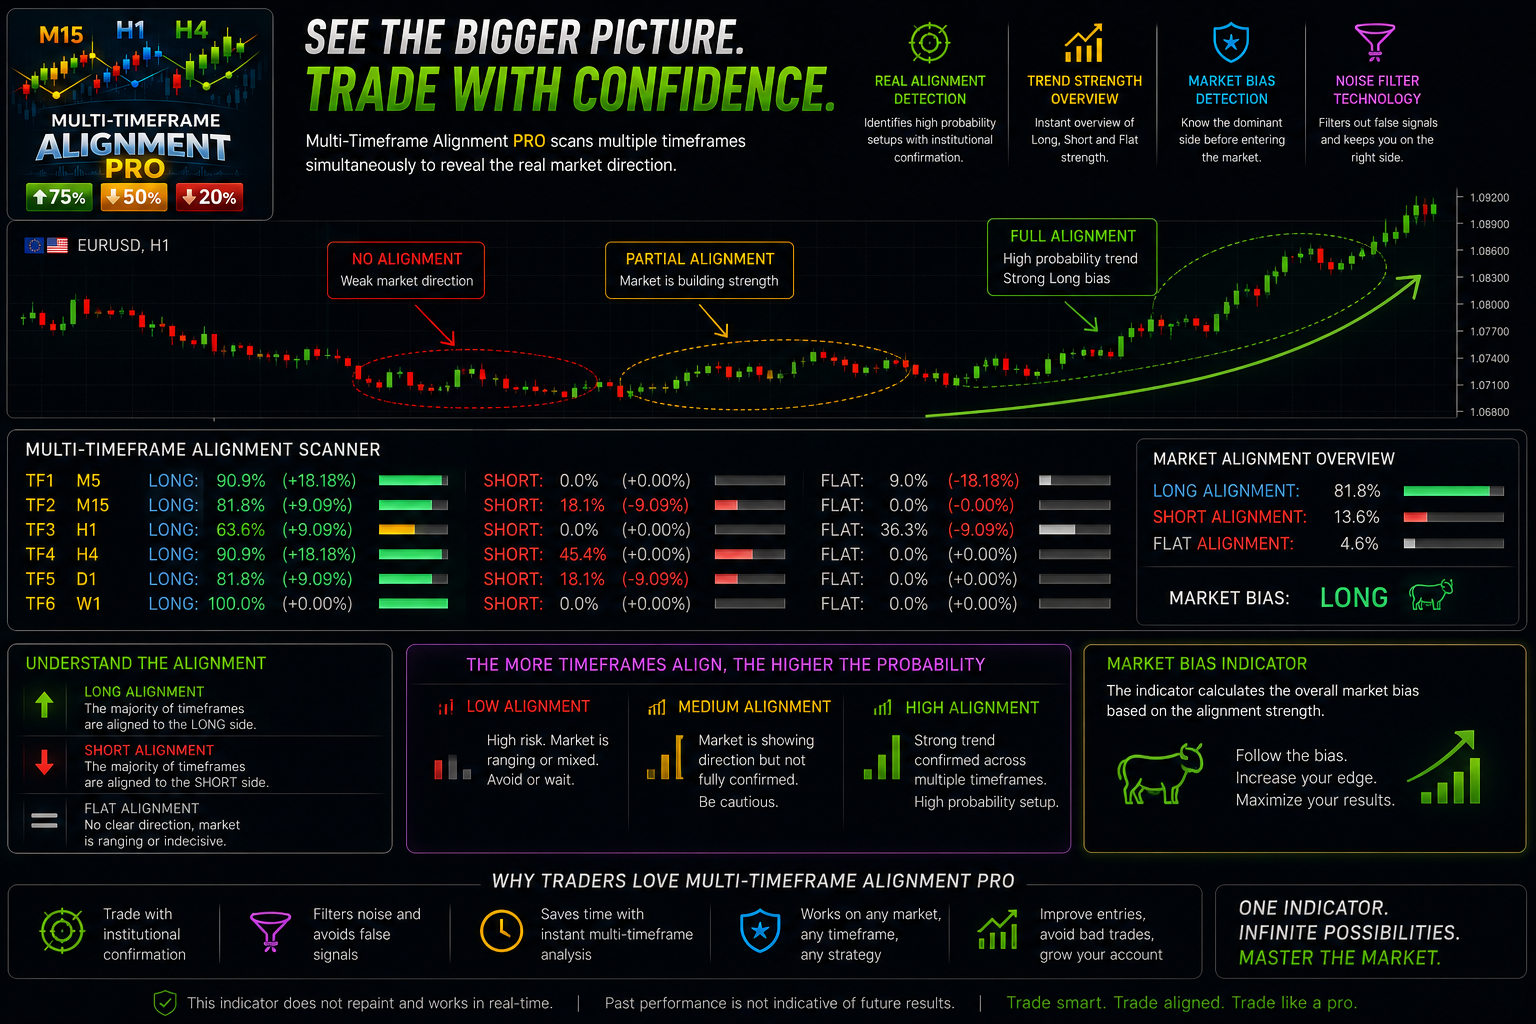
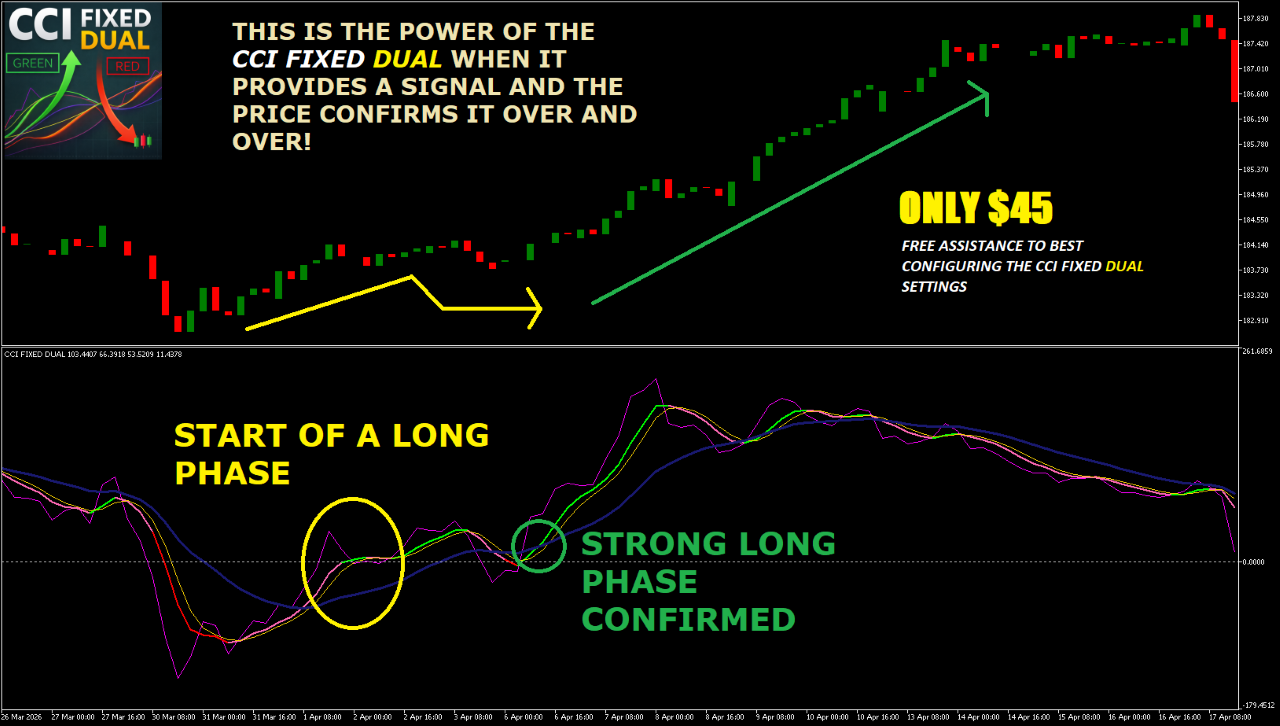
私はプロのトレーダーであり、MT5開発者です。トレーディングおよび意思決定支援のための高度なツール開発に数年の経験があります。市場のトレンドを分析し、トレーディング戦略を改善するためのシステムと視覚的ツールを作成しています。

私のツールは自動売買シグナルを生成するものではありませんが、経験豊富なトレーダーや初心者の両方に明確で即時のテクニカル分析サポートを提供します。

戦略、最適化、MT5の高度な取引ツールの使用に関する記事や更新をフォローしてください。
Edoardo Centorame
Edoardo Centorame
📊The Importance of Major Stock Market Indices
Stock market indices are essential tools for traders and investors. They represent the overall performance of a basket of stocks and provide a snapshot of the economic health of a country or region. In simple terms, they help measure market sentiment and identify broader trends.
🔹 🇺🇸 United States – S&P 500 & Dow Jones Industrial AverageThe S&P 500 tracks 500 of the largest U.S. companies and is widely considered the main benchmark for the American stock market. The Dow Jones Industrial Average (DJIA), composed of 30 major corporations, is one of the oldest and most closely followed indices in the world.
🔹 🇬🇧 United Kingdom – FTSE 100The FTSE 100 includes the 100 largest companies listed on the London Stock Exchange. It serves as a key indicator of the UK market and often reflects global economic trends due to the international exposure of its components.
🔹 🇩🇪 Germany – DAXThe DAX represents major German blue-chip companies listed on the Frankfurt Stock Exchange. It is a primary gauge of Europe’s largest economy.
🔹 🌏 Asia – Nikkei 225 & Hang Seng IndexThe Nikkei 225 (Japan) and the Hang Seng Index (Hong Kong) are leading benchmarks for Asian markets and are closely watched for signals about regional and global economic momentum.
⭐ Why are indices important for traders?👉 They reflect overall market sentiment (risk-on vs. risk-off).👉 They serve as benchmarks to evaluate portfolio performance.👉 They are the foundation for ETFs, futures, and other derivatives, allowing diversified exposure through a single instrument.
Monitoring major indices helps traders align their strategies with broader market direction and make more informed decisions. 📈

February 25, 2026
Edoardo Centorame
Edoardo Centorame
In Forex trading, correlations between currency pairs are a key tool for managing both risk and opportunity.

When two pairs are positively correlated, they tend to move in the same direction (e.g. EUR/USD and GBP/USD). When they are negatively correlated, they usually move in opposite directions (e.g. EUR/USD and USD/CHF).

Understanding correlations helps you to:

✔️ Avoid overexposure to the same underlying risk
✔️ Improve portfolio diversification
✔️ Strengthen technical analysis with cross-market confirmation
✔️ Manage hedging and risk more effectively

Ignoring correlations often means increasing risk without realizing it. A disciplined trader always keeps them under control before entering the market.

February 19, 2026
Edoardo Centorame
Edoardo Centorame
In trading, mathematics is not optional — it’s the foundation. 📊
Every informed decision comes from numbers: probability, statistics, risk management, and the risk–reward ratio. Without mathematics, trading is instinct; with mathematics, it becomes strategy.

Indicators, algorithms, and automated systems work because they are built on mathematical models that measure what the eye can’t see: volatility, trends, and cycles.
Mathematics doesn’t eliminate losses, but it allows you to control them — and in the long run, that’s what separates those who survive the markets from those who don’t.

👉 In trading, winners are not those who guess, but those who calculate better.

February 17, 2026
Edoardo Centorame
Edoardo Centorame
📈 What are stock dividends?

In trading and equity investing, dividends are a portion of a company’s profits that are distributed to shareholders. When you own a dividend-paying stock, you receive a cash payment (usually quarterly or annually) simply for holding the shares.

💰 Why are dividends important?

They provide passive income, independent of price movements

They often signal a financially strong and stable company

They can be reinvested to compound returns over time

⚠️ Dividends and trading
In the short term, a stock’s price usually drops on the ex-dividend date, so traders must factor this into their strategies.

👉 In short: dividends are not just a way to earn income, but also a key indicator of company quality and an important element in medium- to long-term investment strategies.

February 13, 2026
Edoardo Centorame
Edoardo Centorame
💰 CAPITAL & POSITION SIZE: RULE #1 IN TRADING

In trading, it’s not just about good entries,
it’s about how much you’re risking.

📊 Capital must be protected — without it, you’re out of the game.
📐 Position size must always be proportional to your account, not to emotions or confidence in a signal.

❌ Oversized positions = account damage
✅ Consistent risk = survival and growth

📈 Profits come after proper risk management.

🧠 Protect the capital. Everything else is a consequence.

February 11, 2026
Edoardo Centorame
Edoardo Centorame
In trading, timeframe alignment is one of the key factors for increasing the probability of success. When the trend on higher timeframes (such as weekly or daily) is aligned with lower timeframes, the market moves in the same direction across multiple levels. This results in less noise, clearer signals, and more disciplined decision-making.

Equally important is trading with the trend. Going against the trend exposes traders to sudden reversals and frequent stop-outs, while trading in the direction of the trend allows you to take advantage of the market’s strength. The trend reflects the collective behavior of market participants—ignoring it means fighting the market.

In short: aligned timeframes + a clear trend = better risk control and higher-quality trading opportunities.

09 February 2026
Edoardo Centorame
Edoardo Centorame
Modern trading is no longer about guesswork.
Today’s traders combine data, algorithms, and disciplined risk management to navigate fast and complex markets. Technology has leveled the playing field, but success still depends on mindset: patience, consistency, and respect for risk. In modern trading, strategy beats emotion—every time.

Simple modern indicators:
https://www.mql5.com/it/market/product/163680?source=Site+Market+MT5+Indicator+Search+Rating006%3aTrend+vision
https://www.mql5.com/it/market/product/163689?source=Site+Market+MT5+Indicator+Search+Rating006%3amulti+timeframe+alignment

February 6, 2026
Edoardo Centorame
Edoardo Centorame
Market Cycles and Their Importance

Financial markets move in cycles driven by psychology, liquidity, economic growth, and monetary policy. These cycles—typically divided into accumulation, expansion, distribution, and contraction—help explain why prices rise and fall over time rather than moving in a straight line.

Understanding market cycles is crucial for investors and traders because it improves timing, risk management, and decision-making. Recognizing where the market stands in a cycle can help avoid emotional mistakes, reduce exposure during risky phases, and take advantage of opportunities when probabilities are more favorable. In short, market cycles provide a framework to interpret price action and align strategies with broader market dynamics.

Indicator for drawing cycles: https://www.mql5.com/it/market/product/161510?source=Site+Market+MT5+Indicator+Search+Rating006%3acycles+plotter

February 5, 2026
Edoardo Centorame
Edoardo Centorame
The 1929 crisis, often called the Great Depression, began with the stock market crash in the United States in October 1929. It was caused by overproduction, excessive speculation, and weak financial regulation. When stock prices collapsed, banks failed, businesses closed, and millions of people lost their jobs. The crisis quickly spread from the U.S. to the rest of the world, leading to a decade of economic hardship, poverty, and social instability, until recovery gradually began in the late 1930s.

February 4, 2026
Edoardo Centorame
Edoardo Centorame
The importance of indicators in trading

Trading indicators are essential tools that help traders analyze market behavior and make more informed decisions. They transform raw price data into clear signals, making it easier to identify trends, momentum, volatility, and potential entry or exit points. While indicators do not predict the market with certainty, they reduce emotional trading and provide a structured, objective approach to understanding price movements. When used correctly and in combination with good risk management, indicators can significantly improve consistency and discipline in trading.

February 3, 2026
Edoardo Centorame
Edoardo Centorame
🚀 Multi-Timeframe Alignment PRO is OUT! 🚀

The PRO version of Multi-Timeframe Alignment has officially been released, bringing deeper analysis, smarter alerts and a fully professional trading experience.

Compared to the free version, Multi-Timeframe Alignment PRO introduces:
✔ Support for up to 5 configurable timeframes
✔ Visual strength bars for LONG, SHORT and FLAT percentages
✔ Percentage change tracking from the previous closed bar
✔ A powerful NO → YES smart alert system
✔ Push notifications to your phone via MetaTrader 5
✔ Cleaner visuals and a more professional layout

All calculations are based on closed bars only, ensuring stability, clarity and no repainting.

If you trade with context and want to know when multiple timeframes truly align, this PRO version is built for you.

👉 Download available here: https://www.mql5.com/en/market/product/163689?source=Site+Market+MT5+Indicator+Rating006
Edoardo Centorame パブリッシュされたプロダクト

Multi-Timeframe Alignment PRO   Multi-Timeframe Alignment PRO は、複数の時間足を同時に分析し、市場のアラインメント(方向の一致度)を分かりやすいパーセンテージで表示する高度なインジケーターです 📊 このインジケーターの目的はとてもシンプルです。複数の時間足が同じ方向に動いているかどうかを把握し、トレード判断の質を高めることです。 PRO バージョンは、単なるベース版の見た目の改良ではありません。より深い分析、より高いコントロール性、そして実戦・プロ用途のために設計されたインテリジェントなアラートシステムを備えています。 🧠 マルチタイムフレーム・アラインメントとは(やさしい説明) 各時間足は異なるストーリーを語ります。短期足は上昇、 中期足は横ばい、 長期足は下降という場合もあります。 複数の時間足が同じストーリーを語るとき、市場はより整理され、読みやすくなります。 このインジケーターは、選択した時間足が LONG 📈、SHORT 📉、または FLAT ⏸️

Edoardo Centorame
Edoardo Centorame
📢 Trend Vision PRO – Now Available 🚀
The advanced, multi-timeframe evolution of the free Trend Vision Daily 📊
What’s new in the PRO version:
✅ Full multi-timeframe support (from M1 to Weekly, NO M30)
🔄 Automatic timeframe mapping based on the current chart
📈 Quarterly trend included on the Weekly timeframe
🧠 Clean, stable logic using closed bars only
🛠 Designed as a professional trend direction filter
💰 Price: ONLY 30 USD
Trend Vision PRO is not an entry signal, but a powerful tool to identify when the market offers a real directional advantage.
👉 Get the PRO version at the link below: https://www.mql5.com/it/market/product/163680?source=Site+Market+MT5+Indicator+Rating006
Edoardo Centorame パブリッシュされたプロダクト

🔍 TREND VISION PRO とは TREND VISION PRO は、高度で適応型のマルチタイムフレーム・トレンド方向フィルターです。 ほぼすべての実用的な時間足において、市場の方向性を構造的・階層的・文脈的に、かつ自動的で一貫した形で表示することを目的として設計されています。 TREND VISION PRO は TREND VISION DAILY の直接的な進化版です。 DAILY バージョンは、明確で集中した分析を提供するために意図的に日足(D1)のみに限定されていましたが、PRO バージョンでは同じ哲学を拡張し、チャートの時間足に応じて動的に適応する完全なマルチタイムフレーム構造を実現しています。 これはエントリー用のインジケーターではありません。 クラシックなオシレーターでもありません。 TREND VISION PRO は、相場に本当の方向性優位性が存在するかどうか、また統計的に不利な状況かどうかを判断するための、プロフェッショナルな「コンテキスト分析ツール」です。 🧠 基本理念 TREND VISION PRO の基本理念は DAILY

Edoardo Centorame
Edoardo Centorame
The first stock market charts were born from a simple need: to see price movement over time.
In the late 19th century, traders began plotting prices by hand on paper, transforming raw numbers into visual trends.
Pioneers like Charles Dow realized that charts don’t predict the market — they reveal its behavior.
From those early drawings came the foundations of modern technical analysis.

January 30, 2026
Edoardo Centorame
Edoardo Centorame
🚀 New Indicator Released: Multi-Timeframe Alignment

We are excited to introduce Multi-Timeframe Alignment, a powerful context-analysis indicator designed to show how well multiple selected timeframes are truly aligned with each other.

This indicator does not generate entry signals and does not predict the market. Instead, it provides a clear, quantitative view of trend coherence across different timeframes, helping traders better understand market structure and avoid low-quality conditions.

✅ Clean and intuitive visual panel
✅ Multi-timeframe alignment at a glance
✅ Ideal as a trend filter or context tool

🔓 The BASE version is available for FREE, allowing everyone to explore the core functionality of Multi-Timeframe Alignment at no cost.

🚧 A PRO version with extended features and advanced options will be released in the future.

📥 You can download the FREE version here:

👉 https://www.mql5.com/it/market/product/163549?source=Site+Market+MT5+Indicator+Rating006
Edoardo Centorame
Edoardo Centorame
In trading, highs and lows tell a powerful story.
Higher highs and higher lows often signal a strong uptrend, showing that buyers are in control.
Lower highs and lower lows, on the other hand, usually point to a downtrend, where sellers dominate.

By reading these simple structures, traders can better understand market direction, spot potential reversals, and make more disciplined decisions—before emotions take over.

January 29, 2026
Edoardo Centorame
Edoardo Centorame
🚀 New Indicator Released: TREND VISION DAILY

We are excited to announce the release of TREND VISION DAILY, a powerful professional trend direction filter designed to clearly identify the dominant market bias using a structured multi-timeframe approach.

TREND VISION DAILY analyzes market behavior by combining multiple trend and momentum concepts inspired by indicators such as MACD, TRIX, RSI, Bulls and Bears Power, providing a clean and reliable market context.

It is not an entry signal, but a high-quality decision support tool that helps traders understand when the market offers a real directional advantage and when it is better to stay out.

✅ Multi-timeframe logic (Monthly, Weekly, Daily)
✅ Clean and intuitive visual display
✅ No repaint – based on closed candles only
✅ Ideal for swing and position trading

🎁 TREND VISION DAILY will be available for FREE
📥 Download link: https://www.mql5.com/it/market/product/163510?source=Site+Market+MT5+Indicator+Rating006
Edoardo Centorame
Edoardo Centorame
In trading, calmness and emotional detachment are essential.
Clear decisions come from a steady mind, not from fear or excitement.
Staying cool allows you to follow your strategy, manage risk, and think long-term—even when the market tests your nerves.

January 28, 2026
12