|
不
经验
|
12
产品
|
5
演示版
|
|
0
工作
|
0
信号
|
0
订阅者
|
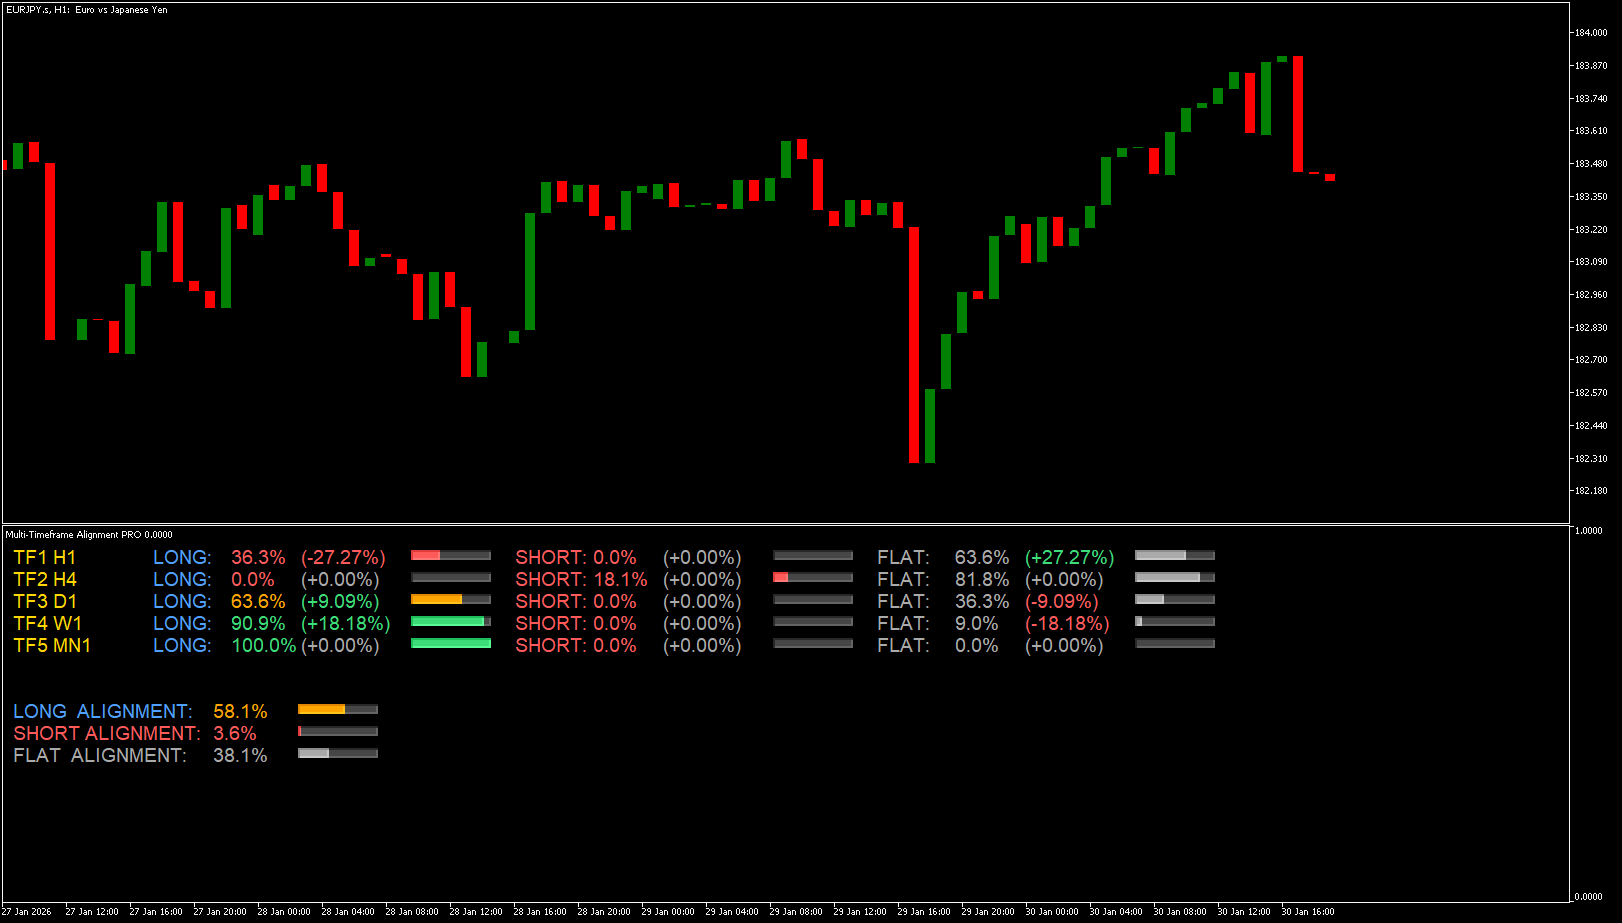
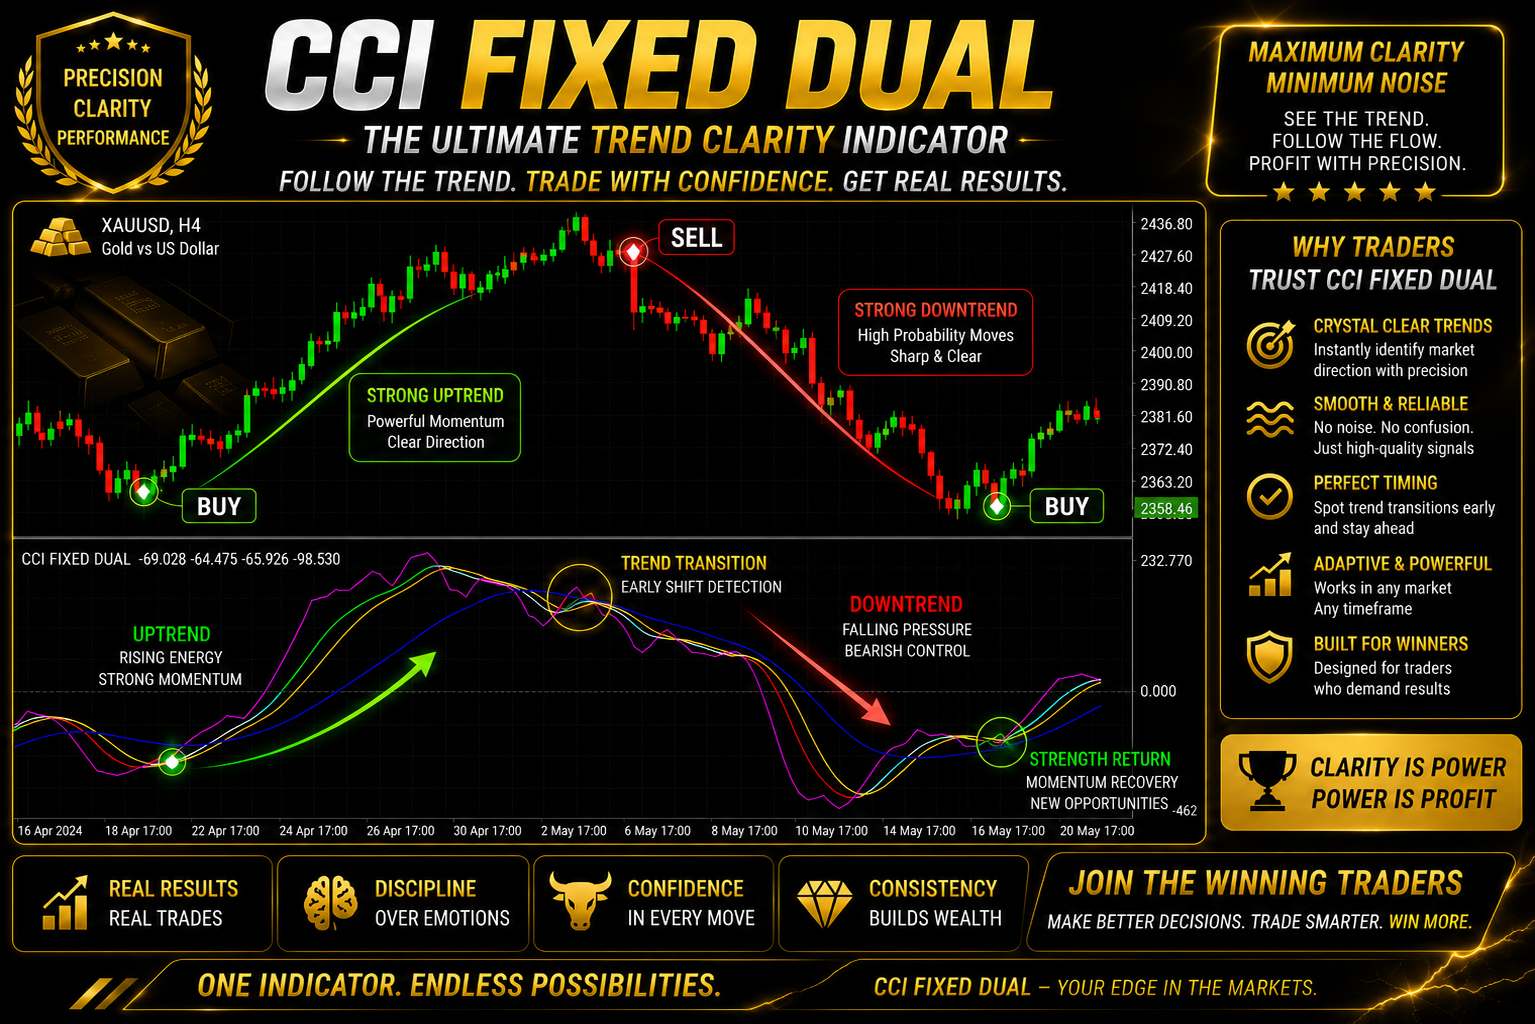
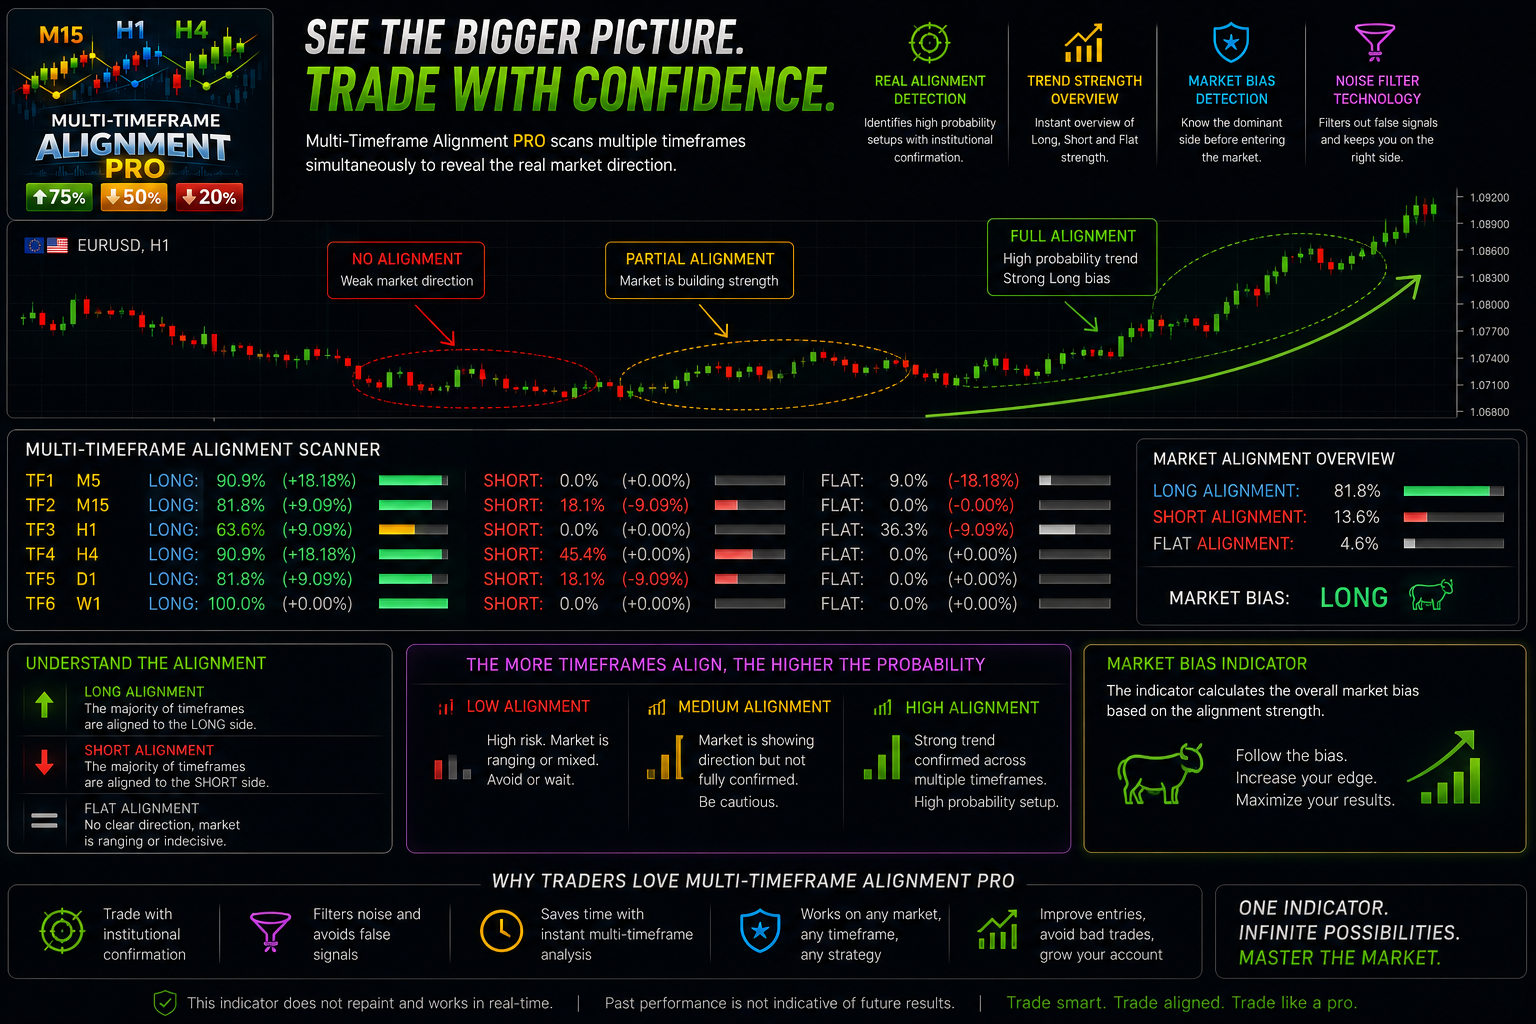
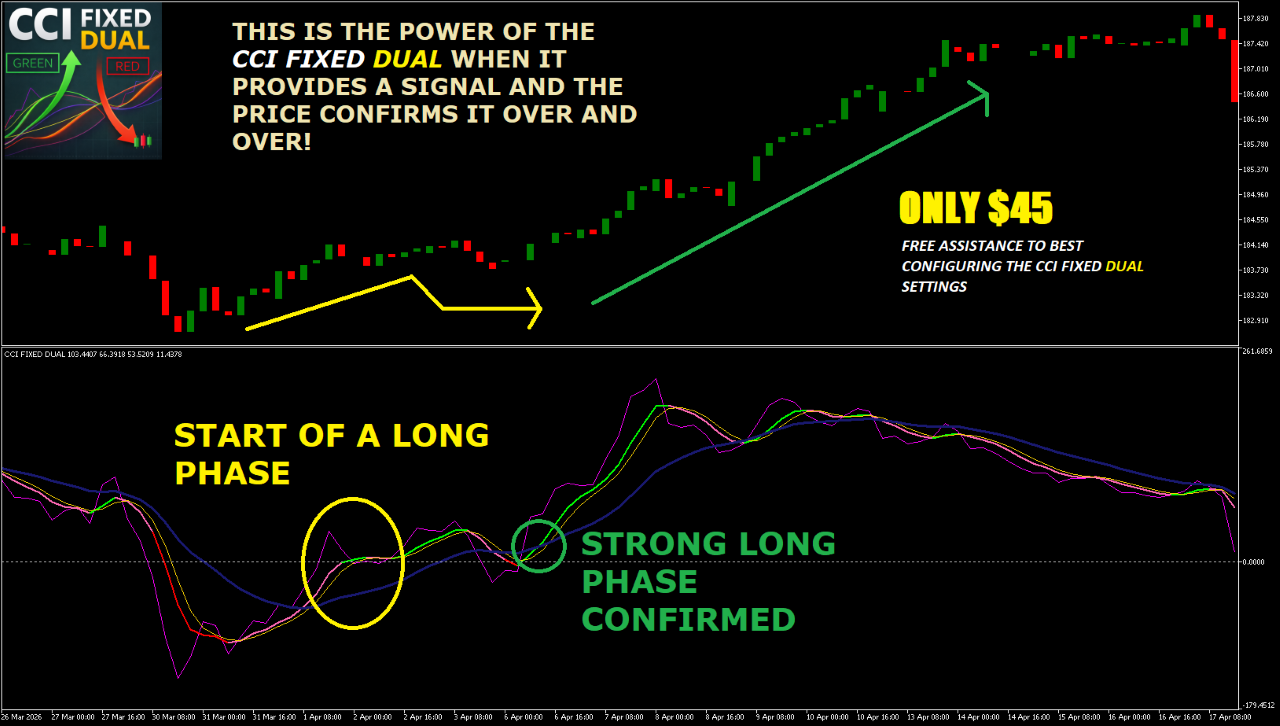
我是专业交易员和MT5开发者,拥有多年交易和开发高级交易工具以支持操作决策的经验。我创建系统和可视化工具,帮助交易者分析市场趋势并优化交易策略。
我的工具不生成自动信号,但提供清晰且即时的技术分析支持,适合有经验的交易者和初学者。
请关注我的文章和更新,了解策略、优化及MT5高级交易工具的使用方法
我的工具不生成自动信号,但提供清晰且即时的技术分析支持,适合有经验的交易者和初学者。
请关注我的文章和更新,了解策略、优化及MT5高级交易工具的使用方法