Dzianis Hnitsevich / 販売者
パブリッシュされたプロダクト

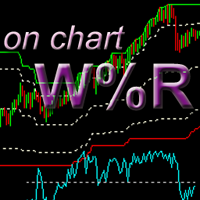
This is a variation of Williams' Percent Range indicator which draws high/low/mid range and overbought/oversold levels directly on the chart, where the last candle Close price corresponds to the %R value. Advantage of this representation is that it is possible to see exact extremum reaches by price (0 and -100 levels) and current price value in regards to overbought/oversold conditions. In addition, this indicator allows tracking price action on a different timeframe (for example, see the price