• 概要
  • レビュー
  • コメント
  • 最新情報

Trend Reversal Identifier

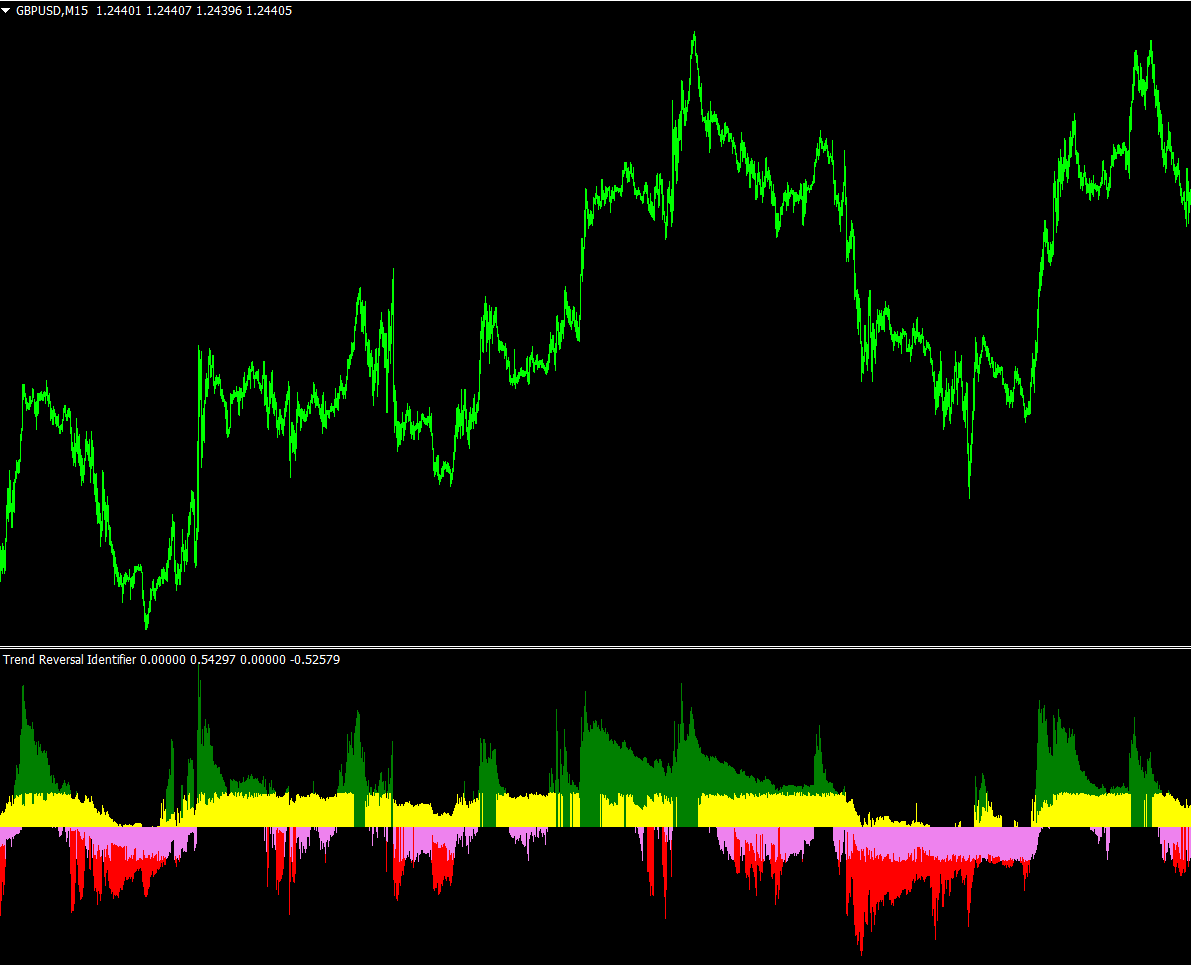
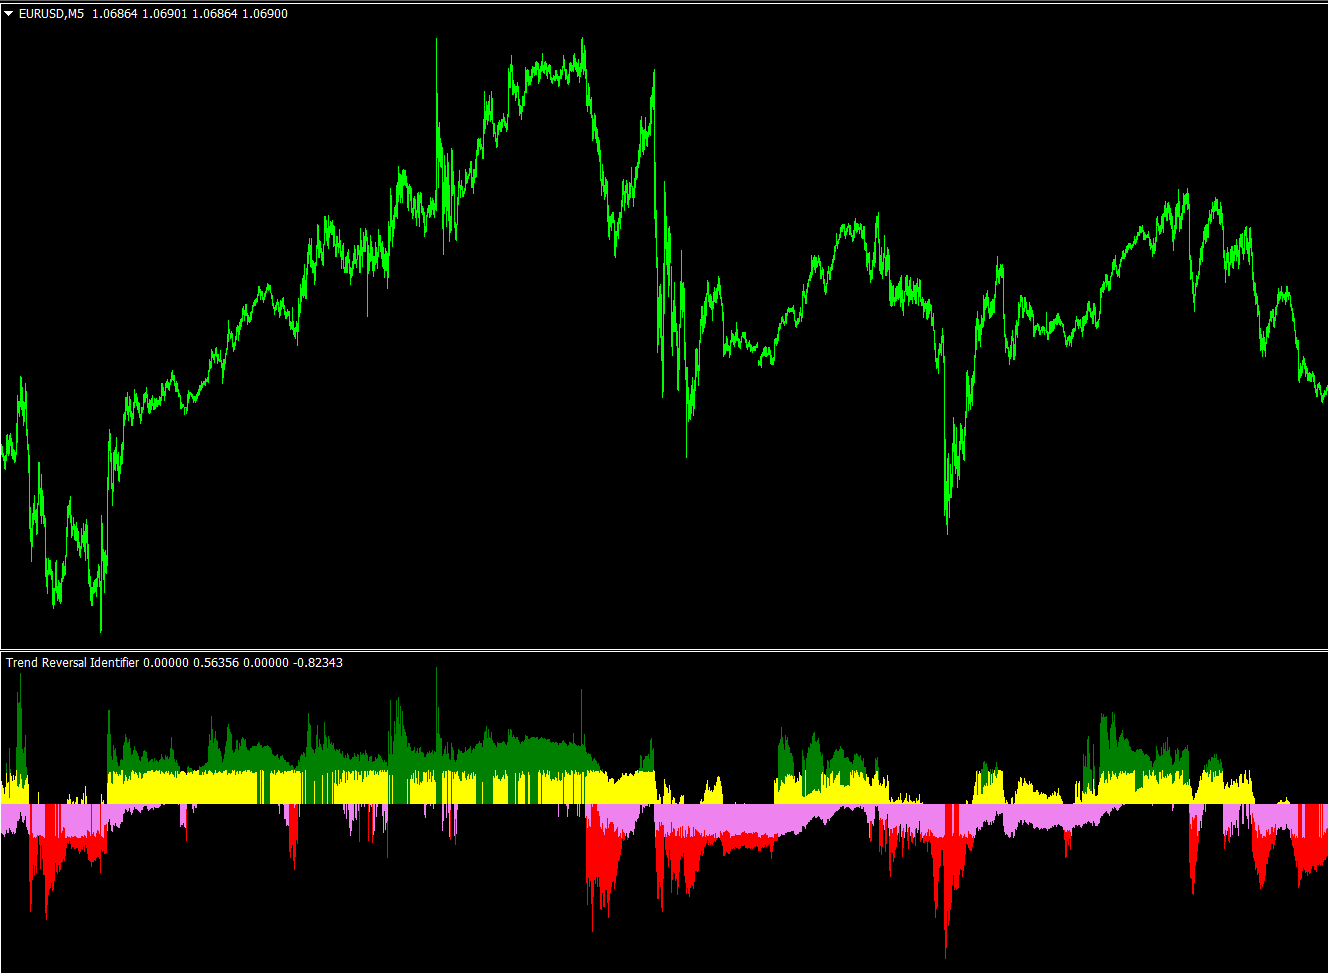
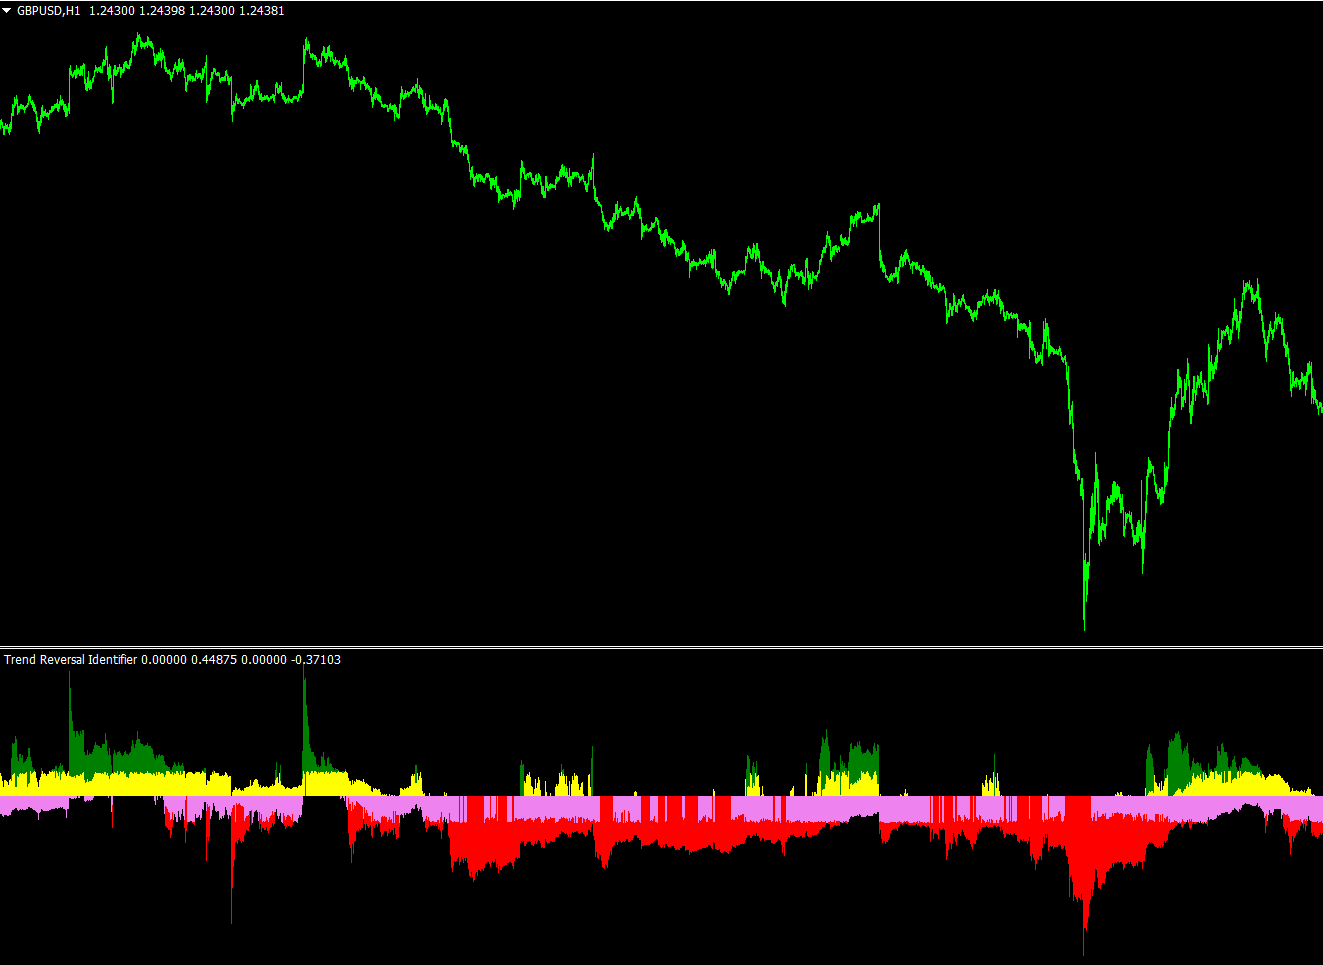
Trend Reversal Identifier es un indicador de análisis profundo que no repinta de alto rendimiento que sirve para detectar y confirmar Pullbacks, Soportes y Resistencias. 

También posee un alto valor para detectar divergencias al tener los movimientos alcista y bajistas dados por separado con mucha claridad. 

Debido a la estructura implícita del algoritmo es plenamente válido para cualquier par/periodo y no necesita configuración.

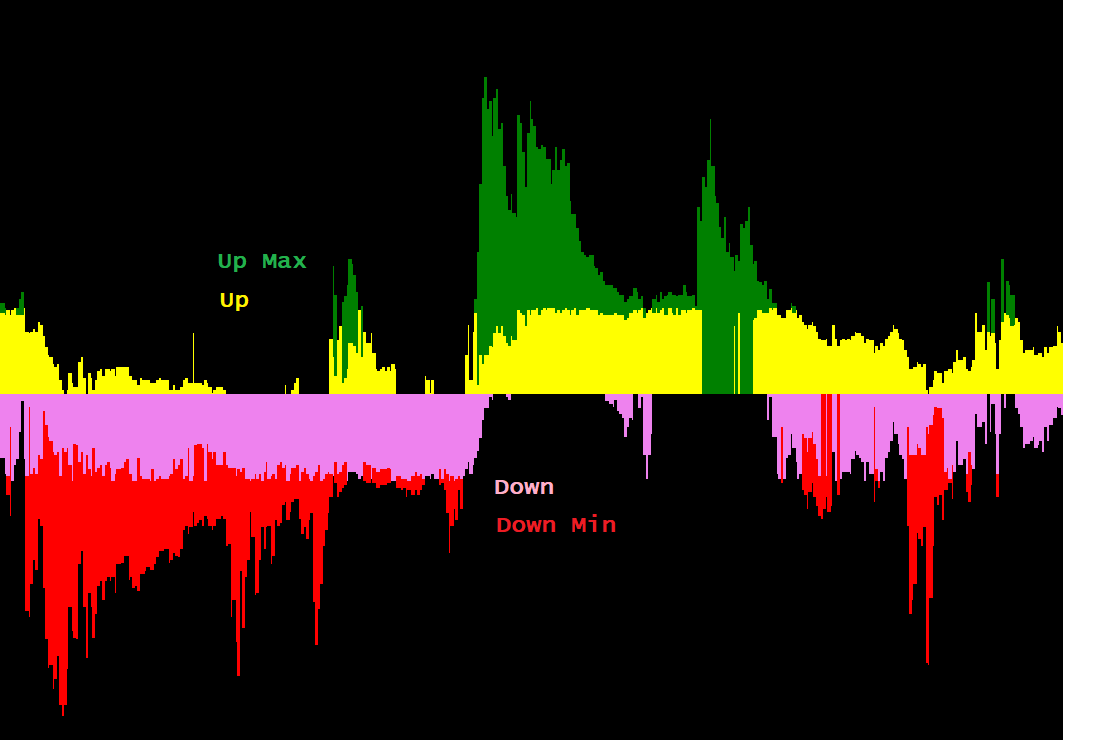
Tenemos dos zonas principales: Zona Up y Zona Down, las cuales a su vez se subdivide en otras dos. Ofrece una visión precisa del movimiento del mercado de una manera clara y precisa. 

Tiene un retorno de 4 buffers con el cual podemos analizar la fuerza y el impulso del mercado.

Los valores entre los que se mueve son los siguientes:

* Up Max Se activa cuando pasa de 1

* Up 0 ->1

* Down 0 ->-1

* Down Se activa cuando pasa de -1

El análisis básico:

* 1 buffer (Up)(Down) movimiento débil en ese sentido, poca tendencia.

* 2 buffers activos (Up y Up Max)(Down y Down Min)  movimiento con fuerza/tendencia. Si están los 4 activos puede ser cambio de tendencia 

* 1 Buffer (Up Max)(Down Min) zona de sobrecompra/sobreventa

おすすめのプロダクト
The presented indicator is the author's implementation of the idea embodied in the Alligator indicator, which has already become a classic. The proposed product allows you to visually demonstrate the direction of price movement, temporary price rollbacks and zones of multidirectional price movement. Namely: The indicator lines go up and diverge from each other - a strong bullish trend; The indicator lines go down and diverge from each other - a strong bearish trend; The indicator lines go up but
FREE
Ichimoku Map (instant look at the markets) - built on the basis of the legendary Ichimoku Kinko Hyo indicator. The task of the Ichimoku Map is to provide information about the market strength on the selected time periods and instruments, from the point of view of the Ichimoku indicator. The indicator displays 7 degrees of buy signal strength and 7 degrees of sell signal strength. The stronger the trend, the brighter the signal rectangle in the table. The table can be dragged with the mouse. T
トレンドキャッチャー: アラートインジケーター付きのトレンドキャッチャーストラテジーは、市場トレンドやポテンシャルなエントリーポイントやエグジットポイントを特定するのに役立つ多目的な技術分析ツールです。動的なトレンドキャッチャーストラテジーを備えており、市場状況に適応してトレンドの方向を明確に視覚化します。トレーダーは、自身の好みやリスク許容度に合わせてパラメーターをカスタマイズできます。このインジケーターはトレンドの識別を支援し、ポテンシャルなリバーサルをシグナルし、トレイリングストップのメカニズムとして機能し、市場への迅速な対応のためのリアルタイムアラートを提供します。 特徴: - トレンドの識別:上昇トレンドと下降トレンドをシグナルします。 - トレンドのリバーサル:ローソク足の色が上昇から下降に変わった場合やその逆の場合に、ポテンシャルなリバーサルを警告します。 - リアルタイムアラート:新しいトレンドの識別に対するアラートを生成します。 推奨事項: - 通貨ペア:EURUSD、AUDUSD、XAUUSDなど... - タイムフレーム:H1。 - アカウン
FREE
Free informative Indicator-helper. It'll be usefull for traders who trade many symbols or using grid systems (Averaging or Martingale). Indicator counts drawdown as percent and currency separate. It has a number of settings: Count deposite drawdown according equity value and send e-mail or notifications to user if DD more than set; Sending e-mail when max open orders reached; Shows price and remaining pips amount before MarginCall on current chart and Account generally; Display summary trade lot
FREE
FTUイディオテック このインジケーターはMT4プラットフォーム用で、単独で使用できますが、他のインジケーターや戦略と組み合わせるのが最適です。 macd、adxなどの様々なインジケーターを組み合わせて矢印を描き、エントリーやトレンド転換を示唆 YouTube で短い紹介ビデオをご覧ください: https://youtu.be/lCRJ3mFNyOQ インジケーターの特徴: 矢印の販売と購入 視覚と音による警告 トレンド継続 / 早期トレンド転換シグナル 新機能: 履歴内のバーの数を制限する バーから矢印までの距離を変更する 使用法: このインジケーターは、ほとんどの資産グループ、外国為替、商品、指数などで使用できます。 すべてのタイムフレーム、再描画なし、高速読み込み 私の FTU Predictor と組み合わせると、確実に優位性が得られます。 いくつかのアドバイス: 資金管理と規律が鍵であり、単一の戦略や指標が成功をもたらすことはありません。損失は発生するものであり、それをどのように回復するかを理解することが重要です。小さな勝ったり負けたりして、市場に恩返しすることがすべての日
FREE
バイナリアナライザは、バイナリコードに基づく既成の計算に基づいて、独自の指標と取引戦略を作成する絶好の機会です。 アナライザーは、小数点以下5桁の「0.00001」のすべての通貨ペアで動作しますEUR / USD、GBP / USD ITD 推奨セッションM1 カタログに含まれています。 インジケーター-「バイナリ参照」 強気と弱気の市場感情を測定する4つの指標 // ------------------------------------------------ ------------------- // インジケータ「バイナリ参照」 アルゴリズムはローソク足で式を計算し、結果を2つの配列にマージします。 式は、1つのセッション内の価格へのリンクの数を計算します。 配列には、バイナリコードが可能な限り参照する価格が含まれています 配列は、インデックス.binで/ Filesフォルダーに保存されます。 // ---配列PIPS_COL_Price [99999,6]には、次のインジケーターが含まれています--- // PIPS_COL_Price [x、0]-バイナリコードによって
FREE
GTAS STrend
Riviera Systems
4 (4)
GTAS S-Trend is a momentum indicator that helps to determine trends using combination of MACD, RSI and moving averages. This indicator was created by Bernard Prats Desclaux, proprietary trader and ex-hedge fund manager, founder of E-Winvest. Description The indicator oscillates between -65 and +65 with a neutral zone between -25 and +25 around a 0 equilibrium line. S-Trend between -25 and +25 indicates congestion zones with a bullish bias between 0 and +25, and a bearish bias between 0 and -25
FREE
Introducing "Forex Mastery Escort EA," a game-changing Expert Advisor (EA) specifically designed for the MQL5 market. This innovative EA combines the power of multiple indicators, including IMA (Intrabar Moving Average), CCI (Commodity Channel Index), and MACD (Moving Average Convergence Divergence), to provide you with unparalleled trading accuracy. Forex Mastery Escort EA leverages a sophisticated algorithm that meticulously analyzes market conditions, taking into account the insights derived
FREE
Free automatic Fibonacci is an indicator that automatically plots a Fibonacci retracement based on the number of bars you select on the BarsToScan setting in the indicator. The Fibonacci is automatically updated in real time as new highest and lowest values appears amongst the selected bars. You can select which level values to be displayed in the indicator settings. You can also select the color of the levels thus enabling the trader to be able to attach the indicator several times with differe
FREE
Asesor Experto "MR BEAST MIN MAX Price Extremes Master": Potencia tu Trading con Precisión en Mínimos y Máximos El asesor experto "Price Extremes Master" redefine la toma de decisiones en el trading al basarse en los precios mínimos y máximos del mercado. Este innovador asesor utiliza algoritmos avanzados para identificar oportunidades estratégicas en los puntos extremos de precios, permitiendo a los traders capitalizar las fluctuaciones del mercado de manera eficaz. Características Destacadas:
The "MA Cross Plus" EA is based on Moving Average crossovers as its name says. But what is special about this Expert Advisor is that it uses not one, but two algorithms to filter bad trades to the maximum. As all traders know, moving averages are a trend follow. And there is a saying "The trend is your friend". So, why go against the trend when you can ride the trend and profit from it, while avoiding the fake trend at the same time. The default settings of the EA are basic, and have been tested
Rainbow MT4 is a technical indicator based on Moving average with period 34 and very easy to use. When price crosses above MA and MA changes color to green, it’s a signal to buy. When price crosses below MA and MA changes color to red, it’s a signal to sell. The Expert advisor ( Rainbow EA MT4) based on Rainbow MT4 indicator, as you can see in the short video below is now available here .
FREE
This indicators automatically draws the Support and resistances levels for you once you've dropped it on a chart.  It reduces the hustle of drawing and redrawing these levels every time you analysis prices on a chart. With it, all you have to do is dropped it on a chart, adjust the settings to your liking and let the indicator do the rest.  But wait, it gets better; the indicator is absolutely free!  Get the new and improved version here:  https://youtu.be/rTxbPOBu3nY Parameters Time-frame  -> T
FREE
The gravity line indicator to which the price always returns. This is a kind of center of attraction and a magnet for price. Allows you to trade on the trend and on pullbacks. It works on all timeframes, on any currency pairs, metals and cryptocurrency Can be used when working with binary options Distinctive features Does not redraw its values; Price always returns to the line of gravity; Based on the laws of balance; It has simple and clear settings; It works on all timeframes and on all symb
FREE
Euro Gift (EURUSD M15) I am celebrating my birthday, so i will publish some EAs for FREE. This EA has been developed for EURUSD M15.  Strategy is based on ICHIMOKU indicator and has very little parameters - so its VERY ROBUST. It uses Stop pending orders with   ATR   Stop Loss . At 9:00 pm we are closing trading every Friday to prevent from weekly gaps. !!!Adjust these times to your broker time. Preset values are for UTC+2 only!!! For every candle the pending orders are modified to adapt the mar
FREE
Stratos Bora
Michela Russo
4.69 (42)
Stratos Bora is a trading robot  for the trading on forex. Designed to harness the power of the Ichimoku Kinko Hyo indicator, it offers 12 strategies to cater to every trader's style. Whether you're a seasoned trader or just starting out, Stratos Bora provides a seamless trading experience, ensuring you're always at the forefront of market opportunities. Important Information Revealed Leave a review and contact me via mql5 message to receive additional set files ! Do you want a powerful EA?
FREE
H I G H - P R O B A B I L I T Y - B R E A K O U T   T R E N D L I N E   I N D I C A T O R  This is no ordinary trendline indicator. It has a highly-probability algorithms incorporated in the script to display only trendlines that may give a very high chance of price breakout. The indicator is not a stand alone indicator. Trader should interpret it together with their very own analysis technique to come up with a more efficient trading strategy. You can use with it other trend indic
FREE
Risk Reward Panel Demo
HESAMEDDIN ABDOLRAHIM RAHI
1.5 (2)
This is a useful tool to plan a trade risk to reward visually. The indicator is very simple to use with minimum settings.  Long or Short You can use the indicator for both long and short positions.  Lot Size Calculator You can also use this indicator as a lot size calculator. If you set the risk amount the indicator will calculate the lot size for you based on the stop loss line. You do not need to calculate the lot size manually.  Free Version Free versions works fully on EURUSD pair. For oth
FREE
コアラフィボベースタイムへようこそ     コアラフィボタイムゾーンへようこそ     コアラフィボ時間延長へようこそ     メタトレードのための逃したツールへようこそ! 簡単な紹介: フィボナッチタイムゾーンは、フィボナッチ数列に基づく垂直線です。これらの線は、経過時間に基づいて逆転を予測するメカニズムとして、X軸(日付軸)に沿って伸びています。 多くの場合、開始点としてメジャーローまたはハイが選択されます。距離は比較的小さく始まり、フィボナッチ数列が伸びるにつれて大きくなります。 チャーティストは、フィボナッチタイムゾーンを将来に拡張して、潜在的な逆転ポイントを予測することができます。 このインジケーターは、グーグル検索「Fibo Base Time、Fibo Time Zone、FiboTimeExtention」を介してこれらの名前で見つけることができます。 詳細情報としての基本的な定義:     フィボナッチタイムゾーンは、高、低、または反転が発生する可能性のある潜在的な領域を表す垂直線です。     フィボナッチのタイムゾ
FREE
Indicator for binary options arrow is easy to use and does not require configuration works on all currency pairs, cryptocurrencies buy signal blue up arrow sell signal red down arrow tips do not trade during news and 15-30 minutes before their release, as the market is too volatile and there is a lot of noise it is worth entering trades one or two candles from the current period (recommended for 1 candle) timeframe up to m 15 recommended money management fixed lot or fixed percentage of the depo
The Arrow Scalper
Fawwaz Abdulmantaser Salim Albaker
1 (2)
Dear Friend..  I share with you this simple Expert Adviser .. it is full automatic  this Expert Adviser following the trend of the pair you install on or any stocks or indices , it is works like that: - when the trend on H4 chart show a start of up trend the expert will wait till the 15M & 1H charts show an up trend the EA will open a buy order directly , and do the same for down trend and open a sell order the buy or sell  order lot size and take profit and stop loss will measured manually  by
FREE
Indicator developed with precision algorithm that seeks moments of strong trend in the markets. Reconciled with an algorithm that seeks high volume moments in the market. I recommend using timeframes M15 to H1. I also recommend an optimization to your liking for your best currency pairs. Any questions, do not hesitate to ask. Buy EA based on this indicator CLICKING HERE This is an excellent trigger indicator for your trading system. If you already operate a trend and want an indicator to show y
Bollinger Bands (BB) are similar to Envelopes. The difference between them is that the boundaries of the Trade Bands (Envelopes) are located above and below the moving average curve at a fixed percentage distance, while the Bollinger Bands are plotted at distances equal to a certain number of standard deviations. Since the magnitude of the standard deviation depends on volatility, the bands themselves adjust their width: it increases when the market is unstable, and decreases in more stable per
この度、「HERO_Time_USDJPY」へ関心を持っていただき ありがとうございます。 「 エントリーするタイミングに特徴 がある」EAです。 ・小資金から運用可能 ・数時間しかポジションをもたない ・完全放置できる ・わかりやすい設定 ポートフォリオに加えたくなるEAですので どうぞゆっくりとお読みください。 「HERO_Time_USDJPY」の概要 ・証拠金 1,000 USD から0.27ロット運用可能。 ・USDJPYの 1時間足 にセットして運用。 ・タイプはアノマリーのデイトレ系EA。 デイトレということで数時間しかポジションをもたない。 ・決まった時間にエントリー、TP/SL または決まった時間に決済をする。 相場の状況を確認し、優位性が高いときのみエントリーする。 ・スプレッド耐性がありスプレッドが広いブローカー、口座でも使用可能。 このような方にお勧め ・バックテスト・分析ツール等を駆使し、信頼性の高いEAを使用したい方 ・安定的な利益を追求し、リスクを抑えたい方 ・ポートフォリオを組みたい方にも最適 ・長期的な投資を考えている
TrendLine PRO MT4
Evgenii Aksenov
4.88 (247)
The Trend Line PRO indicator is an independent trading strategy. It shows the trend change, the entry point to the transaction, as well as automatically calculates three levels of Take Profit and Stop Loss protection Trend Line PRO is perfect for all Meta Trader symbols: currencies, metals, cryptocurrencies, stocks and indices Advantages of Trend Line PRO Never redraws its signals The possibility of using it as an independent strategy It has three automatic levels Take Profit and Stop Loss leve
Icarus Bolli-Band Change Display(TM) Indicator is a simple, but highly effective tool for visually identifying areas where the all-important 'Bollinger Band' values are in a state of expansion, contraction of neither. The traditional Bollinger Bands have been widely applied to trading charts globally since their creation by John Bollinger several decades ago. One of the limitations of the traditional Bollinger Bands is the ability to clearly identify when the bands are in fact expanding or contr
MACD Divergence Finder Indicator will help you to find Divergences between your typical MACD values and the Chart Prices as potential points of actual Trend Reversion or Pull Backs to increase your positions as per the current Trend. Indicator Windows draws MACD value and Divergence arrows but not MACD Signal as it is not considered relevant to detect this kind of Classic Divergences. In some computer/VPS with old microprocessors or low RAM size, when you launch this Indicator (attach it, change
Mars 13  is a Break   indicator is a powerful indicator of Pattern trade for any par and any timeframe. It doesn't requires any additional indicators for the trading setup.The indicator gives clear signals about opening and closing trades.This Indicator is a unique, high quality and affordable trading tool.  Can be used in combination with other indicators Perfect For New Traders And Expert Traders Low risk entries. Never repaints signal. Never backpaints signal. Never recalculates signal. For
インジケーターは、古典的なガンの角度と同様に、(特定のキャンドルをクリックした後)トレンドラインのファンを構築します。インジケーターの特徴は、固定スケールで角度を作成するだけでなく、特定の数のバーの平均価格を使用することです(オプション)。 インジケーターの角度の平均価格を計算する方法は2つあります(オプション)。 1)高値から安値への(特定の数のバーの)平均価格の動きの計算。 2)平均価格の計算はオープンからクローズに移動します。 オプション: 1.Method -コーナーを構築する方法。 2. FixedScale-固定スケール(メソッドでFixed_Scaleが選択されている場合)。 3.SecondaryAngles-二次角度を描画するための許可を制御します。 4.RayRight-トレンドラインの光線を設定します。 5.DrawBackground-背景として線を描画します。 6.AnglesQuantity-角度の数。 7. Bars_To_Process-期間、バーの数、これに基づいて平均価格が決定され
This EA does not use martingale, averaging, grid, or any dangerous strategies. This EA is always using hard stop loss and take profit. Always use the set files I published in the comment section! More sets will come for wheat, gasoline, and other commodities) (All pairs were tested for 10 years with 99.9% every tick data, More come soon for minor and exotic pairs) Package Contains: --Full EA with all adjustable settings and parameters to tweak or optimize. --It uses the NomadTrader Money M
このプロダクトを購入した人は以下も購入しています
現在26%オフ 初心者やエキスパートトレーダーに最適なソリューション! このインジケーターは、独自の機能と新しい計算式を取り入れた、ユニークで高品質、かつ手頃な価格のトレーディングツールです。たった1枚のチャートで28の為替ペアの通貨強度を読み取ることができます。新しいトレンドやスキャルピングチャンスの引き金となるポイントを正確に特定することができるので、あなたのトレードがどのように改善されるか想像してみてください。 ユーザーマニュアルはこちら  https://www.mql5.com/en/blogs/post/697384 これが最初の1本、オリジナルだ! 価値のないクローンを買わないでください。 特別な サブウィンドウの矢印で強い通貨の勢いを表示 GAPがあなたのトレードを導く! 基準通貨や気配値が売られすぎ・買われすぎのゾーン(外相フィボナッチレベル)にあるとき、個別チャートのメインウィンドウに警告表示。 通貨がレンジの外側から反落した場合、プルバック/リバーサルのアラート。 クロスパターンの特別なアラート 複数の時間枠を選択可能で、トレンドを素早く
Reversal First Impulse levels (RFI)    INSTRUCTIONS        RUS       -       ENG              R ecommended to use with an indicator   -   TREND PRO -  Version MT5 A key element in trading is zones or levels from which decisions to buy or sell a trading instrument are made. Despite attempts by major players to conceal their presence in the market, they inevitably leave traces. Our task was to learn how to identify these traces and interpret them correctly. Main functions: Displaying active zones
An exclusive indicator that utilizes an innovative algorithm to swiftly and accurately determine the market trend. The indicator automatically calculates opening, closing, and profit levels, providing detailed trading statistics. With these features, you can choose the most appropriate trading instrument for the current market conditions. Additionally, you can easily integrate your own arrow indicators into Scalper Inside Pro to quickly evaluate their statistics and profitability. Scalper Inside
TPSpro TRENDPRO  - is a trend indicator that automatically analyzes the market and provides information about the trend and each of its changes, as well as giving signals for entering trades without redrawing! The indicator uses each candle, analyzing them separately. referring to different impulses - up or down impulse. Exact entry points into transactions for currencies, crypto, metals, stocks, indices!  -  Version MT5               DETAILED DESCRIPTION                R ecommended to use with
Advanced Supply Demand
Bernhard Schweigert
4.92 (311)
現在33%オフ 初心者にもエキスパートトレーダーにも最適なソリューション このインジケーターは独自の機能と新しい公式を多数内蔵しており、ユニークで高品質かつ手頃な取引ツールです。このアップデートでは、2つの時間枠ゾーンを表示できるようになります。より長いTFだけでなく、チャートTFとより長いTF(ネストゾーンを表示)の両方を表示できます。すべてのSupply Demandトレーダーの皆さんのお気に召すはずです。:) 重要情報の公開 Advanced Supply Demandの可能性を最大化するには、 https://www.mql5.com/ja/blogs/post/720245 にアクセスしてください。   エントリーまたはターゲットの正確なトリガーポイントを正確に特定できれば取引がどのように改善されるか想像してみてください。新しい基盤となるアルゴリズムに基づいて構築されているため、買い手と売り手の間の潜在的な不均衡をさらに簡単に特定できます。これは、最も強い需要と供給のゾーンと、過去のパフォーマンス(古いゾーンを表示)がグラフィカルに表現されるためです。これらの機能は、最適
まず第一に、この取引インジケーターは再描画されず、再描画されず、遅延しないことを強調する価値があります。これにより、手動取引とロボット取引の両方に理想的なものになります。 ユーザーマニュアル:設定、入力、戦略。 アトミックアナリストは、価格の強さとモメンタムを利用して市場でより良いエッジを見つけるためのPA価格アクションインジケーターです。ノイズや誤ったシグナルを除去し、取引ポテンシャルを高めるための高度なフィルターを備えています。複雑なインジケーターの複数のレイヤーを使用して、アトミックアナリストはチャートをスキャンし、複雑な数学的計算をシンプルなシグナルと色に変換します。これにより、どのような初心者トレーダーでも理解して使用し、一貫した取引の決定を行うことができます。 「アトミックアナリスト」は、新規および経験豊富なトレーダー向けにカスタマイズされた包括的な取引ソリューションです。プレミアムインジケーターとトップノッチの機能を1つの取引戦略に組み合わせ、すべてのタイプのトレーダーにとって汎用性のある選択肢にします。 デイリートレーディングとスキャルピング戦略:高
74% discount for the next 10 buyers (original price $605): 1 left Get a 50% bonus by buying (or even renting) any of our products. After buying (or renting), send a message for more information. 3 Indicators in 1 indicator Strategy based on price action Made specifically for the best forex currency pairs Can be used in the best time frame of the market at a very reasonable price This indicator is basically 3 different indicatos . But we have combined these 3 indicators in 1 indicator so th
ご紹介   クォンタム トレンド スナイパー インジケーターは 、トレンド反転を特定して取引する方法を変革する画期的な MQL5 インジケーターです。 13年以上の取引経験を持つ経験豊富なトレーダーのチームによって開発されました。     クォンタムトレンドスナイパーインジケーター   は、非常に高い精度でトレンドの反転を識別する革新的な方法で、あなたのトレーディングの旅を新たな高みに押し上げるように設計されています。 ***Quantum Trend Sniper Indicatorを購入すると、Quantum Breakout Indicatorを無料で入手できます!*** クォンタム ブレイクアウト インジケーターは、トレンドの反転を特定するとアラートを発し、矢印を示し、3 つのテイクプロフィットレベルを提案します。 初心者トレーダーにもプロのトレーダーにも適しています。 量子EAチャネル:       ここをクリック MT5のバージョン:       ここをクリック 推奨事項: 期間: すべての時間枠。最良の結果を得るには、
The indicator of a Professional Trader is an arrow indicator for predicting the direction of price movement. I have been working on this indicator since 2014. You can use this indicator as your main indicator, use its entry signals, and use it as your only indicator to find entry points. About the product: Recommended TF [H4-D1-W1]   . The indicator predicts the direction of the next candle. Fits a variety of tools; Flexibility in settings for different instruments and intervals through the
mql5と Telegramの モーニング・ブリーフィングで、詳細とスクリーンショットを含む毎日のマーケット・アップデートをご覧 ください! FX Power MT4 NGは 、長年の人気を誇る通貨強度計FX Powerの次世代モデルです。 この次世代ストレングスメーターは何を提供するのでしょうか?初代FXパワーの魅力すべて プラス GOLD/XAUの強さ分析 より正確な計算結果 個別に設定可能な分析期間 カスタマイズ可能な計算上限値により、さらに優れたパフォーマンスを実現 もっと見たい人のための特別なマルチインスタンス設定 すべてのチャートでお好みの色を無限に設定可能 数え切れないほどの通知オプションにより、重要なことを見逃すことはありません。 Windows 11とmacOSのスタイルで角を丸くした新しいデザイン 魔法のように動くインジケーターパネル FXパワーの主な機能 すべての主要通貨の強さの完全な履歴 すべての時間枠における通貨の強さの履歴 すべてのブローカーとチャートで同一の計算結果 100%信頼できるリアルタイム計算 -> リペイントなし ドロップダウン・リストから
ご紹介     Quantum Breakout PRO は 、ブレイクアウト ゾーンの取引方法を変革する画期的な MQL5 インジケーターです。 13年以上の取引経験を持つ経験豊富なトレーダーのチームによって開発された Quantum Breakout PROは 、革新的でダイナミックなブレイクアウトゾーン戦略により、あなたの取引の旅を新たな高みに押し上げるように設計されています。 クォンタム ブレイクアウト インジケーターは、5 つの利益ターゲット ゾーンを備えたブレイクアウト ゾーン上のシグナル矢印と、ブレイクアウト ボックスに基づいたストップロスの提案を提供します。 初心者トレーダーにもプロのトレーダーにも適しています。 量子EAチャネル:       ここをクリック MT5バージョン:   ここをクリック 重要!購入後、インストールマニュアルを受け取るためにプライベートメッセージを送ってください。 推奨事項: 時間枠: M15 通貨ペア: GBPJPY、EURJPY、USDJPY、NZDUSD、XAUUSD アカウントの種類: ECN、Raw、また
TrendMaestro
Stefano Frisetti
5 (2)
note: this indicator is for METATRADER4, if you want the version for METATRADER5 this is the link:  https://www.mql5.com/it/market/product/108106 TRENDMAESTRO ver 2.4 TRENDMAESTRO recognizes a new TREND in the bud, he never makes mistakes. The certainty of identifying a new TREND is priceless. DESCRIPTION TRENDMAESTRO identifies a new TREND in the bud, this indicator examines the volatility, volumes and momentum to identify the moment in which there is an explosion of one or more of these data a
このインジケータは、手動および自動的な方法でチャートに描かれたハーモニックパターンを検出します。ユーザーマニュアルは、このリンクから参照できます: あなたのレビューを追加し、入手するために私たちに連絡してください。 この製品をmt4で試すための無料版があります。 GartleyおよびNenstarパターンを検出するために使用できます。 https://www.mql5.com/en/market/product/30181 完全なMT4バージョンを購入するには、次の場所から購入できます。 https://www.mql5.com/en/market/product/15212 注 インジケータにはコントロールパネルがあり、すべての(チャート&時間枠)設定が保存されます。チャート上でスペースをより多く確保するために、最小化することができ、他の分析ツールで作業する場合は、すべてのインジケータデータを非表示にするために閉じるボタンを押すことができます。 このインジケータを使用して設定を変更し、移動平均やボリンジャーバンドなどのインジケータを追加すると、編集のテンプレートが自動的に保存され、必
Wolfe Waves scanner - It scans all the Symbols and identify the movement of price and it gives confidence in trade. It automatically plots  fifth wave breaks out of the channel. According to the theory behind the pattern, a line drawn from the point at the beginning of the first wave and passing through the beginning of the fourth wave predicts a target price for the end of the fifth wave. If a trader properly identifies a Wolfe Wave as it forms, the beginning of the fifth wave represents an op
TakePropips Donchian Trend Pro
Eric John Pajarillaga Aldana
4.82 (17)
TakePropips Donchian Trend Pro   (MT4) は、ドンチャン チャネルを使用してトレンドの方向を自動的に検出し、エントリーとエグジットの取引シグナルを提供する強力で効果的なツールです! この多機能インジケーターには、トレンド スキャナー、取引シグナル、統計パネル、スクリーナー、取引セッション、およびアラート履歴ダッシュボードが含まれます。取引シグナルを提供し、チャートを分析する時間を節約するように設計されています! ユーザー マニュアルとインストール ガイドは、ブログ投稿 (   https://www.mql5.com/en/blogs/post/751368   ) からダウンロードできます。 今日は 50% オフ! 98ドルから49ドルに値下げ! このインジケーターは、ストラテジー テスターでテストできます (ビジュアル モードを有効にします)。 詳細については、説明の下にあるビデオ チュートリアルも利用できます。 ご不明な点やサポートが必要な場合は、私に連絡してください。 TakePropips Donchian Trend Pro イン
現在20%OFF! 初心者やエキスパートトレーダーのためのベストソリューション! このダッシュボードソフトウェアは、28の通貨ペアで動作しています。それは私達の主要な指標(高度な通貨の強さ28と高度な通貨インパルス)の2に基づいています。それは全体の外国為替市場の大きい概観を与えます。それは、すべての(9)時間枠で28の外国為替ペアのための高度な通貨の強さの値、通貨の動きの速度と信号を示しています。チャート上で1つのインディケータを使用して市場全体を観察し、トレンドやスキャルピングの機会をピンポイントで見つけることができたら、あなたのトレードがどのように改善されるか想像してみてください。 このインディケータには、強い通貨と弱い通貨の識別、潜在的な取引の識別と確認がより簡単になるような機能が搭載されています。このインディケータは、通貨の強さや弱さが増加しているか減少しているか、また、すべての時間枠でどのように機能しているかをグラフィカルに表示します。 新機能として、現在の市場環境の変化に適応するダイナミックなマーケットフィボナッチレベルが追加され、すでに当社のAdvan
An extremely convenient indicator that truly makes the process of making money on the exchange easy. It is based on the scientifically rigorous theory of the market developed by the author, the beginning of which is presented here .                The full algorithm of this indicator operation is presented in the article .               The indicator calculates the most probable price movement trajectory and displays it on the chart. Based on the predicted price movement trajectory
もちろんです。以下は、提供いただいたテキストの日本語への翻訳です: MT4用の天文学指標をご紹介します:究極の天体トレーディングコンパニオン トレーディング体験を天空の高みに高める準備はできていますか?私たちの革命的なMT4用の天文学指標をご紹介します。この革新的なツールは、複雑なアルゴリズムの力を借りて、類まれなる天文学的洞察と精密な計算を提供します。 あなたの指先で宇宙の情報を: 宝のような天文学的データが明らかになる包括的なパネルをご覧ください。惑星の地理的/太陽中心座標、太陽と地球の距離、星の大きさ、伸び、星座、黄道座標および赤道座標、さらには水平座標まで、それぞれが綿密に計算され美しく表示されています。指標によって生成される垂直線は時間値に対応し、トレーディングの旅に宇宙の視点を提供します。 惑星のラインと関係: グラフを飾る惑星のラインの魔法を体験し、スケールと角度をカスタマイズできます。直感的なコントロールパネルを介して各惑星のラインの表示を簡単に切り替えることができます。指定された時刻範囲内での合会、六分会、四分会、三分会、対会、逆行の指標で天体の関係の芸術を発見してく
Introduction to Fractal Pattern Scanner Fractal Indicator refers to the technical indicator that makes use of the fractal geometry found in the financial market. Fractal Pattern Scanner is the advanced Fractal Indicator that brings the latest trading technology after the extensive research and development work in the fractal geometry in the financial market. The most important feature in Fractal Pattern Scanner is the ability to measure the turning point probability as well as the trend probabi
FX Volume
Daniel Stein
4.6 (35)
mql5と Telegramの モーニング・ブリーフィングで、詳細とスクリーンショットを含む毎日のマーケット・アップデートをご覧 ください! FX Volumeは、ブローカーの視点から市場のセンチメントをリアルに洞察する、最初で唯一の出来高インジケーターです。 ブローカーのような機関投資家が外国為替市場でどのようなポジションをとっているか、COTレポートよりもはるかに速く、素晴らしい洞察を提供します。 この情報をチャート上で直接見ることは、あなたの取引にとって真のゲームチェンジャーであり、画期的なソリューションです。 以下のようなユニークなマーケットデータ洞察から利益を得てください。 比率は 、通貨のロングポジションとショートポジションの比率をパーセントで表示します。 比率の変化は 、選択した期間内のロング比率とその変化率を表示します。 Volumes Totalは 、通貨の取引量(ロングとショート)の合計をロット単位で表示します。 Volumes Long :全通貨のロングポジションの取引量を表示します。 Volumes(ショート )は、全通貨のショートポジションの取引量を表示
このインディケータは、当社の2つの製品 Advanced Currency IMPULSE with ALERT  +   Currency Strength Exotics . のスーパーコンビネーションです。 このインジケーターは全ての時間枠で作動し、8つの主要通貨と1つのシンボルの強弱のインパルスをグラフで表示します。 このインジケータは、金、エキゾチックペア、商品、インデックス、先物など、あらゆるシンボルの通貨強度の加速度を表示することに特化されています。金、銀、原油、DAX、US30、MXN、TRY、CNHなどの通貨強度の加速度(インパルスまたは速度)を表示するために、任意のシンボルを9行目に追加できる、この種の最初のものです。 新しいアルゴリズムに基づいて構築され、潜在的な取引の特定と確認がさらに容易になりました。これは、通貨の強さや弱さが加速しているかどうかをグラフィカルに表示し、その加速の速度を測定するためです。加速すると物事は明らかに速く進みますが、これはFX市場でも同じです。つまり、反対方向に加速している通貨をペアリングすれば、潜在的に利益を生む取
Indicator captures the trend reversals with no-repaint Buy and Sell Arrow signals. CyberZingFx Trend Reversal Indicator - your go-to solution for accurate and reliable trend reversal signals. With its  advanced trading strategy , the indicator offers you Buy and Sell Arrow signals that do not repaint, making it a reliable tool for catching Swing Highs and Swing Lows in any market and any time frame. Indicator works on  any market  and  any time frames . __________________________________________
ON Trade Waves Patterns Harmonic Elliot Wolfeをご紹介します。これは手動および自動の方法を使用して市場のさまざまなパターンを検出するために設計された高度なインジケーターです。以下はその動作方法です: ハーモニックパターン: このインジケーターは、チャートに表示されるハーモニックパターンを識別できます。これらのパターンは、Scott Carneyの「Harmonic Trading vol 1および2」で説明されているように、ハーモニックトレーディング理論を実践するトレーダーにとって重要です。手動で描画するか、自動検出に頼るかにかかわらず、ON Trade Waves Patternsがお手伝いします。 コントロールパネル: このインジケーターはユーザーフレンドリーなコントロールパネルを備えています。チャートと時間枠の設定を保存し、異なる構成間をスムーズに切り替えることができます。チャートスペースを最大限に活用するために最小化することもできます。他の分析ツールで作業することを好む場合、閉じるボタンをクリックするだけで、すべてのインジケーターデ
The  RSI Basket Currency Strenght  brings the RSI indicator to a new level.  Expanding the boundaries of TimeFrames and mono-currency analysis, the RSI Multi Time Frame Currency Strenght take the movements of each currency that composes the cross and confront them in the whole basket of 7 crosses.  The indicator works with any combination of  AUD, CAD, CHF, EUR, GBP, JPY, NZD, USD  pairs and with full automation takes in account every RSI value for the selected Time Frame.  After that, the ind
Thise indicator is up down v6  comes with tradingwiev pinescript. purchased people, after installed on terminal ,contact me on mql5  to get BONUS  TradingView pinescript. up-down indicator is no repaint and works all pairs and lower than weekly time frames charts. it is suitable also 1 m charts for all pairs. and hold long way to signal. dont gives too many signals. when red histogram cross trigger line that is up signal.and price probably will down when blue histogram cross trigger line that
今、147ドル(いくつかの更新後に499ドルに増加します) - 無制限のアカウント(PCSまたはMac) RelicusRoad ユーザー マニュアル + トレーニング ビデオ + プライベート Discord グループへのアクセス + VIP ステータス 市場の新しい見方 RelicusRoad は、外国為替、先物、暗号通貨、株式、および指数の世界で最も強力な取引インジケーターであり、トレーダーに収益を維持するために必要なすべての情報とツールを提供します。初心者から上級者まで、すべてのトレーダーが成功するためのテクニカル分析と取引計画を提供します。これは、将来の市場を予測するのに十分な情報を提供する重要な取引指標です。意味をなさないチャート上のいくつかの異なる指標ではなく、完全な解決策を信じています.これは、信号、矢印 + 価格アクション情報を表示するオールインワンのインジケーターで、他に類を見ない非常に正確です。 強力な AI に基づいて、RelicusRoad は不足している情報とツールを提供して、あなたを教育し、トレーディングのプロ、成功したトレーダーにします。
How to use Pair Trading Station Pair Trading Station is recommended for H1 time frame and you can use it for any currency pairs. To generate buy and sell signal, follow few steps below to apply Pair Trading Station to your MetaTrader terminal. When you load Pair Trading Station on your chart, Pair Trading station will assess available historical data in your MetaTrader platforms for each currency pair. On your chart, the amount of historical data available will be displayed for each currency pai
Range Breakout with Multi Symbol Lookup Options Enhance your trading strategy with our cutting-edge Forex Range Breakout Indicator! This versatile tool is designed to provide precise breakout signals and comprehensive analysis to help you make informed trading decisions. Discover the features that make our indicator a must-have for any forex trader: Key Features: Range Breakout Time-Based Analysis: Accurately identifies breakout levels based on specific time ranges, allowing for timely and str
これはほぼ間違いなく、MetaTraderプラットフォームで見つけることができる最も完全な調和価格形成自動認識インジケーターです。 19種類のパターンを検出し、フィボナッチプロジェクションをあなたと同じように真剣に受け止め、潜在的逆転ゾーン(PRZ)を表示し、適切なストップロスとテイクプロフィットレベルを見つけます。 [ インストールガイド | 更新ガイド | トラブルシューティング | よくある質問 | すべての製品 ] 19の異なる調和価格形成を検出します プライマリ、派生および補完フィボナッチ投影(PRZ)をプロットします 過去の価格行動を評価し、過去のすべてのパターンを表示します この指標は、独自の品質とパフォーマンスを分析します 適切なストップロスとテイクプロフィットのレベルを表示します ブレイクアウトを使用して適切な取引を通知します すべてのパターン比をグラフにプロットします 電子メール/音声/視覚アラートを実装します スコット・M・カーニーの本に着想を得て、この指標は最も純粋で急を要するトレーダーのニーズを満たすように設計されています。ただし、トレードを
Price Action Entry Alerts
Stephen Sanjeeve Sahayam
5 (3)
このインジケーターは、売買圧力についてすべてのバーをスクリーニングし、最大量の 4 種類のローソク足パターンを特定します。次に、これらのローソク足はいくつかの線形フィルターを使用してフィルター処理され、買いまたは売りのシグナルが表示されます。シグナルは、より高い時間枠の方向と組み合わせて、取引量が多い時間帯に取引される場合に最も効果的に機能します。すべてのフィルターはカスタマイズ可能で、独立して動作します。ボタンをクリックするだけで単一方向の信号を表示できます。 このインジケーターには、意思決定プロセスに役立つ最も重要な価格アクションとスマート マネーの概念も組み込まれています。 シグナルとトレードに関する教育をすべて 1 つのツールにまとめました。 特徴: 信号は再描画されません。 飲み込むキャンドル、拒否キャンドル、拡張範囲キャンドル、ピンバーを識別します。 有効なシグナルごとに複数のエントリー、ストップロス、複数のテイクプロフィットレベルを表示します。 大容量セッションでフィルタリングします。 サポート/レジスタンスレベルとローソク足の構造でフィルターします。 MACD ヒ
作者のその他のプロダクト
Power Real Trend es un indicador que no repinta y que muestra la dirección real que tiene el mercado, ofreciendo una clara manera de confirmar entradas.  Es un indicador que para su constitución se realizan múltiples operaciones para formar los distintos rangos que se utilizan para su creación. Tiene un manejo muy sencillo dando sólo tres posibles valores (1,0,-1) altamente visual y de muy sencilla comprensión. La parte superior del mismo es la zona más sensible y la inferior corresponde a la te
フィルタ:
レビューなし
レビューに返信
バージョン 1.1 2023.06.23
En la nueva versión se ha añadido la opción Smoothed para poder tener una visualización más sencilla del indicador