Advanced Trend Regime
- インディケータ
- Shellard Securities (Pty) Ltd
- バージョン: 1.0
- アクティベーション: 5
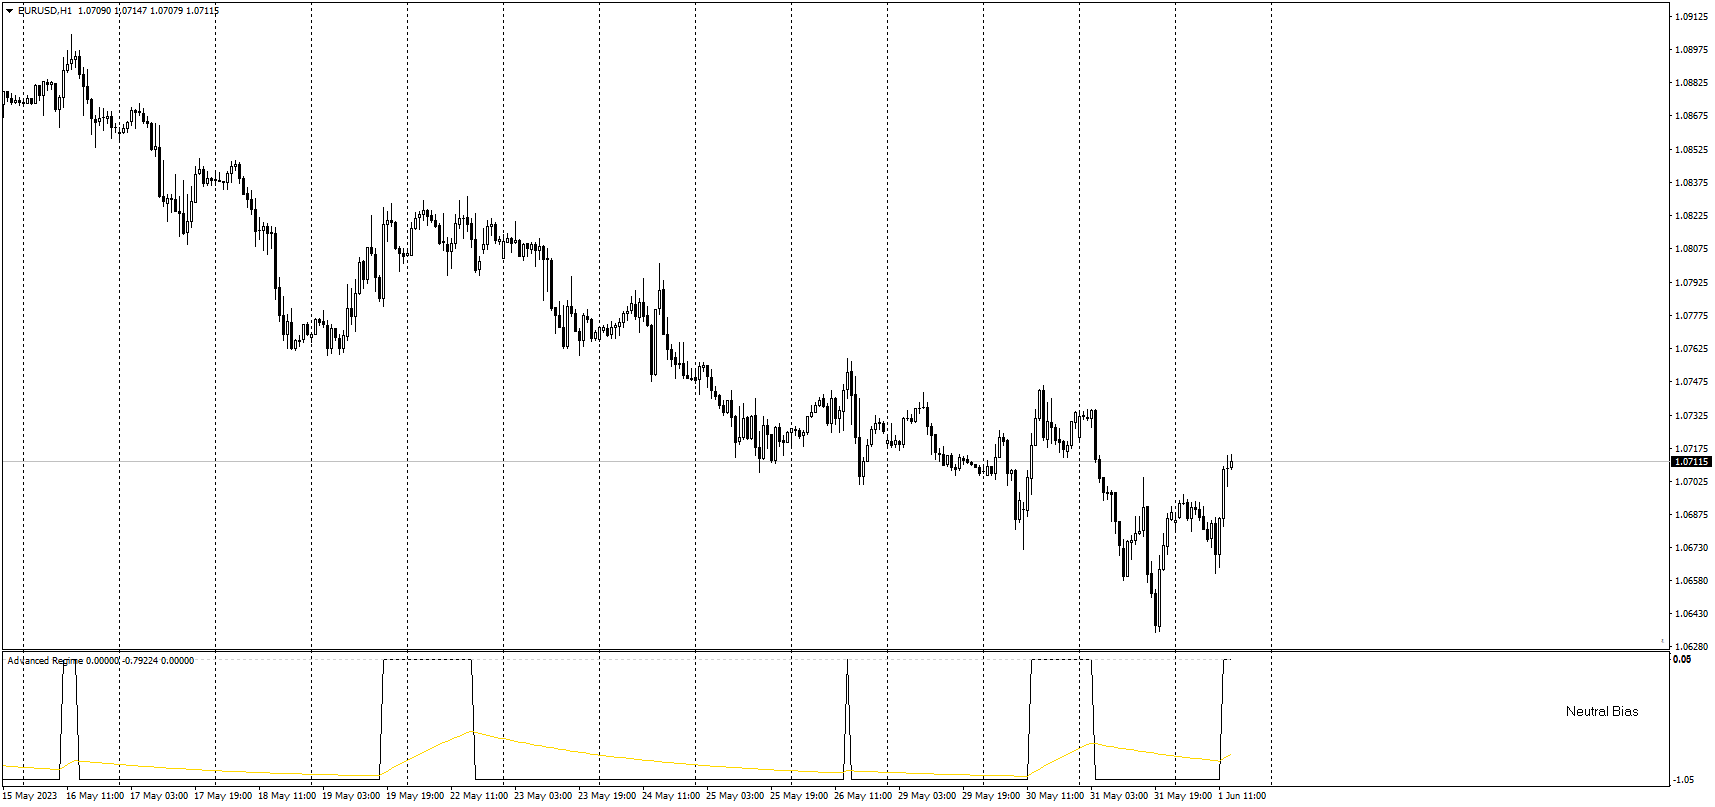
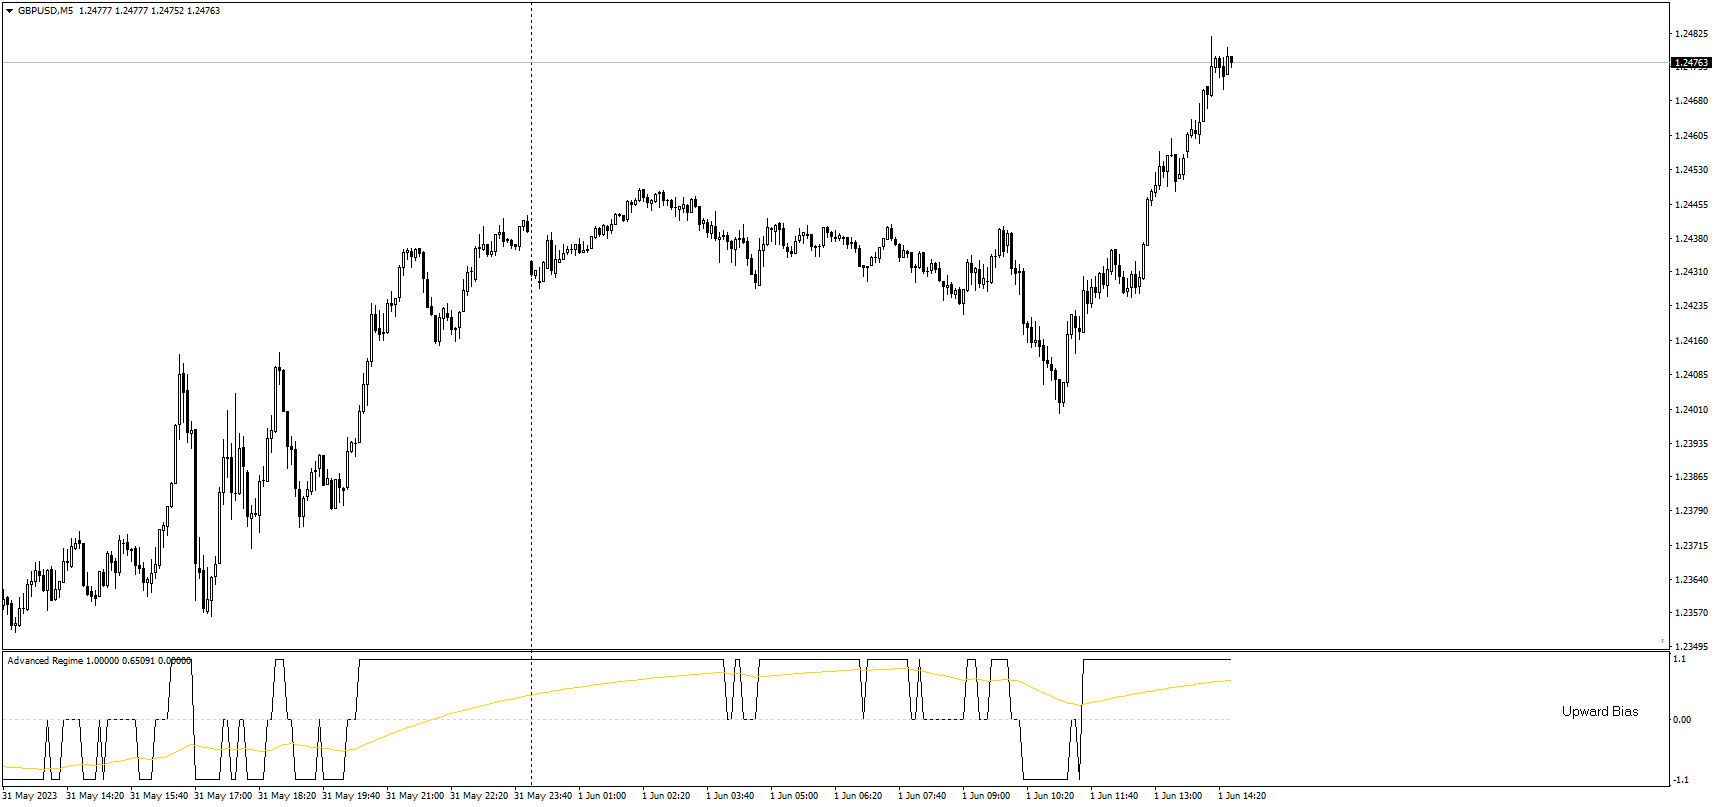
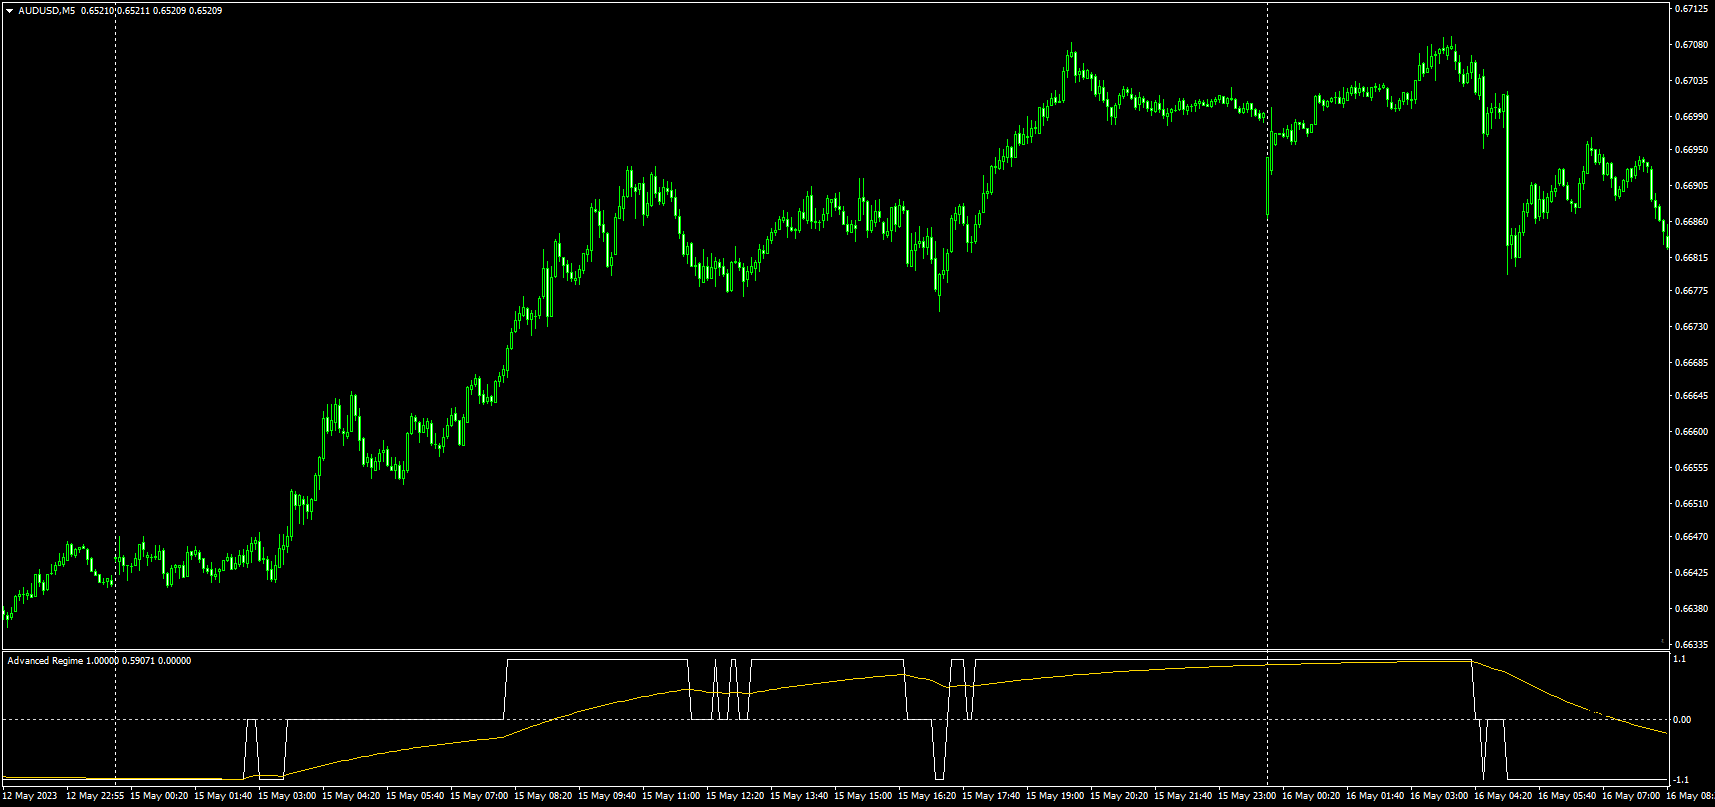
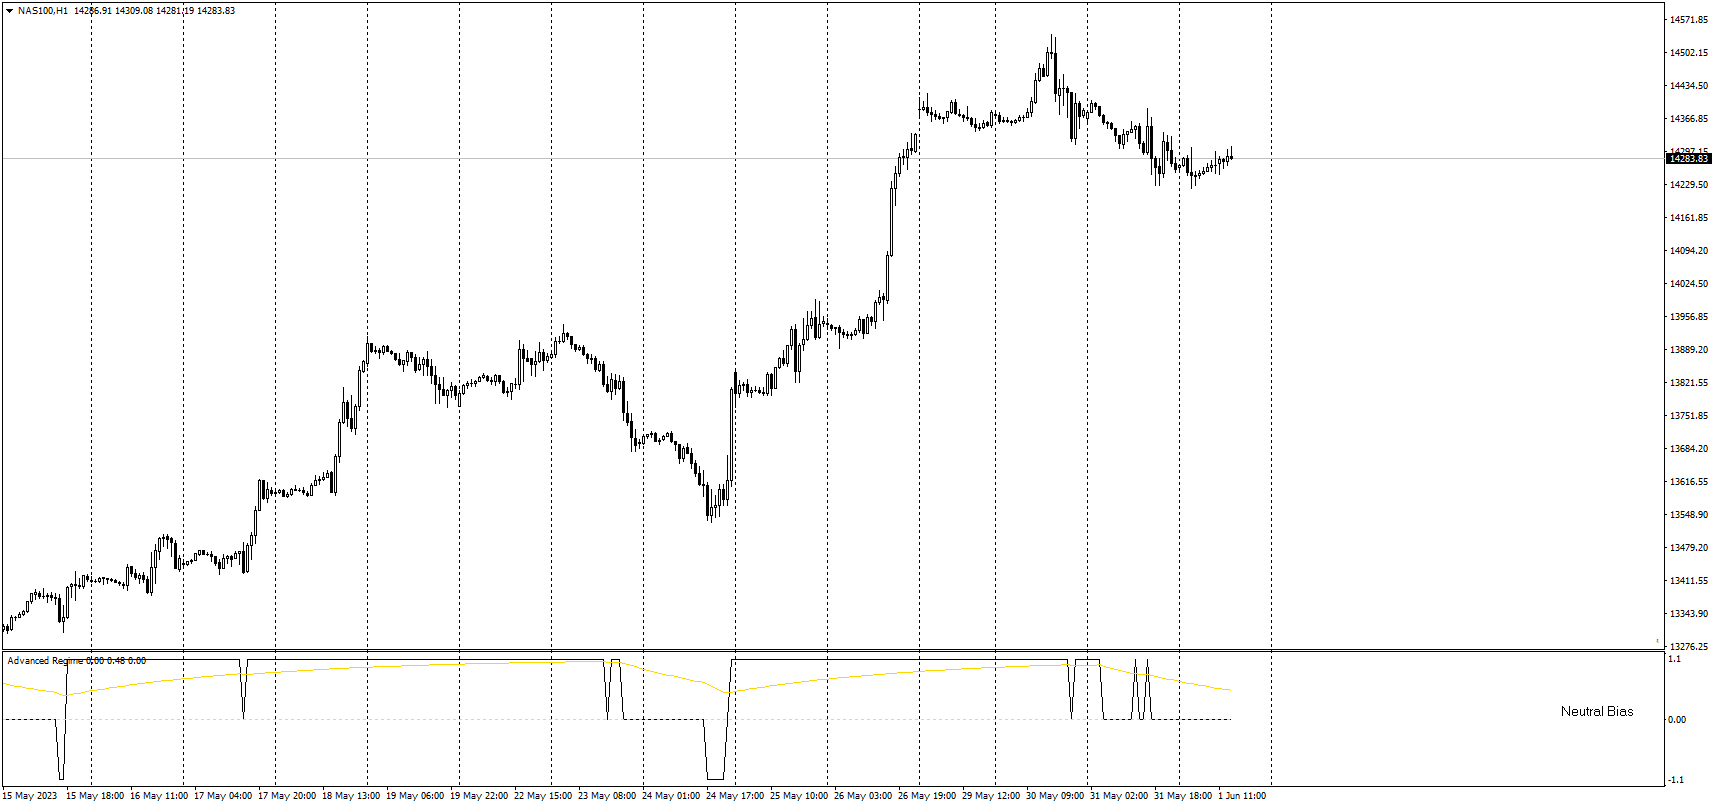
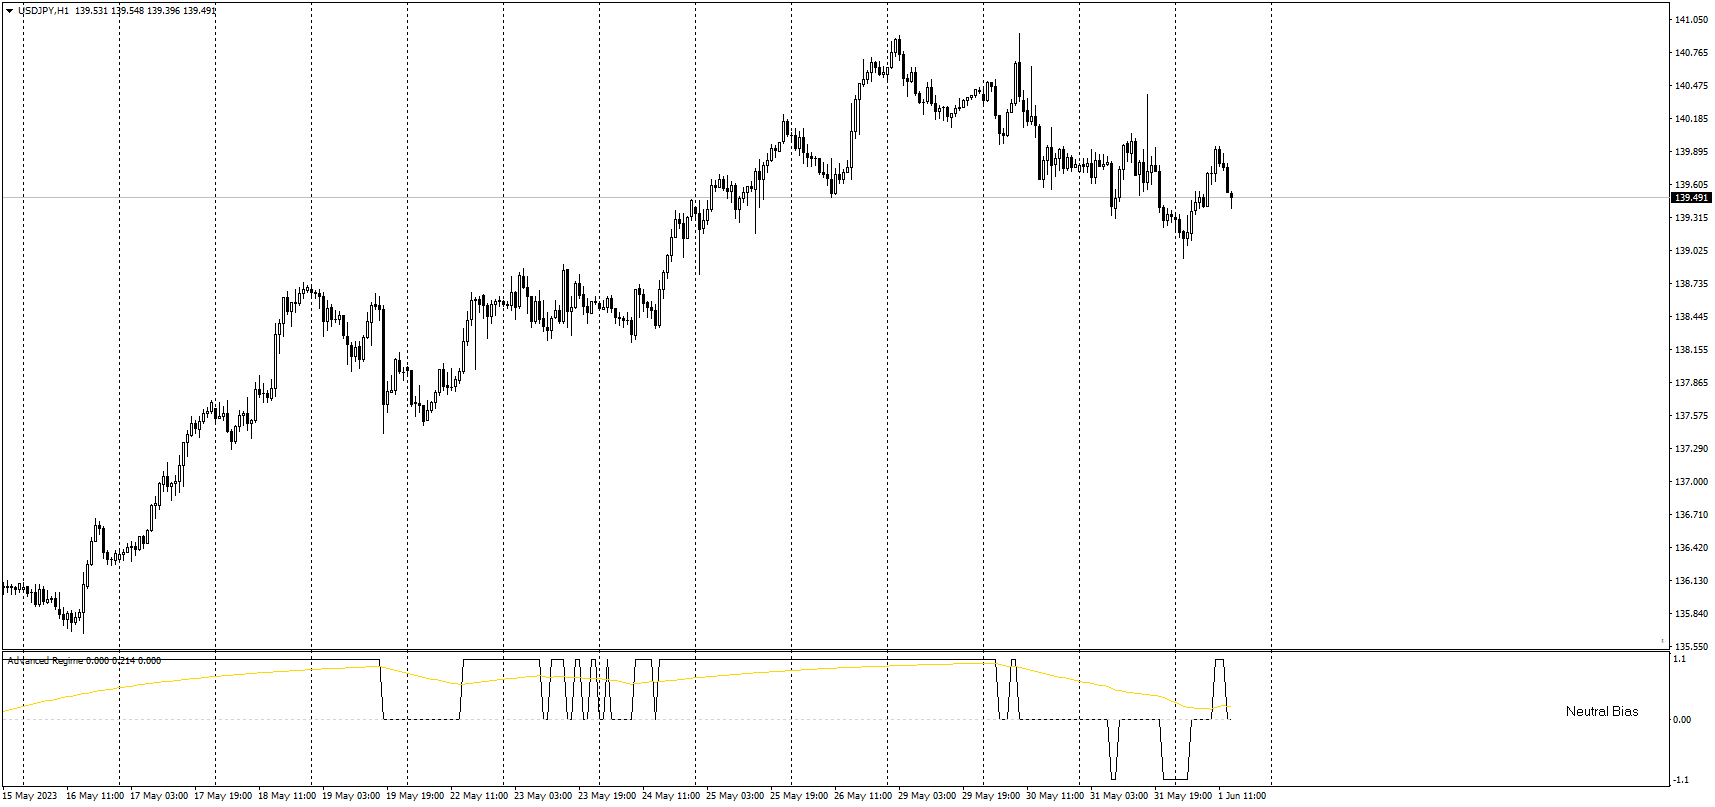
The indicator has been designed to function on any time-frame and any pair.
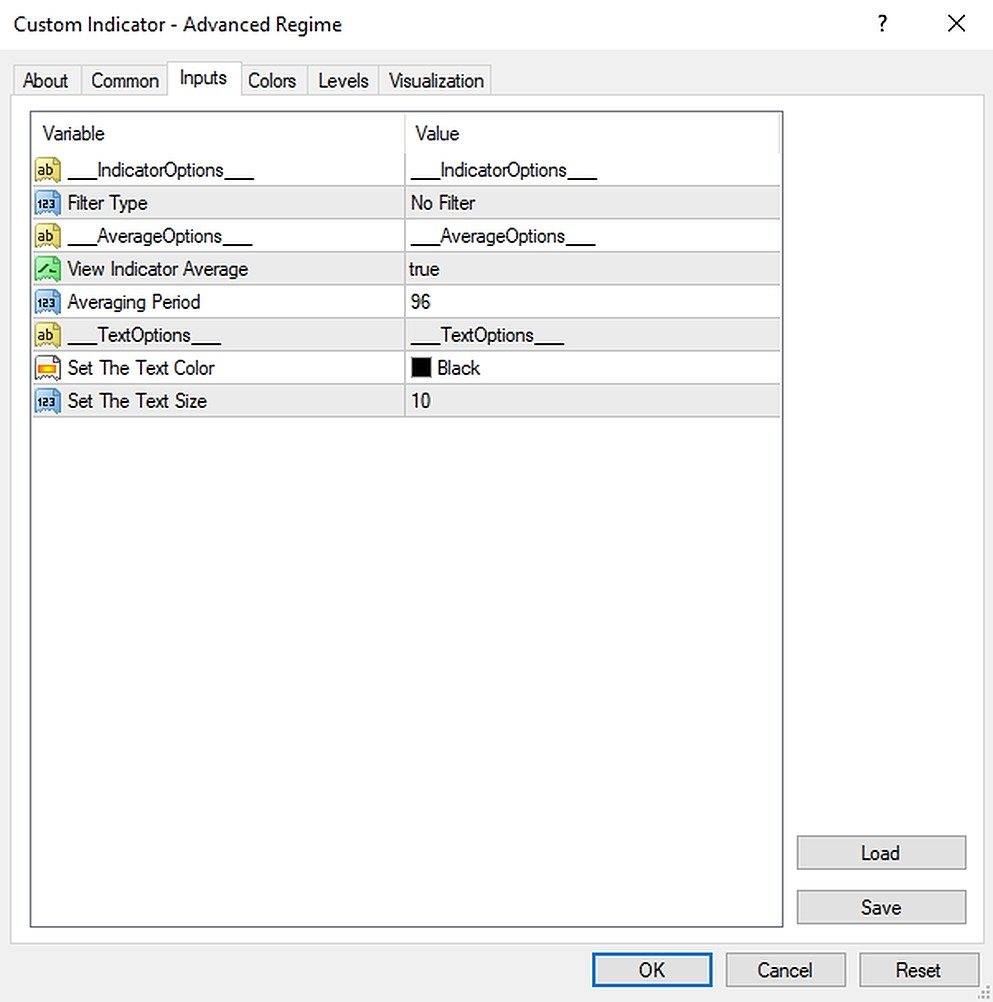
This regime filter will help the trader better evaluate whether the current market is trending, and in which direction. It quickly reacts to changes in market dynamics using a series of advanced calculations. The user is able to select whether the calculation remains standard, or if a further filter constraint is added to the calculation.
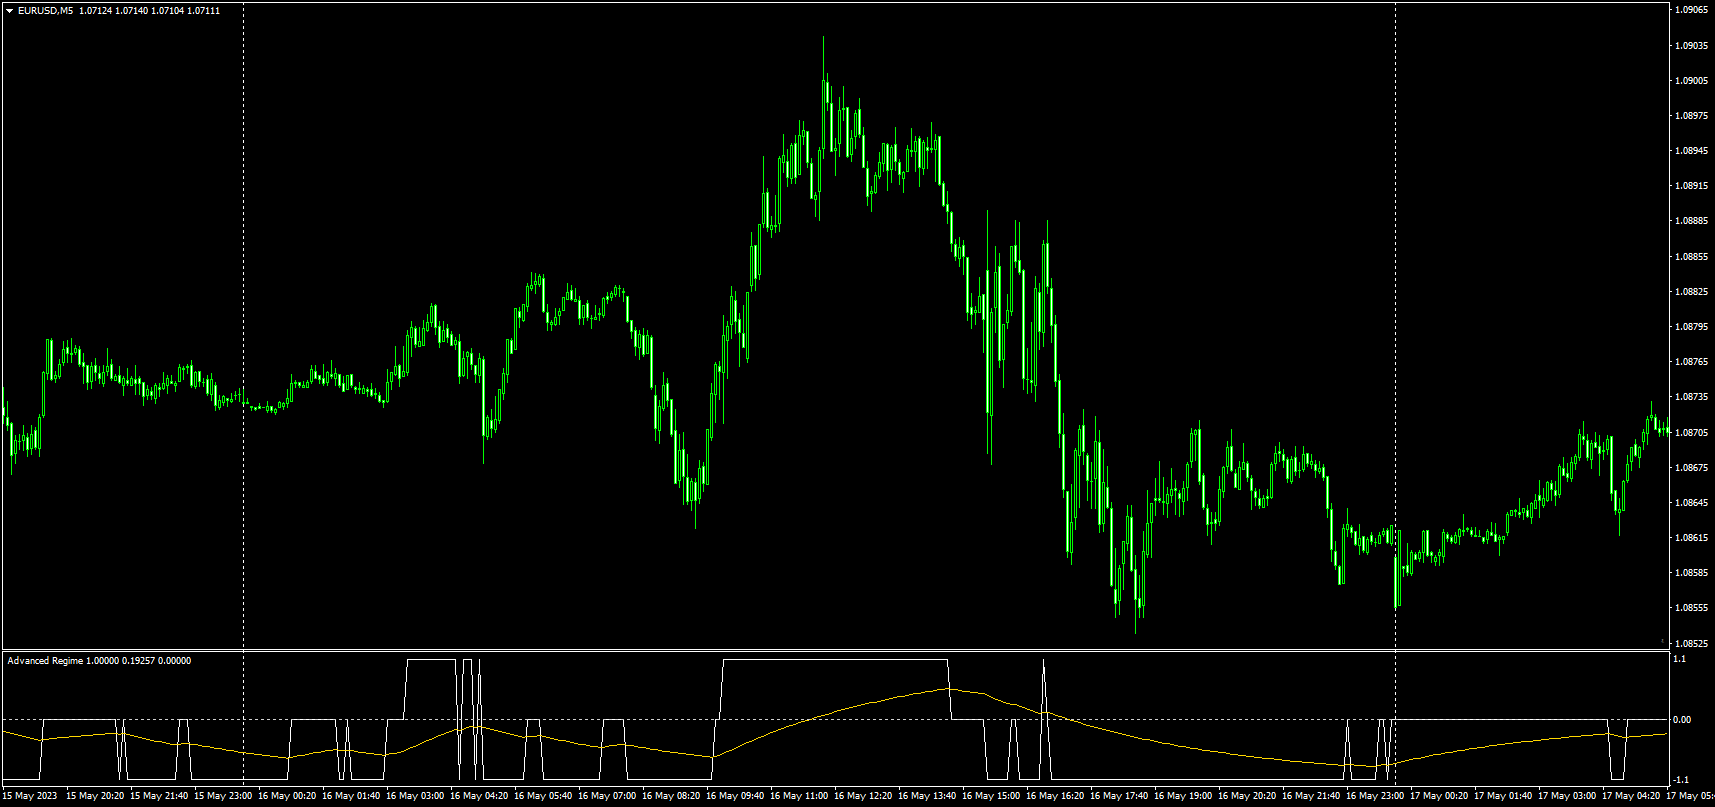
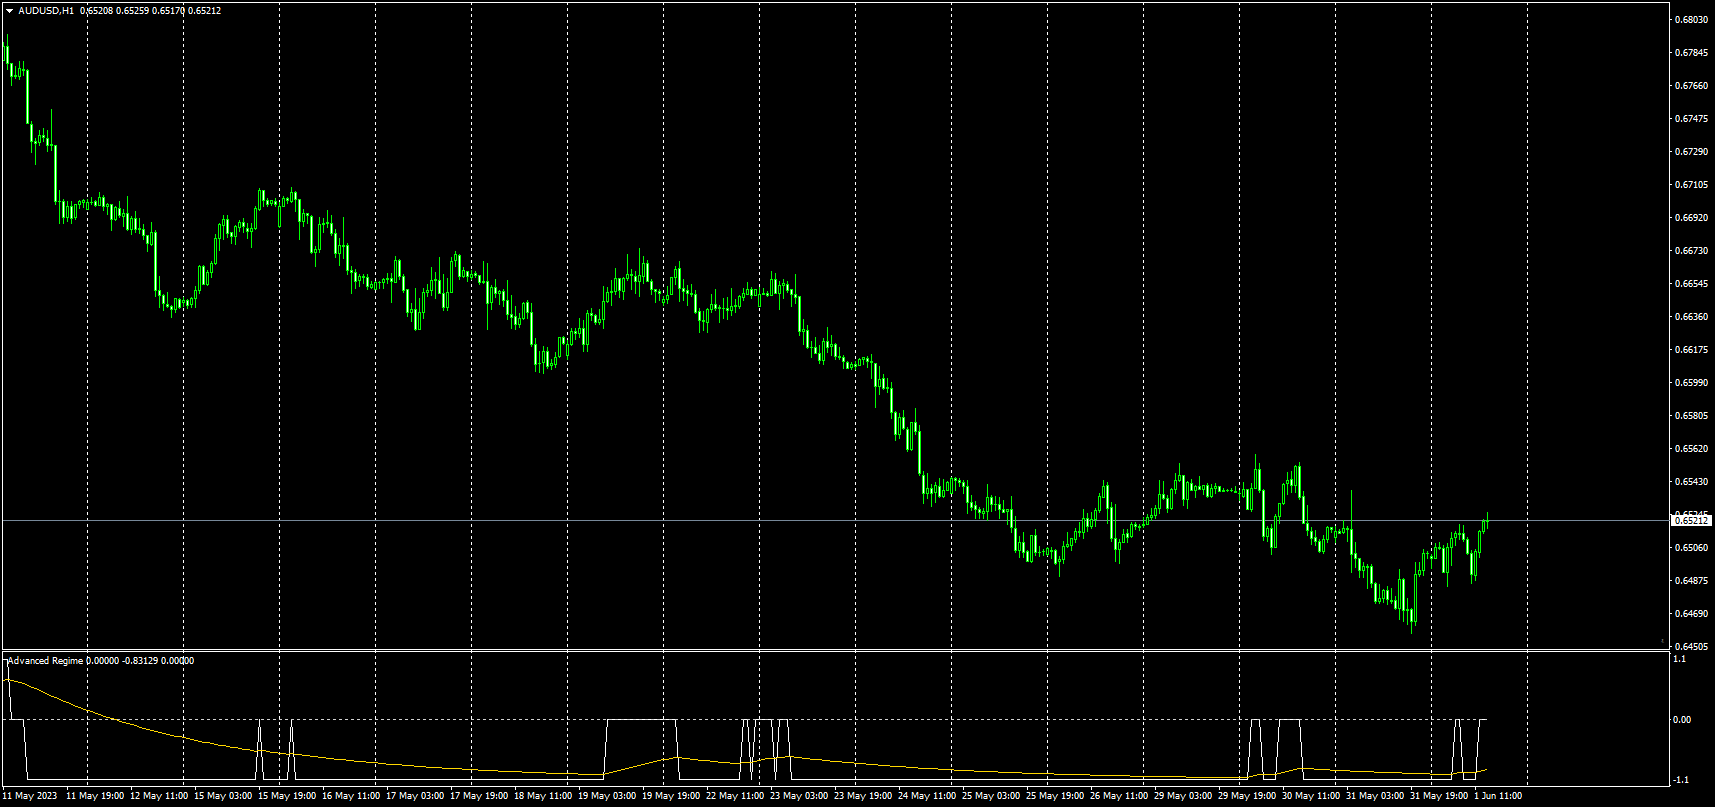
A Yellow moving average of the signal has been included for the trader to smooth signal frequency.
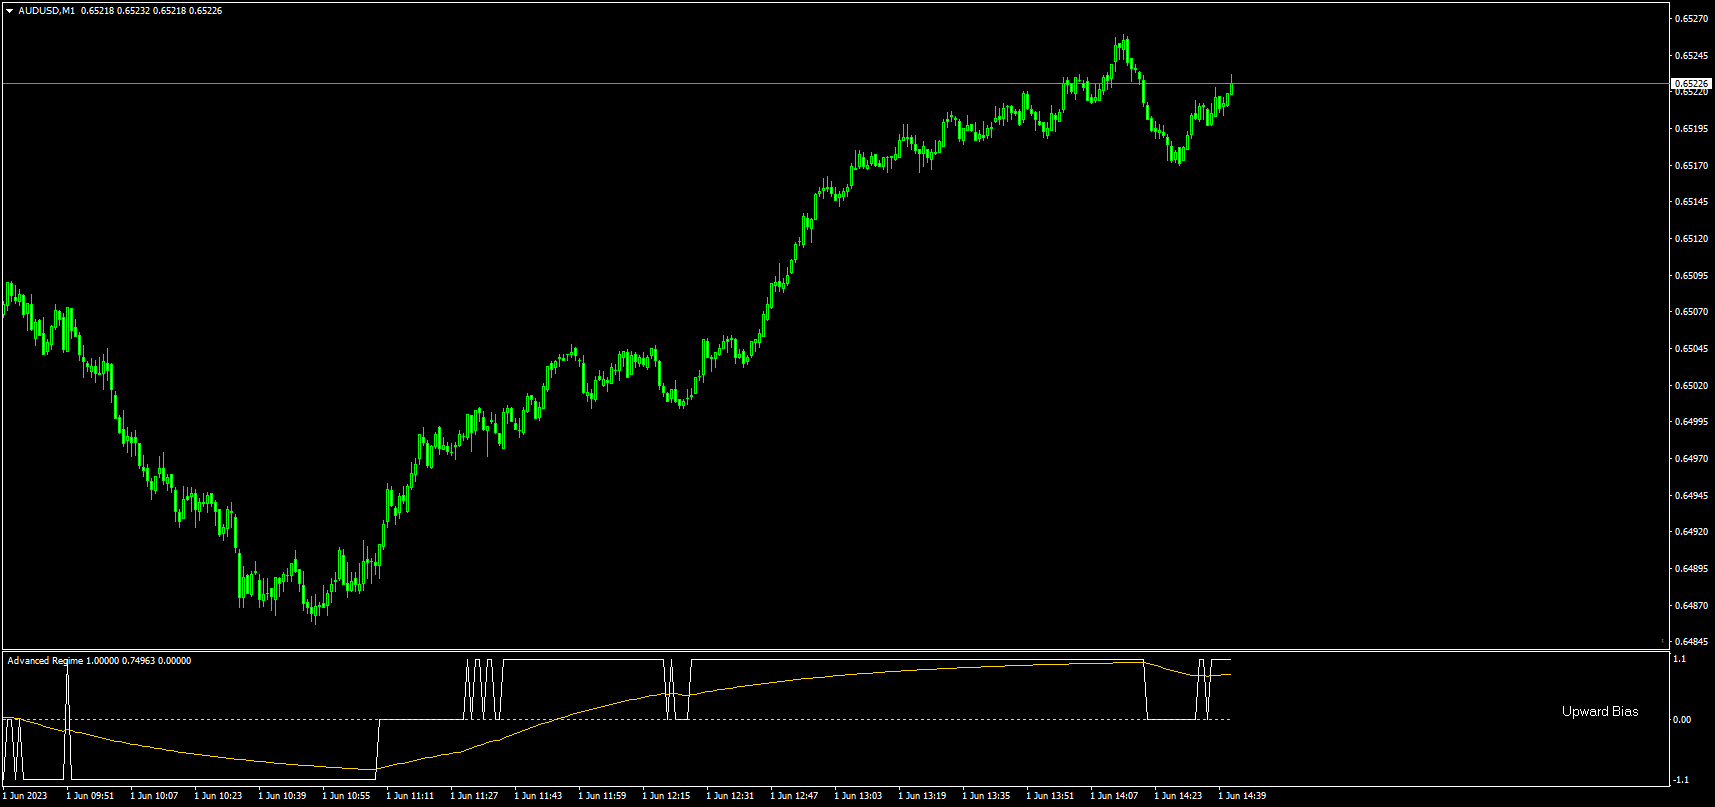
The Black indicator line is the market direction. When indicator line is above zero, the market has an upward trending bias, and long entries should be favoured. When the indicator line is below zero, the market has a downward trending bias, and short entries should be favoured. When the indicator line is zero, the market is in a neutral state, and entries should be avoided.
This indicator can be used on its own, although it is best used to confirm whether the market is trending upwards or downwards.