DeM Signal 2 AM
- インディケータ
- Andriy Matviyevs'kyy
- バージョン: 27.0
- アップデート済み: 15 9月 2024
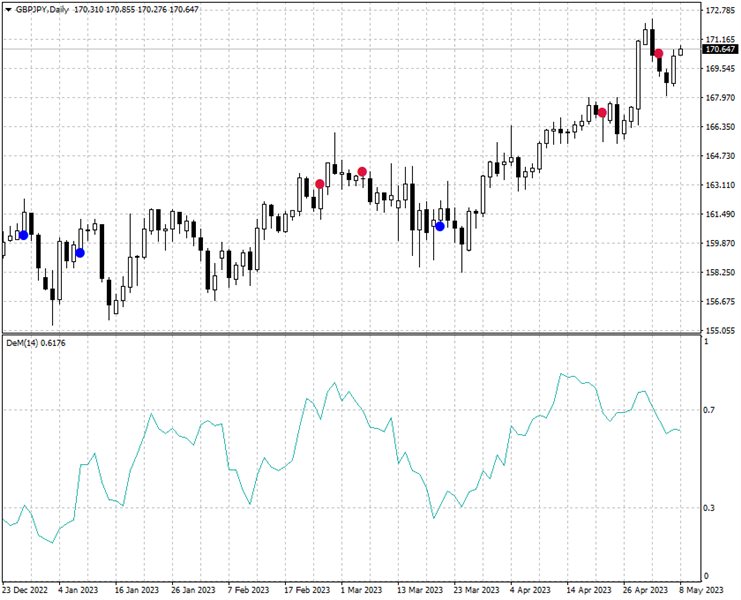
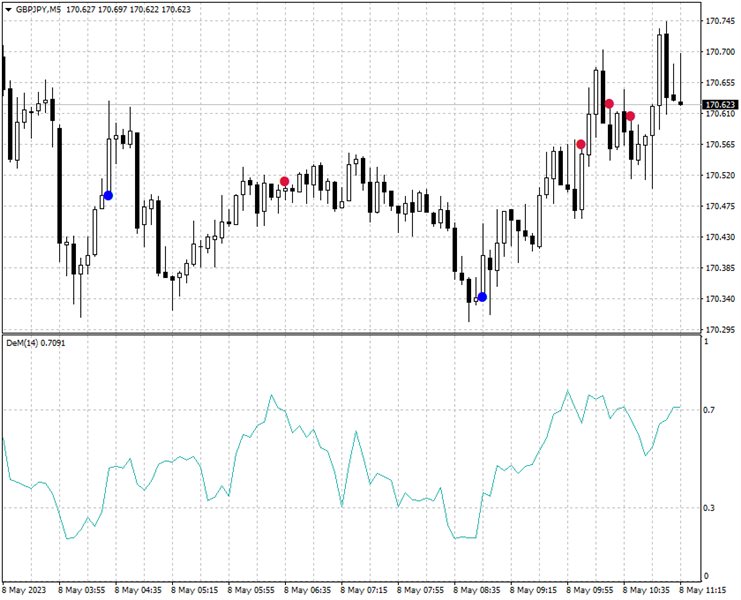
This indicator displays the signals based on the values of the classic DeMarker indicator on the price chart.
The DeMarker indicator can be used for determining the overbought or oversold areas on the chart.
Reaching these levels means that the market can soon turn around, but it does not give signal, as in a strong trend the market can stay in the overbought or oversold state for quite a long time.
As with most oscillators, the signals are generated when leaving these areas.
This indicator allows to display three types of signals on the chart - leaving the overbought or oversold areas, entering the overbought or oversold area, crossing the middle between the overbought or oversold areas.
The signals are displayed only on fully formed candles.
Once displayed, the signals are not redrawn.
- DeM_Period ( >0) - DeMarker indicator period;
- Level oversold (0-1) - level for oversold area;
- Level overbuy (0-1) - level for overbought area;
- Exit_from_oversold_or_overbuy - signal when leaving the overbought or oversold area;
- Entrance_to_oversold_or_overbuy - signal when entering the overbought or oversold area;
- Intersection_of_the_middle - signal when crossing the middle between the overbought or oversold areas;
- Alerts - show a dialog box;
- Send_Mail - sends an email using an address specified on the Email tab of the options window;
- Send_Notification - sends push notifications to the mobile terminals, whose MetaQuotes IDs are specified in the "Notifications" tab.
