• 概要
  • レビュー
  • コメント
  • 最新情報

RSI Dashboard For Multiple Pairs and Timeframes

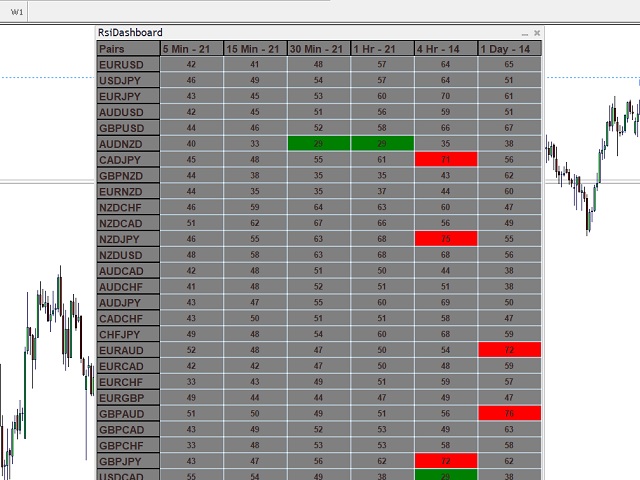
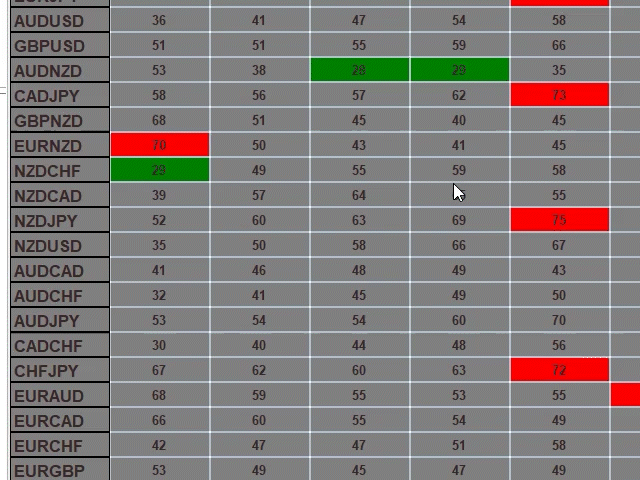
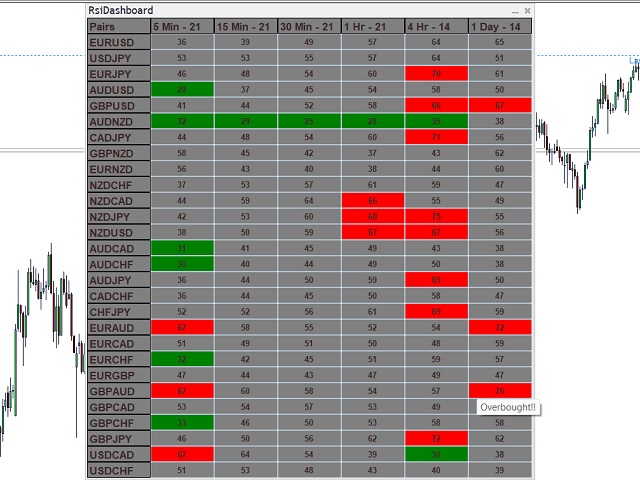
Never miss when a pair is being oversold or overbought again!! This RSI dashboard allows you to monitor RSI levels on 6 different time frames for up to 30 different currency pairs.

This dashboard is packed with features including:

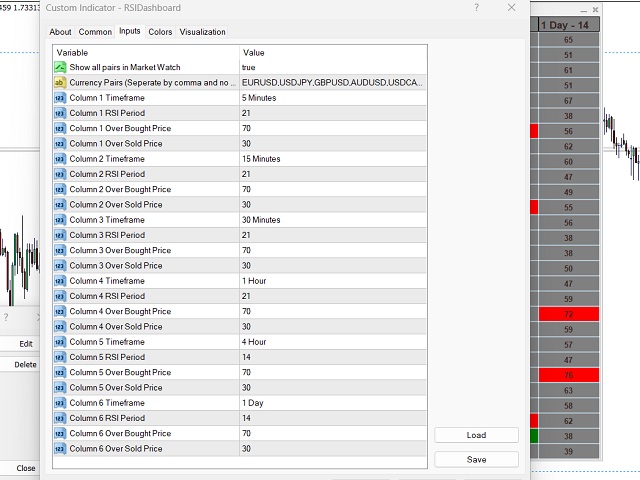
1. Monitoring of 6 customizable time frames (M1, M5, M15, M30, H1, H4, D1, W1, M1)

2. You can set the overbought/oversold levels you want for EACH time frame and they will be highlighted in the dashboard when a pair gets to that level

3. You can also set the RSI period you want for EACH time frame

4. Choose to enter in your own currency pairs (Up to 30) or have the dashboard start monitoring all of your pairs from MarketWatch

5. QUICKLY navigate to a chart by click on the corresponding RSI level in the dashboard

おすすめのプロダクト
This indicator takes input from the RSI and a trend filter, and presents the output in a separate indicator window as a histogram. Great for scalping. Settings: No need to set up the indicator. Features Alerts. How to use: Simply attach to any chart Zoom chart in to get a better view of the histo color. Buy:  Blue histo color on multiple timeframes. (e.g,. M30-H1-H4) Sell: Red histo color  across on multiple timeframes. Or backtest and use as you see fit for your strategy. Best results on Majo
This indicator shows the high volume zone. From the last minutes that you set yourself, the image of the volume zone is generated on an ongoing basis. The indicator also shows the V-Poc, Average Volumen and V-WAP lines. if you are using high intervals you must enter a large number of minutes. the zone builds itself up as the chart moves. if you want to build a zone from:  last day - 1440 minutes,    last week - 10080 minutes, ... etc. If you need an indicator that shows the constant volume zone
Modification of the RSI indicator with several types of alerts added to aid in your search for better opportunities in the market. Product Features Email Alert Sound alert Push Notification (Alerts can be sent to your mobile phone) Signs on chart Alert box Indicator Parameters Push Notification - This option enables your MetaTrader 4 to send alerts to your smartphone (IOS or Android). Email Alert - Configure your alerts to receive in your e-mail address. SignOnChart - Enable drawing alerts o
Vol 2 DPOC volume vol 2 DOC-dynamic horizontal volume indicator for any time periods Main settings of the indicator: Volume Source -selecting data for volumes (tick or real) DPOCOn -enabling / disabling the indicator DPOCFrom -calculation start date DPOCTo -settlement end date The indicator allows you to manually select areas on the chart to analyze changes in the maximum volume over time. You can do this by using vertical lines and moving them along the chart. Or by setting specific dates
Description of work The 'MA7 Aster' indicator is based on the standard Moving Average (MA) indicator. Shows the price deviation from the moving average. Detailed information about the 'MA7 Aster' indicator. Indicator settings General settings: Period – MA period; Method – MA method; Apply to – price type; Minimum distance – minimum distance from the moving average to the closing price of the candle. Message settings: Send message to the terminal (Alert) – permission to send messages to the
Icebreaker trend indicator provides an opportunity to classify the direction of price movement, determining its strength. The solution to this problem helps to enter the market on time. You can not only see the direction of the trend but also the levels by which you can work. The indicator determines the prevailing trend in the price chart. But not only, but also analyzes the price movement, and indicate the points of possible reversals. This contributes to the quick and optimal opening of bu
This powerful indicator intercepts 21 patterns simultaneously on 28 Pairs and on all timeframes. Just put the indicator on a single chart to see all patterns that appear on all pairs in all timeframes The patterns found are: For Bearish: Bearish Abandoned Baby; Bearish Engulfing; Bearish Harami; Bear Kicker; Dark Cloud Cover; Evening Doji Star; Evening Star; Shooting Star; Three Black Crows; Three Inside Down; Three Outside Down; For Bullish: Bullish Abandoned Baby; Bullish Engulfing; Bullish Ha
Range Volume Profile The indicator Range Volume Profile shows the distribution of transactions on the price scale in a given time range. This tool simplifies the analysis of the market situation and helps to find the price levels where a large player is sitting.   Features: shows the distribution of tick volumes relative to the price. shows the distribution of real volumes relative to the price. If your broker provides them. you can select the part of the chart that you want to explore. for cert
Introducing Trend Zones: Your Ultimate Tool for Precise Market Entry and Exit Points. Trend Zones is a revolutionary MetaTrader 4 indicator designed to provide traders with clear buy and sell zones based on trend reversals and price action. Built upon advanced algorithms and non-repainting technology, this indicator offers unparalleled accuracy in identifying optimal entry and exit points in the forex market. Key Features: 1. Non-Repainting Signals: Trend Zones delivers non-repainting signal
See what's happening across the entire market in different time frames with just a glance! This fully-responsive dashboard enables you to understand the current situation of the market without needing to check different charts. It visualizes the current value of three standard-scaled indicators (RSI, Stochastic and ADX) for your preferred symbol and time frames. You can even design some new trading strategies based on the insights it provides. Key features: Clicking on each dashboard cell ope
PSI tools delivers new special look aimed to bring Detailed Account Statement for all important statistics. The integrated MT4 is not accurate. It does not account correctly for Deposits, Withdrawals and completely ignores cases like hedged trades, break-even trades, other broker related credits, bonuses and so on events and as a result all statistics like draw-down, total trades, average win size, rate and so on are totally skewed. PSI corrects these mistakes. In the example below a demo accou
Hello This Indicator will draw Green (Up) and Red (Down) small arrows from Multi TimeFrames based in ( MACD ) to help you to take decision to buy or sell or waiting If there 4 green arrows in same vertical line that's mean (Up) and If there 4 Red arrows in same vertical line that's mean (Down)  and the options contain (Alert , Mobile and Mail Notifications). Please watch our video for more details https://youtu.be/MVzDbFYPw1M and these is EA for it https://www.mql5.com/en/market/product/53352  
Candle close countdown indicator. Almost all indicators work by ticks and therefore stop counting when the price stops in moments of little volatility. This indicator does not stop and remains synchronized with the broker's clock. It also has other functions that can help the trader. All features are configurable and you can choose if you want to use it or not: - Volume control:                         the counter changes color when the current candle has a higher volume of contracts than the pr
This indicator takes input from the OBV and a trend filter, and presents the output in a separate indicator window as a histogram. Great for scalping. Settings: TrendPeriod Features Alerts. How to use: Simply attach to any chart with default setting, or set the TrendPeriod to your preference. Zoom chart in to get a better view of the histo color. Buy:  Blue histo color on multiple timeframes. (e.g., M15-M30-H1-H4) Sell: Red histo color  on multiple timeframes. Or backtest and use as you see fi
Quantum Swing 1. What is Quantum Swing The indicator calculates and displays future price levels based on quantum mathematics with high accuracy of probability and direction. Levels are displayed in the form of zones for making trading decisions; they clearly define a narrow price range for placing orders with a minimum stop-loss and maximum take-profit. The indicator displays future trading zones on different timeframes H1, H4, D, W. Quantum oscillations are also displayed without reference to
FREE
the trend line Alert indicator will inform you when the candlesticks crosses or touches the desired line. the indicator is having pop up and push notifications, see the pictures down how to setup, e.x, 1. pic one is alert 2. pic two is right click of the chart  3. pic three is how to change names of the trend so the indicator will detect 4. pic four is how you changed in the correct way  any assistance please drop me via mql5 chat
Fakeout Detector Indicator The "Fakeout Detector" indicator is a tool designed to assist traders in identifying potential false price movements (fakeouts) in the financial markets. A fakeout is a condition where the price of an asset appears to be moving in one direction but then reverses, causing losses for traders who incorrectly take positions. This indicator helps traders avoid or anticipate fakeouts by identifying key points in price movements. Indicator Output Functions: Arrow Up (Upward A
This indicator alerts you when indicator-created lines are "touched" by price, You can change the interval between alerts. You can change colors and styles of lines as you want. However, lines must be named "Upper" and "Lower. There is a  more powerful PRO version . Input Parameters WaitTime: Interval between alarm. How To Use Place lines wherever you want to add alarms.
FREE
The Volume Str indicator is an indicator based on tick volumes. The very name of the indicator "Volume Street" indicates the use and sorting of volumes. according to a certain algorithm, which leads to a good result at the output. Look at the screenshots and you will see what signals it gives. The indicator does not redraw and you can use its signals after the first bar closes.
The SPV Corr indicator displays the average percentage correlation between the bar's body and its shadows. A very effective system for building various filters and market entry confirmations. It fixes cyclicality and can be used in trading in different ways. You can see the ups and downs of the indicator alternate and have such a relationship with the market, which can be used to draw conclusions to predict price behavior. Also, indicators can be combined with each other. The value of the indica
The New York Stock Exchange Session's Hours This indicator facilitates observing the currency pair's quotations during subsequent parts of the stock exchange session live. Before the session starts, a rectangle is drawn on the chart but not filled in with color. It means the extent of the session duration. Before the first bar enters the rectangle of the session, a sound signal or pop-up window will notify us that the session will just start. When the price graph crosses the edge of the sessi
Current strength of the 8 major currencies My   #1 Utility:  includes 65+ functions, including this indicator  |   Contact me  if you have any questions The indicator is displayed in a separate window, it can be moved to any place on the chart. In the input settings   you can adjust: Interface theme : dark / white; Prefix and Suffix,  if the currency pairs on your broker have it: (e.g. if Symbol is "EURUSD .pro ", please set " .pro " as a Suffix); Panel size Font size
The Trend Champion indicator works on all timeframes and currency pairs. The indicator should be used as an auxiliary tool for technical analysis, it helps to determine the direction of the trend: either upward or downward price movement for a particular currency pair. Can be used along with oscillators as filters. Trend Champion is a trend indicator. Arrows indicate favorable moments and directions for entering the market. The indicator can be used both for pipsing on small periods and for l
This is a simple arrow system based on MACD indicators Main/Base line and MACD Levels. It gives you alerts when MACD's Main Line crosses above/below certain level. Which type of alerts available? 1. It paints on chart Up/Down Arrows. 2. Popup message and sound alert in trading terminal window. 3. Push notification or Alert on your android and ios mobile phones (requires MT4 or MT5 app installed!)
MT5 Version Available Here:  https://www.mql5.com/en/market/product/62376 Telegram Channel & Group :  https://t.me/bluedigitsfx V.I.P Group Access:   Send Payment Proof of any of our Paid Products to our Inbox Recommended Broker:   https://eb4.app/BDFXOsprey * The Most Sought After Pip Counter for Metatrader ! Features Will show Currency Symbol in BLUE for Buy positions. Will show Currency Symbol in RED for Sell positions. Will Show pips in BLUE Color for Positive Pips Will Show pips in
FREE
Description of work The 'MA7 Ixora' indicator is based on the standard Moving Average (MA) indicator. Shows the intersection of the fast and slow moving averages. Detailed information about the 'MA7 Ixora' indicator. Indicator settings General settings: Consider the direction of the candle . Fast moving average settings: Period – MA period; Method – MA method; Apply to – price type. Slow moving average settings: Period – MA period; Method – MA method; Apply to – price type; Add to FMA pe
This is a non-repainting professional indicator for any currency pair on H1 chart. This indicator comes with Screen, Sound, Email and Push Notifications. Place your trades (risk of 1 to 2% each) when you get BUY/SELL alerts and EXIT when opposite or EXIT alerts. You can set your take profit from 70 to 100 pips when the indicator is attached to H1 chart. Stop loss may not be required, since you are going to close your trades on EXIT alerts. 
Advanced Bollinger Bands (BB) indicator. The standard Bands.mq4 indicator was complemented with a range of upper/lower band and signal of possible reverses. Parameters: BandsPeriod - indicator period. BandsRange - period of determining a range. BandsDeviations - number of standard deviations. Averaging Fast Period - fast period of averaging. Averaging Slow Period - slow period of averaging. Buffer indexes: 0 - Middle line, 1 - Upper line, 2 - Lower line, 3 - Upper range, 4 - Lower range, 5
Currency Correlation Plus is an expensive version of the indicator. It is equipped with the signal and is more equipped than its cheaper brother. The indicator helps us understand and see a correlation. Second chart makes it easy to analyze and trade multiple currencies. On the chart, you can post multiple pairs. Type in the selected currency pair in the settings and add it to the chart. If you want to have another tool, see another product: https://www.mql5.com/en/market/product/13392 Inputs
This tool allows you to draw trend lines, polarity zones, supports and resistances, Fibonacci retracements and save them. The user has 4 buttons which are displayed in their default configuration at the bottom left of the main window : - A "Level" button allowing you to draw support and resistance zones - A “Trend” button allowing you to draw a trend line - A “Fibo” button allowing you to display a Fibonacci retracement - A “DELETE” button which allows you to delete the selected object.
このプロダクトを購入した人は以下も購入しています
Gann Made Easy は、ミスター・ギャンの理論を使用した取引の最良の原則に基づいた、プロフェッショナルで使いやすい外国為替取引システムです。 W・D・ガン。このインジケーターは、ストップロスとテイクプロフィットレベルを含む正確な買いと売りのシグナルを提供します。 PUSH通知を利用して外出先でも取引可能です。 購入後はご連絡ください!私の取引のヒントと素晴らしいボーナスインジケーターを無料で共有します! おそらく、ギャンの取引手法についてはすでに何度も聞いたことがあるでしょう。通常、ギャンの理論は初心者のトレーダーだけでなく、すでにある程度の取引経験がある人にとっても非常に複雑なものです。なぜなら、ギャンの取引手法は理論的にはそれほど簡単に適用できるものではないからです。私はその知識を磨き、最良の原則を私の外国為替インジケーターに組み込むために数年を費やしました。 このインジケーターは非常に簡単に適用できます。必要なのは、それをチャートに添付し、簡単な取引推奨事項に従うだけです。このインジケーターは常に市場分析の仕事を行い、取引の機会を探します。適切なエントリーポイントを検出
現在26%オフ 初心者やエキスパートトレーダーに最適なソリューション! このインジケーターは、独自の機能と新しい計算式を取り入れた、ユニークで高品質、かつ手頃な価格のトレーディングツールです。たった1枚のチャートで28の為替ペアの通貨強度を読み取ることができます。新しいトレンドやスキャルピングチャンスの引き金となるポイントを正確に特定することができるので、あなたのトレードがどのように改善されるか想像してみてください。 ユーザーマニュアルはこちら  https://www.mql5.com/en/blogs/post/697384 これが最初の1本、オリジナルだ! 価値のないクローンを買わないでください。 特別な サブウィンドウの矢印で強い通貨の勢いを表示 GAPがあなたのトレードを導く! 基準通貨や気配値が売られすぎ・買われすぎのゾーン(外相フィボナッチレベル)にあるとき、個別チャートのメインウィンドウに警告表示。 通貨がレンジの外側から反落した場合、プルバック/リバーサルのアラート。 クロスパターンの特別なアラート 複数の時間枠を選択可能で、トレンドを素早く
Reversal First Impulse levels (RFI)    INSTRUCTIONS        RUS       -       ENG              R ecommended to use with an indicator   -   TREND PRO -  Version MT5 A key element in trading is zones or levels from which decisions to buy or sell a trading instrument are made. Despite attempts by major players to conceal their presence in the market, they inevitably leave traces. Our task was to learn how to identify these traces and interpret them correctly. Main functions: Displaying active zones
An exclusive indicator that utilizes an innovative algorithm to swiftly and accurately determine the market trend. The indicator automatically calculates opening, closing, and profit levels, providing detailed trading statistics. With these features, you can choose the most appropriate trading instrument for the current market conditions. Additionally, you can easily integrate your own arrow indicators into Scalper Inside Pro to quickly evaluate their statistics and profitability. Scalper Inside
Break and Retest
Mohamed Hassan
4.64 (11)
New update to V.4 where  Break & Retest automatically draws the take profit & stop loss levels and you also have more signals per day! ‍You can visually backtest Break & Retest to see how it behaved in the past!     Manual guide:   Click here $65  for only 1  copy left! Next price is $120 .  This Indicator only places quality trades when the market is really in your favor with a clear break and retest. Patience is key with this price action strategy! If you want more alert s
Advanced Supply Demand
Bernhard Schweigert
4.92 (311)
現在33%オフ 初心者にもエキスパートトレーダーにも最適なソリューション このインジケーターは独自の機能と新しい公式を多数内蔵しており、ユニークで高品質かつ手頃な取引ツールです。このアップデートでは、2つの時間枠ゾーンを表示できるようになります。より長いTFだけでなく、チャートTFとより長いTF(ネストゾーンを表示)の両方を表示できます。すべてのSupply Demandトレーダーの皆さんのお気に召すはずです。:) 重要情報の公開 Advanced Supply Demandの可能性を最大化するには、 https://www.mql5.com/ja/blogs/post/720245 にアクセスしてください。   エントリーまたはターゲットの正確なトリガーポイントを正確に特定できれば取引がどのように改善されるか想像してみてください。新しい基盤となるアルゴリズムに基づいて構築されているため、買い手と売り手の間の潜在的な不均衡をさらに簡単に特定できます。これは、最も強い需要と供給のゾーンと、過去のパフォーマンス(古いゾーンを表示)がグラフィカルに表現されるためです。これらの機能は、最適
TPSpro TRENDPRO  - is a trend indicator that automatically analyzes the market and provides information about the trend and each of its changes, as well as giving signals for entering trades without redrawing! The indicator uses each candle, analyzing them separately. referring to different impulses - up or down impulse. Exact entry points into transactions for currencies, crypto, metals, stocks, indices!  -  Version MT5               DETAILED DESCRIPTION                R ecommended to use with
まず第一に、この取引インジケーターは再描画されず、再描画されず、遅延しないことを強調する価値があります。これにより、手動取引とロボット取引の両方に理想的なものになります。 ユーザーマニュアル:設定、入力、戦略。 アトミックアナリストは、価格の強さとモメンタムを利用して市場でより良いエッジを見つけるためのPA価格アクションインジケーターです。ノイズや誤ったシグナルを除去し、取引ポテンシャルを高めるための高度なフィルターを備えています。複雑なインジケーターの複数のレイヤーを使用して、アトミックアナリストはチャートをスキャンし、複雑な数学的計算をシンプルなシグナルと色に変換します。これにより、どのような初心者トレーダーでも理解して使用し、一貫した取引の決定を行うことができます。 「アトミックアナリスト」は、新規および経験豊富なトレーダー向けにカスタマイズされた包括的な取引ソリューションです。プレミアムインジケーターとトップノッチの機能を1つの取引戦略に組み合わせ、すべてのタイプのトレーダーにとって汎用性のある選択肢にします。 デイリートレーディングとスキャルピング戦略:高
カスタムMT4インジケーターで外国為替取引を成功させるための秘密を発見してください! 外国為替市場で成功を達成し、リスクを最小限に抑えながら一貫して利益を得る方法を疑問に思ったことはありますか? これがあなたが探している答えです! 取引へのアプローチに革命をもたらす独自のMT4インジケーターを導入できるようにします。 ユニークな汎用性 私たちのインジケータは、RenkoとRangeBarのろうそくのフォーメーションを好むユーザー向けに特別に設計されています。 これらのチャートタイプは多くの経験豊富なトレーダーに好まれていることを理解しています。そのため、私たちのインジケーターはそれらとシームレスに統合され、比類のない市場分析を提供します。 クリアトレンドシグナル 複雑な分析を忘れてください! 私たちのインジケーターは、鮮やかな色と明確なドット構造を利用して、市場の動向を明確に示しています。 赤と青の点は、価格の動きの方向性について疑いの余地がなく、取引の迅速な意思決定を可能にします。 HH/HL HL/LL戦略とのアライメント HH/HLおよびHL/LL構
まず第一に、この取引ツールはノンリペイント、ノンリドロー、ノンラグの指標であり、プロの取引に理想的ですことを強調する価値があります。 オンラインコース、ユーザーマニュアル、デモ。 スマートプライスアクションコンセプトインジケーターは、新米から経験豊富なトレーダーまで、非常 に強力なツールです。Inner Circle Trader AnalysisやSmart Money Concepts Trading Strategiesなど、20以上の有用な指標を1つに組み合わせています。このインジケーターはスマートマネーコンセプトに焦点を当て、大手機関の取引方法を提供し、彼らの動きを予測するのに役立ちます。 特に、流動性分析に優れており、機関がどのように取引しているかを理解しやすくしています。市場のトレンドを予測し、価格の動きを慎重に分析するのに優れています。機関の戦略とトレードを合わせることで、市場の動向についてより正確な予測ができます。このインジケーターは多目的であり、市場構造を分析し、重要な注文ブロックを特定し、さまざまなパターンを認識するのに優れています。 このインジケー
TrendMaestro
Stefano Frisetti
5 (2)
note: this indicator is for METATRADER4, if you want the version for METATRADER5 this is the link:  https://www.mql5.com/it/market/product/108106 TRENDMAESTRO ver 2.4 TRENDMAESTRO recognizes a new TREND in the bud, he never makes mistakes. The certainty of identifying a new TREND is priceless. DESCRIPTION TRENDMAESTRO identifies a new TREND in the bud, this indicator examines the volatility, volumes and momentum to identify the moment in which there is an explosion of one or more of these data a
ブレーカートレーダーになり、価格が反転すると市場構造からの利益が変化します。 注文ブロックブレーカーインジケーターは、トレンドまたは価格の動きが枯渇に近づいており、逆転の準備ができていることを識別します。通常、反転または大規模なプルバックが発生しようとしているときに発生する市場構造の変化について警告します。 この指標は、ブレイクアウトと価格の勢いを識別する独自の計算を使用します。使い果たされる可能性のあるポイントの近くで新しい高値が形成されるたびに、インディケーターはその高値の作成を担当する最後の注文ブロックを描きます。次に、移動する価格とともに注文ブロックを追跡します。その後、価格が反対方向にシフトし、その注文ブロックを突破すると、新しい市場構造を作成し、トレンドまたは大きな後退の可能性のある反転の開始を警告します。 注文ブロックは、高値/安値が作成される前の最後の反対色のろうそくであり、価格がこれらの重要な領域を下抜けすると、トレンドの短期的ま​​たは長期的な反転の兆候です。 特徴 重要な枯渇点での市場構造の変化を警告します 価格が使い果たされるレベルに近づくと、
Trend Screener
STE S.S.COMPANY
4.83 (88)
トレンドインジケーター、1つのツールに組み込まれたすべての重要なトレンド機能を備えたトレンドトレーディングとフィルタリングのための画期的なユニークなソリューション! これは、すべてのシンボル/商品(外国為替、商品、暗号通貨、インデックス、株式)で使用できる100%再描画されていないマルチタイムフレームおよびマルチ通貨インジケーターです。 トレンドスクリーナーは、チャート内のドットで矢印トレンドシグナルを提供するインジケーターに続く効率的なインジケーターです。 トレンド分析インジケーターで使用できる機能: 1.トレンドスキャナー。 2.最大利益分析を備えたトレンドライン。 3.トレンド通貨強度メーター。 4.アラート付きのトレンド反転ドット。 5.アラート付きの強いトレンドドット。 6.トレンド矢印 毎日の分析例、毎日のシグナルパフォーマンス...など、トレンドスクリーナーインジケーターを使用して、ここで見つけることができます: ここをクリックしてください 期間限定オファー:トレンドスクリーナーインジケーターは、50ドルと生涯でのみご利用いただけます。 (元の価格125 $) MQ
現在20%OFF! 初心者やエキスパートトレーダーのためのベストソリューション! このダッシュボードソフトウェアは、28の通貨ペアで動作しています。それは私達の主要な指標(高度な通貨の強さ28と高度な通貨インパルス)の2に基づいています。それは全体の外国為替市場の大きい概観を与えます。それは、すべての(9)時間枠で28の外国為替ペアのための高度な通貨の強さの値、通貨の動きの速度と信号を示しています。チャート上で1つのインディケータを使用して市場全体を観察し、トレンドやスキャルピングの機会をピンポイントで見つけることができたら、あなたのトレードがどのように改善されるか想像してみてください。 このインディケータには、強い通貨と弱い通貨の識別、潜在的な取引の識別と確認がより簡単になるような機能が搭載されています。このインディケータは、通貨の強さや弱さが増加しているか減少しているか、また、すべての時間枠でどのように機能しているかをグラフィカルに表示します。 新機能として、現在の市場環境の変化に適応するダイナミックなマーケットフィボナッチレベルが追加され、すでに当社のAdvan
74% discount for the next 10 buyers (original price $605): 1 left Get a 50% bonus by buying (or even renting) any of our products. After buying (or renting), send a message for more information. 3 Indicators in 1 indicator Strategy based on price action Made specifically for the best forex currency pairs Can be used in the best time frame of the market at a very reasonable price This indicator is basically 3 different indicatos . But we have combined these 3 indicators in 1 indicator so th
ご紹介   クォンタム トレンド スナイパー インジケーターは 、トレンド反転を特定して取引する方法を変革する画期的な MQL5 インジケーターです。 13年以上の取引経験を持つ経験豊富なトレーダーのチームによって開発されました。     クォンタムトレンドスナイパーインジケーター   は、非常に高い精度でトレンドの反転を識別する革新的な方法で、あなたのトレーディングの旅を新たな高みに押し上げるように設計されています。 ***Quantum Trend Sniper Indicatorを購入すると、Quantum Breakout Indicatorを無料で入手できます!*** クォンタム ブレイクアウト インジケーターは、トレンドの反転を特定するとアラートを発し、矢印を示し、3 つのテイクプロフィットレベルを提案します。 初心者トレーダーにもプロのトレーダーにも適しています。 量子EAチャネル:       ここをクリック MT5のバージョン:       ここをクリック 推奨事項: 期間: すべての時間枠。最良の結果を得るには、
The indicator of a Professional Trader is an arrow indicator for predicting the direction of price movement. I have been working on this indicator since 2014. You can use this indicator as your main indicator, use its entry signals, and use it as your only indicator to find entry points. About the product: Recommended TF [H4-D1-W1]   . The indicator predicts the direction of the next candle. Fits a variety of tools; Flexibility in settings for different instruments and intervals through the
TrendDecoder Premium
Christophe Pa Trouillas
5 (4)
レンジと次の動きを特定    |  トレンドの最も早いシグナルと強さを得る   |  反転の前に明確な出口を得る   |  価格がテストするフィボ・レベルを見つける。 非リペイント、非遅延インディケータ - マニュアルおよび自動売買に最適 - すべての資産、すべての時間単位に対応 期間限定キャンペーン   >> 50%OFF 購入後、 推奨セッティングについては、このチャンネルで私に連絡してください。 MT5 バージョン: ここをクリック BladeSCALPER   と   PowerZONES   を使った完全な方法を入手する どのようなものですか? TrendDECODERは、トレンド監視をシンプルかつ簡単にするための複数のイノベーションを集約したものです。 Projective TrendLine (投影トレンドライン) - 今後のトレンドのスピードリファレンス。 RealTime TrendLine vs. Projective TrendLine (リアルタイムトレンドライン vs. Projective TrendLine) - 市場が同じ方
ご紹介     Quantum Breakout PRO は 、ブレイクアウト ゾーンの取引方法を変革する画期的な MQL5 インジケーターです。 13年以上の取引経験を持つ経験豊富なトレーダーのチームによって開発された Quantum Breakout PROは 、革新的でダイナミックなブレイクアウトゾーン戦略により、あなたの取引の旅を新たな高みに押し上げるように設計されています。 クォンタム ブレイクアウト インジケーターは、5 つの利益ターゲット ゾーンを備えたブレイクアウト ゾーン上のシグナル矢印と、ブレイクアウト ボックスに基づいたストップロスの提案を提供します。 初心者トレーダーにもプロのトレーダーにも適しています。 量子EAチャネル:       ここをクリック MT5バージョン:   ここをクリック 重要!購入後、インストールマニュアルを受け取るためにプライベートメッセージを送ってください。 推奨事項: 時間枠: M15 通貨ペア: GBPJPY、EURJPY、USDJPY、NZDUSD、XAUUSD アカウントの種類: ECN、Raw、また
FX Volume
Daniel Stein
4.6 (35)
mql5と Telegramの モーニング・ブリーフィングで、詳細とスクリーンショットを含む毎日のマーケット・アップデートをご覧 ください! FX Volumeは、ブローカーの視点から市場のセンチメントをリアルに洞察する、最初で唯一の出来高インジケーターです。 ブローカーのような機関投資家が外国為替市場でどのようなポジションをとっているか、COTレポートよりもはるかに速く、素晴らしい洞察を提供します。 この情報をチャート上で直接見ることは、あなたの取引にとって真のゲームチェンジャーであり、画期的なソリューションです。 以下のようなユニークなマーケットデータ洞察から利益を得てください。 比率は 、通貨のロングポジションとショートポジションの比率をパーセントで表示します。 比率の変化は 、選択した期間内のロング比率とその変化率を表示します。 Volumes Totalは 、通貨の取引量(ロングとショート)の合計をロット単位で表示します。 Volumes Long :全通貨のロングポジションの取引量を表示します。 Volumes(ショート )は、全通貨のショートポジションの取引量を表示
mql5と Telegramの モーニング・ブリーフィングで、詳細とスクリーンショットを含む毎日のマーケット・アップデートをご覧 ください! FX Power MT4 NGは 、長年の人気を誇る通貨強度計FX Powerの次世代モデルです。 この次世代ストレングスメーターは何を提供するのでしょうか?初代FXパワーの魅力すべて プラス GOLD/XAUの強さ分析 より正確な計算結果 個別に設定可能な分析期間 カスタマイズ可能な計算上限値により、さらに優れたパフォーマンスを実現 もっと見たい人のための特別なマルチインスタンス設定 すべてのチャートでお好みの色を無限に設定可能 数え切れないほどの通知オプションにより、重要なことを見逃すことはありません。 Windows 11とmacOSのスタイルで角を丸くした新しいデザイン 魔法のように動くインジケーターパネル FXパワーの主な機能 すべての主要通貨の強さの完全な履歴 すべての時間枠における通貨の強さの履歴 すべてのブローカーとチャートで同一の計算結果 100%信頼できるリアルタイム計算 -> リペイントなし ドロップダウン・リストから
このインジケータは、手動および自動的な方法でチャートに描かれたハーモニックパターンを検出します。ユーザーマニュアルは、このリンクから参照できます: あなたのレビューを追加し、入手するために私たちに連絡してください。 この製品をmt4で試すための無料版があります。 GartleyおよびNenstarパターンを検出するために使用できます。 https://www.mql5.com/en/market/product/30181 完全なMT4バージョンを購入するには、次の場所から購入できます。 https://www.mql5.com/en/market/product/15212 注 インジケータにはコントロールパネルがあり、すべての(チャート&時間枠)設定が保存されます。チャート上でスペースをより多く確保するために、最小化することができ、他の分析ツールで作業する場合は、すべてのインジケータデータを非表示にするために閉じるボタンを押すことができます。 このインジケータを使用して設定を変更し、移動平均やボリンジャーバンドなどのインジケータを追加すると、編集のテンプレートが自動的に保存され、必
ICT, SMC, SMART MONEY CONCEPTS, SMART MONEY, Smart Money Concept, Support and Resistance, Trend Analysis, Price Action, Market Structure, Order Blocks, BOS/CHoCH,   Breaker Blocks ,  Momentum Shift,   Supply&Demand Zone/Order Blocks , Strong Imbalance, HH/LL/HL/LH,    Fair Value Gap, FVG,  Premium  &   Discount   Zones, Fibonacci Retracement, OTE, Buy Side Liquidity, Sell Side Liquidity, BSL/SSL Taken, Equal Highs & Lows, MTF Dashboard, Multiple Time Frame, BigBar, HTF OB, HTF Market Structure, 
PRO Renko Systemは、特別にRENKOチャートを取引するために設計された高精度の取引システムです。 これは、様々な取引商品に適用することができる普遍的なシステムです。 システムは効果的に正確な逆転信号へのアクセスを与えるいわゆる市場の騒音を中和する。 表示器は非常に使いやすく、信号の生成に責任がある1つの変数だけがあります。 あなたは簡単にお好みの任意の取引ツールとレンコバーのサイズにツールを適応させることができます。 私はいつもあなたが私のソフトウェアで収益性の高い取引を支援するために余分なサポートを提供する準備ができています! 私はあなたに幸せで収益性の高い取引をしたいです! ご購入後にご連絡ください! 私はあなたに私のレンコチャートジェネレータを送信します。 私はまた、私の個人的な推奨事項やシステムの他のモジュールを無料で共有します!
Auto Order Block with break of structure based on ICT and Smart Money Concepts Futures Break of Structure ( BoS )             Order block ( OB )            Higher time frame Order block / Point of Interest ( POI )    shown on current chart           Fair value Gap ( FVG ) / Imbalance   ,  MTF      ( Multi Time Frame )    Volume Imbalance     ,  MTF          vIMB Gap’s Equal High / Low’s     ,  MTF             EQH / EQL Liquidity               Current Day High / Low           HOD /
Legacy of Gann
Pavel Zamoshnikov
4.83 (12)
The indicator very accurately determines the levels of the possible end of the trend and profit fixing. The method of determining levels is based on the ideas of W.D.Gann, using an algorithm developed by his follower Kirill Borovsky. Extremely high reliability of reaching levels (according to K. Borovsky  - 80-90%) Indispensable for any trading strategy – every trader needs to determine the exit point from the market! Precisely determines targets on any timeframes and any instruments (forex, met
BUY INDICATOR AND GET EA FOR FREE AS A BONUS + SOME OTHER GIFTS! ITALO LEVELS INDICATOR  is the best levels indicator ever created, and why is that? Using high volume zones on the market and Fibonacci the Indicator works on all time-frames and assets, indicator built after 7 years of experience on forex and many other markets. You know many levels indicators around the internet are not complete, does not help, and it's difficult to trade, but the   Italo Levels Indicator is different , the Ital
現在31%オフ! 初心者やエキスパートトレーダーに最適なソリューション! このインジケータは、独自の機能と秘密の数式を組み込んだ、ユニークで高品質かつ手頃な価格のトレーディングツールです。たった1枚のチャートで28の通貨ペアのアラートを表示します。新しいトレンドやスキャルピングチャンスの引き金となるポイントを正確に把握することができるので、あなたのトレードがどのように改善されるか想像してみてください! 新しい基本的なアルゴリズムに基づいて構築されているため、潜在的な取引の特定と確認がより簡単になります。これは、通貨の強さや弱さが加速しているかどうかをグラフィカルに表示し、その加速のスピードを測定するためです。加速すると物事は明らかに速く進みますが、これはFX市場でも同じです。つまり、反対方向に加速している通貨をペアにすれば、利益を生む可能性のある取引を特定することができるのです。 通貨の勢いを示す縦の線と矢印は、あなたの取引の指針となるでしょう。 ダイナミックマーケットフィボナッチ23レベルはアラートトリガーとして使用され、市場の動きに適応します。もしインパルスが黄色
このダッシュボードは、市場構造反転インジケーターで使用するためのアラートツールです。主な目的は、特定の時間枠での取消の機会と、インジケーターと同様にアラートの再テスト(確認)についてアラートを出すことです。ダッシュボードは、それ自体でチャート上に配置され、バックグラウンドで動作して、選択したペアと時間枠でアラートを送信するように設計されています。多くの人々が1つのMT4の複数のチャートで市場反転インジケーターを実行するのではなく、一度に複数のペアと時間枠を監視するためにダッシュを要求した後に開発されました。 M5、M15、M30、H1、H4、およびD1の時間枠でアラートを出します。もちろん、取引の場合と同様に、より高い時間枠が最も効果的です。 このダッシュボードは、市場構造反転インジケーターのアドオンとして設計されています。それは独立して機能し、マーケットリバーサルアラートインジケーターによって与えられたパターンと信号にアラートを出します。 ここでマーケットリバーサルアラートインジケーターを取得します:https:// www.mql5.com/en/market/produ
通貨強さウィザードは、取引を成功させるためのオールインワン ソリューションを提供する非常に強力な指標です。このインジケーターは、複数の時間枠のすべての通貨のデータを使用して、このまたはその外国為替ペアのパワーを計算します。このデータは、使いやすい通貨インデックスと通貨パワーラインの形式で表され、特定の通貨のパワーを確認するために使用できます。 必要なのは、取引したいチャートにインジケーターを接続することだけです。インジケーターは、取引する通貨の実際の強さを示します。このインジケーターは、トレンドに合わせて取引するときに有利に利用できる売買高の圧力の極値も示します。このインジケーターには、フィボナッチに基づく可能なターゲットも表示されます。 このインジケーターは、PUSH 通知を含むあらゆるタイプのアラートを提供します。 購入後ご連絡下さい。私の取引のヒントをあなたと共有し、素晴らしいボーナスインジケーターを無料で提供します! 幸せで有益な取引をお祈りします。
作者のその他のプロダクト
This indicator identifies the gap between the first and third candles in 3 consecutive candles. This area can be used to identify strong areas that the price may return to after a reversal or pullback. The indicator has 4 user defined settings: 1. Display Distance: This is how many previous candles the indicator will use to identify gaps. 2. BearBarColor: This is the color that will be used for gaps created during a downtrend. 3. BullBarColor: This is the color that will be used for gaps cre
フィルタ:
レビューなし
レビューに返信
バージョン 2.0 2023.04.04
Issue with chart not updating RSI values has been resolved.