• 概要
  • レビュー (1)
  • コメント (1)
  • 最新情報

Moving Average Crossovers Dashboard for MT4

4
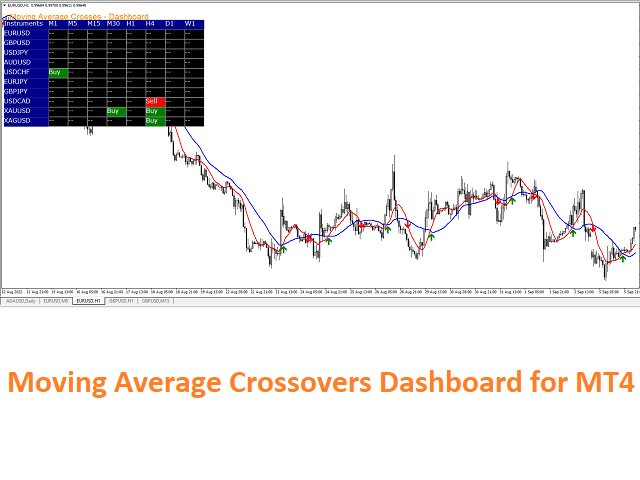
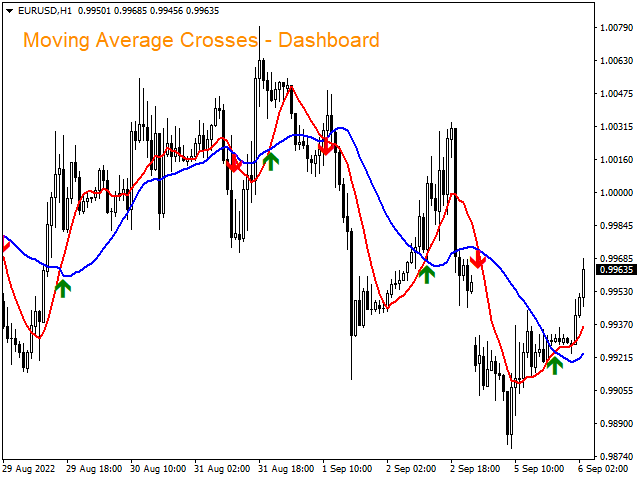
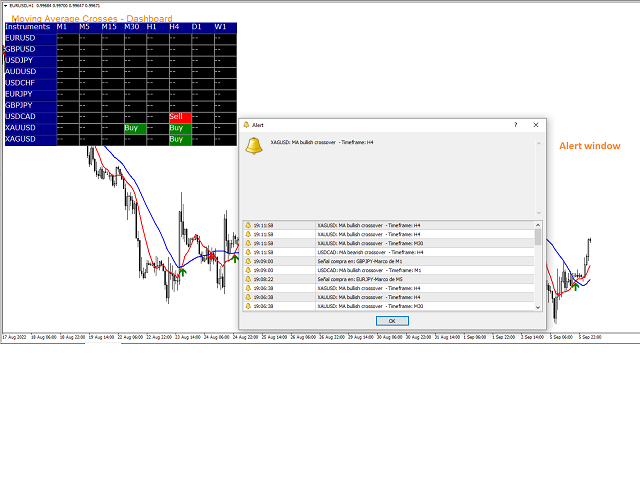
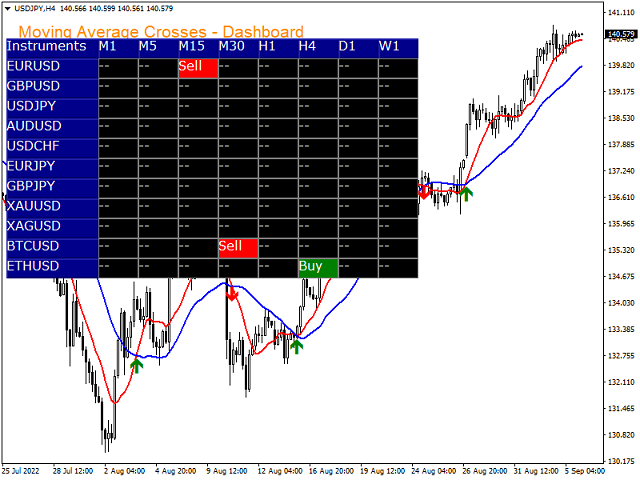
The Moving Average Crossover Dashboard indicator is a technical tool that displays the crossovers of 2 selected moving averages on the price chart indicating whether it is a bullish or bearish crossover. In addition, as its name indicates, it shows a signal dashboard that indicates in which market and time frame a crossover of the two moving averages occurs. In the setting window the user can select the markets and time frames that can be displayed on the dashboard. You also have the option to activate an alert window that indicates along with an audible alert when a moving average crossover occurs, on which pair and on which time frame.

Its main advantage is that it offers the possibility to monitor multiple markets at the same time from a single price chart looking for possible MA crossovers. For example, the trader can look for a golden cross (a crossover of the 50 SMA with the 200 SMA) in all the currency pairs that he follows through the dashboard.

It is possible to choose between the 4 types of moving averages currently offered by MT4: Simple, Exponential, Smoothed and Linear Weighted.

There is also the possibility of calculating moving averages based on different types of prices: Close, Open, High, Low, Typical, Median and Weighted.

Finally, the indicator offers the option that crossover signals on the dashboard and alert window are not displayed unless confirmed by the next candlestick, the ADX indicator or the Parabolic SAR.


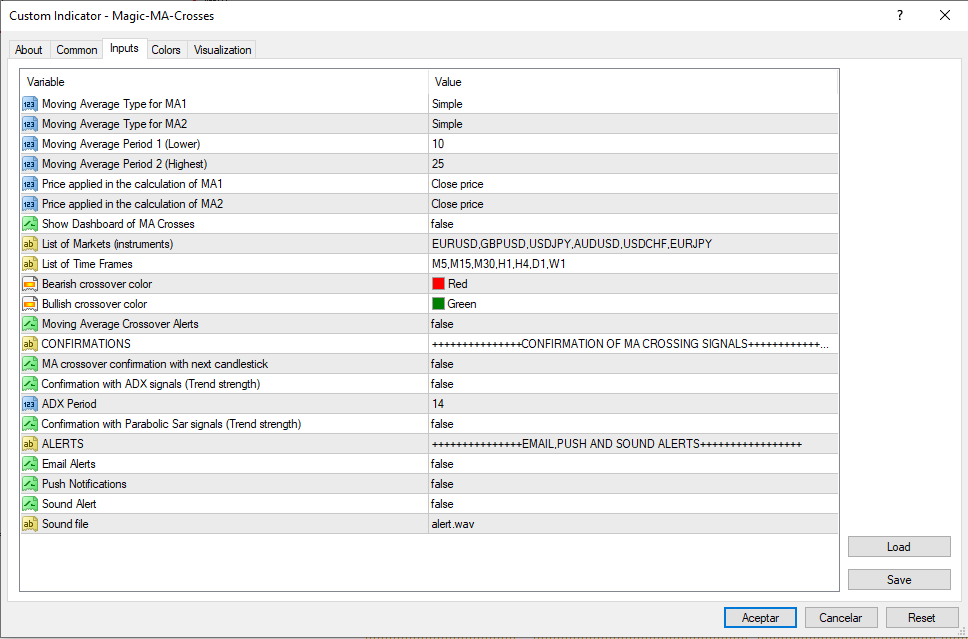
The parameters that can be configured in the Moving Average Crossover Dashboard indicato are the following:

  • Moving Average Type For MA1 (Minor): It is the moving average type of the short-term MA.
  • Moving Average Type For MA2 (Major): It is the moving average type of the long-term MA.
  • Moving Average Period 1 (Lower) : It is the calculation period of the short-term MA.
  • Moving Average Period 2 (Highest): It is the calculation period of the long-term MA.
  • Price applied in the calculation of MA1: It is the price type applied in the calculation of the short-term MA (Close, Open, High, Low, Typical, Median or Weighted).
  • Price applied in the calculation of MA2: It is the price type applied in the calculation of the long-term MA (Close, Open, High, Low, Typical, Median or Weighted).
  • Show Dashboard of MA Crossovers: With this parameter we can indicate whether or not we want to display the signals dashboard.
  • List of Markets: Here the trader indicates the markets or currency pairs in which the indicator should detect MA crossovers. You can add as many pairs as the broker offers on the platform. By default, the indicator shows EURUSD, GBPUSD, USDJPY and AUDUSD pairs.
  • List of Time Frames: In this parameter we can indicate in which time frames we want to detect MA crosses for each currency pair. We can aggregate all the time frames that MT4 offers. By default, the indicator displays  M5, M15, M30, H1, H4, D1 and W1 timeframes.
  • Bearish crossover color: It allows us to indicate the color for MA bearish crossovers.
  • Bullish crossover color: It allows us to indicate the color for MA bullish crossovers
  • Moving Average Crossover Alerts: This option allows us to indicate if we want the indicator to show an alert window
  • MA Crossover Confirmation with Next Candlestick: With this option we can indicate if we want the moving average crossovers to be confirmed by the next candlestick.
  • Confirmation with ADX Signals: To have more reliable signals this parameter allows us to indicate if we want MA crosses to be confirmed by the ADX trend strength indicator (ADX>25).

By itself, this indicator should not be used as a trading system as moving average crossover signals are not 100% reliable, as is the case with any technical indicator, but it is a useful support tool.

-To add new currency pairs in Markets, we write the symbol of the pair, for example, XAUUSD, without the “/” symbol and separated by a comma (no spaces).


レビュー 1
Carlos Alexandre Ribeiro Da Silva
362
 

I thought the indicator was excellent, just two suggestions: having the option to hide the lines in the graph and leaving only the visible frame and another to enable cell phone alerts too, I put it on my vps and I was disappointed not to receive the cell phone alerts.

おすすめのプロダクト
Power Renko is an indicator which plots Renko bricks underneath the chart using a histogram. You can select the brick size and the timeframe of the Renko bricks as well as whether or not to use the close price or the high/low price of the candles. Renko bricks are based on price alone, not time, therefor the Renko bricks will not be aligned with the chart's time. They are extremely useful for trend trading and many different strategies can be formed from them. Buffers are provided allowing you t
VR Cub
Vladimir Pastushak
VR Cub は、質の高いエントリーポイントを獲得するためのインジケーターです。このインジケーターは、数学的計算を容易にし、ポジションへのエントリーポイントの検索を簡素化するために開発されました。このインジケーターが作成されたトレーディング戦略は、長年にわたってその有効性が証明されてきました。取引戦略のシンプルさはその大きな利点であり、初心者のトレーダーでもうまく取引することができます。 VR Cub はポジション開始ポイントとテイクプロフィットとストップロスのターゲットレベルを計算し、効率と使いやすさを大幅に向上させます。取引の簡単なルールを理解するには、以下の戦略を使用した取引のスクリーンショットを見てください。 設定、設定ファイル、デモ版、説明書、問題解決方法は、以下から入手できます。 [ブログ] レビューを読んだり書いたりすることができます。 [リンク] のバージョン [MetaTrader 5] エントリーポイントの計算ルール ポジションをオープンする エントリーポイントを計算するには、VR Cub ツールを最後の高値から最後の安値までストレッチする必要があります。
Binary Options Support Resistance Indicator This indicator is designed for binary options trading and effectively shows retracements from support and resistance levels. Signals appear on the current candle. A red arrow pointing downwards indicates a potential selling opportunity, while a blue arrow pointing upwards suggests buying opportunities. All that needs adjustment is the color of the signal arrows. It is recommended to use it on the M1-M5 timeframes as signals are frequent on these timef
Forex Gump
Andrey Kozak
2.83 (6)
Forex Gump is a fully finished semi-automatic trading system. In the form of arrows, signals are displayed on the screen for opening and closing deals. All you need is to follow the instructions of the indicator. When the indicator shows a blue arrow, you need to open a buy order. When the indicator shows a red arrow, you need to open a sell order. Close orders when the indicator draws a yellow cross. In order to get the most effective result, we recommend using the timeframes H1, H4, D1. There
The indicator displays the data of the Stochastic oscillator from a higher timeframe on the chart. The main and signal lines are displayed in a separate window. The stepped response is not smoothed. The indicator is useful for practicing "manual" forex trading strategies, which use the data from several screens with different timeframes of a single symbol. The indicator uses the settings that are identical to the standard ones, and a drop-down list for selecting the timeframe. Indicator Parame
Advanced Trend Regime
Shellard Securities (Pty) Ltd
The indicator has been designed to function on any time-frame and any pair.   This regime filter will help the trader better evaluate whether the current market is trending, and in which direction. It quickly reacts to changes in market dynamics using a series of advanced calculations. The user is able to select whether the calculation remains standard, or if a further filter constraint is added to the calculation.   A Yellow moving average of the signal has been included for the trader to smoot
[ZhiBiCCI]インディケータは全てのサイクル使用に適しており、そして全ての市場品種にも適しています。 [ZhiBiCCI]緑色の実線は強気の発散の逆転です。緑色の点線は古典的な強気の発散です。 [ZhiBiCCI]赤への実線は逆弱気の発散である。赤い点線は古典的な弱気の発散です。 [ZhiBiCCI]はパラメータ(アラート、メール送信、通知送信)で設定でき、(true)に設定するとインスタント信号をアラームウィンドウに送信し、Eメール、インスタントメッセージを送信できます。 パラメータ設定の説明 [displayAlert]:これはアラームスイッチで、trueに設定され、矢印が表示されればプロンプトに自動的に警告され、falseに設定されれば警告されません。 [sendmail_NO_OFF]:これはメールを送信するためのスイッチで、trueに設定します。矢印が表示されていればMT4で設定したメールボックスにメールを送信し、falseに設定されていればメールを送信しません。 [sendnotification_NO_OFF]:これはインスタントメッセー
MetaTrader 4(MT4)用「Two Moving Average Crossover」インディケータは、2本の移動平均線を表示し、移動平均線が交差した際に通知するテクニカル分析ツールです。 このインディケータは、2本の移動平均を計算し、一方が速く、もう一方が遅い移動平均をプロットします。速い方の移動平均が遅い方の移動平均を上回った場合、強気シグナルと見なされ、トレンドの反転や新しい上昇トレンドの開始を示唆します。逆に、速い方の移動平均が遅い方の移動平均を下回ると、弱気 のシグナルとなり、トレンドの反転や新たな下降トレンドの開始を示唆し ます。 このインディケータは、単純移動平均(SMA)、指数移動平均(EMA)、平滑化 移動平均(SMMA)、線形加重移動平均(LWMA)など、異なるタイプの移動 平均を使用するようにカスタマイズすることが可能です。また、トレーダーの取引スタイルや好みに合わせて、各移動平均の期間を調整することができます。 移動平均のプロットだけでなく、クロスオーバーが発生した際にアラートを発 生させます。トレーダーは、クロスオーバーが発生したときに、音声または
This multi time frame and multi symbol indicator alerts about Heiken Ashi Smoothed color changes. As a bonus it can also scan for Hull Moving Average trend (color) changes. Combined with your own rules and techniques, this indicator will allow you to create (or enhance) your own powerful trading system. Features Can monitor all symbols visible in your Market Watch window at the same time. Apply the indicator to just one chart and instantly monitor the entire market. Can monitor every time frame
"The trend is your friend" is one of the best known sayings in investing, because capturing large trendy price movements can be extremely profitable. However, trading with the trend is often easier said than done, because many indicators are based on price reversals not trends. These aren't very effective at identifying trendy periods, or predicting whether trends will continue. We developed the Trendiness Index to help address this problem by indicating the strength and direction of price trend
This is a trend indicator without redrawing Developed instead of the binary options strategy (by the color of the Martingale candlestick) Also works well in forex trading When to open trades (binary options) A signal will appear in the place with a candle signaling the current candle It is recommended to open a deal for one candle of the current timeframe M1 and M5 When a blue dot appears, open a deal up When a red dot appears, open a trade down. How to open trades on Forex. When a signal is rec
PipFinite Trend PRO
Karlo Wilson Vendiola
4.9 (2775)
Breakthrough Solution For Trend Trading And Filtering With All Important Features Built Inside One Tool! Trend PRO's smart algorithm detects the trend, filters out market noise and gives entry signals with exit levels. The new features with enhanced rules for statistical calculation improved the overall performance of this indicator. Important Information Revealed Maximize the potential of Trend Pro, please visit www.mql5.com/en/blogs/post/713938 The Powerful Expert Advisor Version Automa
Noize Absorption Index - is the manual trading system that measures the difference of pressure between bears forces and bulls forces. Green line - is a noize free index that showing curent situation. Zero value of index shows totally choppy/flat market.Values above zero level shows how powerfull bullish wave is and values below zero measures bearish forces.Up arrow appears on bearish market when it's ready to reverse, dn arrow appears on weak bullish market, as a result of reverse expectation. S
Scalping Modulator is a scalping trading system. The indicator consists of several analytical modules. It automatically analyzes the market and shows the trader all the necessary information for trading. Scalping Modulator draws two trend lines on the chart. One line shows the long-term direction of the price, the second line shows the medium-term direction of the price. The indicator also draws red and blue dots on the chart. They indicate a likely change in price movement. In order to open a
About the Lyne indicator Lyne is a Metatrader 4 (MT4) indicator, the essence of which is to transform the accumulated historical data. The Lyne indicator makes it possible to detect various features and patterns in price dynamics that are invisible to the naked eye. Based on this information, traders can anticipate further price movement and adjust their strategy accordingly. This indicator has proven itself in the scalping strategy. The indicator works without repainting.
数列の一つに「森林火災数列」があります。これは、最も美しい新しいシーケンスの 1 つとして認識されています。その主な特徴は、このシーケンスが線形トレンドを回避することです。最短のものであってもです。この指標の基礎を形成したのはこのプロパティです。 財務時系列を分析する場合、この指標は可能なすべての傾向オプションを拒否しようとします。そして失敗した場合にのみ、トレンドの存在を認識し、適切なシグナルを発します。このアプローチにより、新しいトレンドの始まりの瞬間を正しく判断できます。ただし、偽陽性の可能性もあります。それらの数を減らすために、このインジケーターに追加のフィルターが追加されました。新しいバーが開くとシグナルが生成されます。いずれの場合も再描画は発生しません。 指標パラメータ: Applied Price - 適用価格定数; Period Main - インディケータのメイン期間、その有効な値は 5 ~ 60 です。 Period Additional - 追加の期間。このパラメーターの有効な値は 5 ~ 40 です。 Signal Filter - 追加の信号フィルター、有効
Stochastic Signals is a simple dashboard type indicator that displays the values of the stochastic oscillator on various instruments and time frames chosen by the user. The stochastic is usually used in many trading strategies, especially in countertrend systems when the price reaches overbought/oversold conditions. In addition, this indicator can be configured by the trader to show signals when the stochastic oscillator is in an overbought/oversold condition, when it crosses these levels or whe
Chart Patterns Detect 15 patterns (Ascending Triangle, Descending Triangle, Rising Wedge, Falling Wedge, Bullish Flag, Bearish Flag, Bullish Rectangle, Bearish Rectangle Symmetrical triangle, Head and Shoulders, Inverted Head and Shoulders, Triple top, Triple Bottom, Double Top, Double Bottom) Use historical data to calculate the probability of each pattern to succeed (possibility to filter notification according to the chance of success) gives graphic indication about the invalidation level and
The Stepping Trend Indicator     The Steppi ng Trend indicator uses the  average true range  (ATR indicator) in its calculation. This gives you control to set your own average true range period, I set the Default as 10.   Indicator Details. Green Arrow Up: This means you are at the starting point of a new bullish trend, it’s time to buy.   Red  Arrow  Down : This means you are at the starting point of a new  bearish  trend, it’ s time to sell .   What if you miss the Arrow Signal?   No
The indicator shows which trading pairs, strategies, robots and signals that you use are profitable and which are not. The statistic of trades and balance graph are displayed in the account currency and pips - to switch simply click on the graph. button "$"(top left) - minimize/expand and move the indicator panel button ">"(bottom right) - stretching and resetting to the original size Statistic of trades 1 line - account balance, current profit and lot of open trades; 2 line - the number of al
The Sextet Scalper Pro  is an MT4 indicator that gives signals when new waves are starting in a trend. The trends are calculated using the original " The Sextet " indicator method. You get a free EA to trade with The Sextet Scalper Pro: Free EA . Default settings were optimized on GBPUSD H1 from 2017. EA could be tested on free demo version of The Sextet Scalper Pro, before purchase. Key Features: Uses The Sextet Trend Detection Method which is already a good strategy in itself for detecting l
Golden Hunter MT4
Rodrigo Arana Garcia
4 (4)
最後の1枚は75ドルです。99$ !!!  MT5版 Golden Hunter は、マーケットでマニュアル取引を行うトレーダーのために開発されました。3種類の指標で構成される非常に強力なツールです。 強力なエントリー戦略:通貨ペアのボラティリティを測定し、市場のトレンドを特定する指標によって形成されています。 LSMA:価格データを平滑化し、短期的なトレンドを検出するのに有効です。 Heikin Ashi:インディケータをチャートに貼り付けると、日本のローソク足がHeikin Ashiローソク足に変更されます。このタイプのローソク足は、価格情報を滑らかにすることで、確かなトレンドを見出すことができる。 特徴 再塗装なし このインディケータは、新しいデータが到着しても値を変更しません 取引ペア 非常に低いスプレッドで、変動が激しいペア(EURUSD、GBPUSD、BTCUSD...)です。レンジペアの使用は推奨しません 期間 M5 取引時間 マーケットに動きがあり、スプレッドが低く抑えられる日中の時間帯に取引することが望ましい   必要条件 ス
Owl smart levels
Sergey Ermolov
4.63 (54)
MT5版  |   FAQ Owl Smart Levels Indicator   は、 Bill Williams   の高度なフラクタル、市場の正しい波構造を構築する Valable ZigZag、エントリの正確なレベルをマークする Fibonacci レベルなどの一般的な市場分析ツールを含む 1 つのインジケーター内の完全な取引システムです。 利益を得るために市場と場所に。 戦略の詳細な説明 インジケータを操作するための指示 顧問-取引助手 プライベートユーザーチャット ->購入後に私に書いて、私はプライベートチャットにあなたを追加し、あなたはそこにすべてのボーナスをダウンロードすることができます 力はシンプルさにあります! Owl Smart Levels   取引システムは非常に使いやすいので、専門家にも、市場を勉強し始めて自分で取引戦略を選択し始めたばかりの人にも適しています。 戦略と指標に秘密の数式や計算方法が隠されているわけではなく、すべての戦略指標は公開されています。 Owl Smart Levels を使用すると、取引を開始するためのシグナルをすばやく確認し、
Alpha Trend
Evgeny Belyaev
3.33 (3)
Alpha Trend is a trend indicator for the MetaTrader 4 platform; it has been developed by a group of professional traders. The Alpha Trend indicator finds the most probable tendency reversal points, which allows making trades at the very beginning of a trend. This indicator features notifications, which are generated whenever a new signal appears (alert, email, push-notification). This allows you to open a position in a timely manner. Alpha Trend does not redraw, which makes it possible to evalua
Gann Square of 144
Taras Slobodyanik
4.33 (6)
The Gann Box (or Gann Square) is a market analysis method based on the "Mathematical formula for market predictions" article by W.D. Gann. This indicator can plot three models of Squares: 90, 52(104), 144. There are six variants of grids and two variants of arcs. You can plot multiple squares on one chart simultaneously. Parameters Square — selection of a square model: 90 — square of 90 (or square of nine); 52 (104) — square of 52 (or 104); 144 — universal square of 144; 144 (full) — "full"
This indicator displays Stochastic osc signals on the price chart and allows the user to receive notifications of such signals. The Stochastic indicator is a classic and proven indicator of the technical analysis of the markets. Despite its age, it is still relevant today. Depending on the settings, the indicator allows you to work effectively on various TFs and any markets. Signals are given on fully formed bars and are not redrawn. Custom Parameters: Stochastic_Price (0-1) - The applied pric
FREE
Trend PA
Mikhail Nazarenko
5 (3)
The Trend PA indicator uses   Price Action   and its own filtering algorithm to determine the trend. This approach helps to accurately determine entry points and the current trend on any timeframe. The indicator uses its own algorithm for analyzing price changes and Price Action. Which gives you the advantage of recognizing, without delay, a new nascent trend with fewer false positives. Trend filtering conditions can be selected in the settings individually for your trading style. The indicator
Insider Scalper Binary This tool is designed to trade binary options. for short temporary spends. to make a deal is worth the moment of receiving the signal and only 1 candle if it is m1 then only for a minute and so in accordance with the timeframe. for better results, you need to select well-volatile charts.... recommended currency pairs eur | usd, usd | jpy .... the indicator is already configured, you just have to add it to the chart and trade .... The indicator signals the next can
Are you tired of the uncertainty that arises when your orders fail to stop at a specific line due to the spread? Look no further! Introducing our  indicator that plots candlesticks based on the Ask price instead of the traditional bid-based chart commonly used in MQL4. With this indicator, you can say goodbye to the frustrations caused by the bid-based chart, as it provides you with a more accurate representation of market movements. By utilizing the Ask price, which represents the price at whic
Intraday Levels shows intraday levels grid for intraday trading Shows a grid for the day levels, gives you a guide to know the trend and to measure intraday trades (stop-loss and take-profit). Parameters are: Levels Mode: Basic mode: Shows highest, lowest and middle levels. Advanced mode: Shows highest, lowest, middle and intermediate levels. Fibonacci mode: Shows session Fibonacci retracements levels. Momentum mode: Shows delayed Advanced levels to identify momentum. Smooth Period (Momentum
このプロダクトを購入した人は以下も購入しています
Gann Made Easy は、ミスター・ギャンの理論を使用した取引の最良の原則に基づいた、プロフェッショナルで使いやすい外国為替取引システムです。 W・D・ガン。このインジケーターは、ストップロスとテイクプロフィットレベルを含む正確な買いと売りのシグナルを提供します。 PUSH通知を利用して外出先でも取引可能です。 購入後はご連絡ください!私の取引のヒントと素晴らしいボーナスインジケーターを無料で共有します! おそらく、ギャンの取引手法についてはすでに何度も聞いたことがあるでしょう。通常、ギャンの理論は初心者のトレーダーだけでなく、すでにある程度の取引経験がある人にとっても非常に複雑なものです。なぜなら、ギャンの取引手法は理論的にはそれほど簡単に適用できるものではないからです。私はその知識を磨き、最良の原則を私の外国為替インジケーターに組み込むために数年を費やしました。 このインジケーターは非常に簡単に適用できます。必要なのは、それをチャートに添付し、簡単な取引推奨事項に従うだけです。このインジケーターは常に市場分析の仕事を行い、取引の機会を探します。適切なエントリーポイントを検出
現在26%オフ 初心者やエキスパートトレーダーに最適なソリューション! このインジケーターは、独自の機能と新しい計算式を取り入れた、ユニークで高品質、かつ手頃な価格のトレーディングツールです。たった1枚のチャートで28の為替ペアの通貨強度を読み取ることができます。新しいトレンドやスキャルピングチャンスの引き金となるポイントを正確に特定することができるので、あなたのトレードがどのように改善されるか想像してみてください。 ユーザーマニュアルはこちら  https://www.mql5.com/en/blogs/post/697384 これが最初の1本、オリジナルだ! 価値のないクローンを買わないでください。 特別な サブウィンドウの矢印で強い通貨の勢いを表示 GAPがあなたのトレードを導く! 基準通貨や気配値が売られすぎ・買われすぎのゾーン(外相フィボナッチレベル)にあるとき、個別チャートのメインウィンドウに警告表示。 通貨がレンジの外側から反落した場合、プルバック/リバーサルのアラート。 クロスパターンの特別なアラート 複数の時間枠を選択可能で、トレンドを素早く
74% discount for the next 10 buyers (original price $605): 1 left Get a 50% bonus by buying (or even renting) any of our products. After buying (or renting), send a message for more information. 3 Indicators in 1 indicator Strategy based on price action Made specifically for the best forex currency pairs Can be used in the best time frame of the market at a very reasonable price This indicator is basically 3 different indicatos . But we have combined these 3 indicators in 1 indicator so th
まず第一に、この取引インジケーターは再描画されず、再描画されず、遅延しないことを強調する価値があります。これにより、手動取引とロボット取引の両方に理想的なものになります。 ユーザーマニュアル:設定、入力、戦略。 アトミックアナリストは、価格の強さとモメンタムを利用して市場でより良いエッジを見つけるためのPA価格アクションインジケーターです。ノイズや誤ったシグナルを除去し、取引ポテンシャルを高めるための高度なフィルターを備えています。複雑なインジケーターの複数のレイヤーを使用して、アトミックアナリストはチャートをスキャンし、複雑な数学的計算をシンプルなシグナルと色に変換します。これにより、どのような初心者トレーダーでも理解して使用し、一貫した取引の決定を行うことができます。 「アトミックアナリスト」は、新規および経験豊富なトレーダー向けにカスタマイズされた包括的な取引ソリューションです。プレミアムインジケーターとトップノッチの機能を1つの取引戦略に組み合わせ、すべてのタイプのトレーダーにとって汎用性のある選択肢にします。 デイリートレーディングとスキャルピング戦略:高
ご紹介   クォンタム トレンド スナイパー インジケーターは 、トレンド反転を特定して取引する方法を変革する画期的な MQL5 インジケーターです。 13年以上の取引経験を持つ経験豊富なトレーダーのチームによって開発されました。     クォンタムトレンドスナイパーインジケーター   は、非常に高い精度でトレンドの反転を識別する革新的な方法で、あなたのトレーディングの旅を新たな高みに押し上げるように設計されています。 ***Quantum Trend Sniper Indicatorを購入すると、Quantum Breakout Indicatorを無料で入手できます!*** クォンタム ブレイクアウト インジケーターは、トレンドの反転を特定するとアラートを発し、矢印を示し、3 つのテイクプロフィットレベルを提案します。 初心者トレーダーにもプロのトレーダーにも適しています。 量子EAチャネル:       ここをクリック MT5のバージョン:       ここをクリック 推奨事項: 期間: すべての時間枠。最良の結果を得るには、
A key element in trading is zones or levels from which decisions to buy or sell a trading instrument are made. Despite attempts by major players to conceal their presence in the market, they inevitably leave traces. Our task was to learn how to identify these traces and interpret them correctly. Reversal First Impulse levels (RFI)   -  Version MT5                INSTRUCTIONS                 RUS                 ENG                                       R ecommended to use with an indicator   -  
TPSpro TRENDPRO  - is a trend indicator that automatically analyzes the market and provides information about the trend and each of its changes, as well as giving signals for entering trades without redrawing! The indicator uses each candle, analyzing them separately. referring to different impulses - up or down impulse. Exact entry points into transactions for currencies, crypto, metals, stocks, indices!  -  Version MT5               DETAILED DESCRIPTION        /       TRADING SETUPS           
‍You can visually backtest Break & Retest to see how it behaved in the past!     Manual guide:   Click here $65  for only 2  copies left! Next price is $120 .  This Indicator only places quality trades when the market is really in your favor with a clear break and retest. Patience is key with this price action strategy! Recommended timeframes: M1 for Scalpers.  M5 for Intraday traders. H1 & H4 for Day traders. Other timeframes are also excellent! After many months of hard
Advanced Supply Demand
Bernhard Schweigert
4.92 (310)
現在33%オフ 初心者にもエキスパートトレーダーにも最適なソリューション このインジケーターは独自の機能と新しい公式を多数内蔵しており、ユニークで高品質かつ手頃な取引ツールです。このアップデートでは、2つの時間枠ゾーンを表示できるようになります。より長いTFだけでなく、チャートTFとより長いTF(ネストゾーンを表示)の両方を表示できます。すべてのSupply Demandトレーダーの皆さんのお気に召すはずです。:) 重要情報の公開 Advanced Supply Demandの可能性を最大化するには、 https://www.mql5.com/ja/blogs/post/720245 にアクセスしてください。   エントリーまたはターゲットの正確なトリガーポイントを正確に特定できれば取引がどのように改善されるか想像してみてください。新しい基盤となるアルゴリズムに基づいて構築されているため、買い手と売り手の間の潜在的な不均衡をさらに簡単に特定できます。これは、最も強い需要と供給のゾーンと、過去のパフォーマンス(古いゾーンを表示)がグラフィカルに表現されるためです。これらの機能は、最適
カスタムMT4インジケーターで外国為替取引を成功させるための秘密を発見してください! 外国為替市場で成功を達成し、リスクを最小限に抑えながら一貫して利益を得る方法を疑問に思ったことはありますか? これがあなたが探している答えです! 取引へのアプローチに革命をもたらす独自のMT4インジケーターを導入できるようにします。 ユニークな汎用性 私たちのインジケータは、RenkoとRangeBarのろうそくのフォーメーションを好むユーザー向けに特別に設計されています。 これらのチャートタイプは多くの経験豊富なトレーダーに好まれていることを理解しています。そのため、私たちのインジケーターはそれらとシームレスに統合され、比類のない市場分析を提供します。 クリアトレンドシグナル 複雑な分析を忘れてください! 私たちのインジケーターは、鮮やかな色と明確なドット構造を利用して、市場の動向を明確に示しています。 赤と青の点は、価格の動きの方向性について疑いの余地がなく、取引の迅速な意思決定を可能にします。 HH/HL HL/LL戦略とのアライメント HH/HLおよびHL/LL構
An exclusive indicator that utilizes an innovative algorithm to swiftly and accurately determine the market trend. The indicator automatically calculates opening, closing, and profit levels, providing detailed trading statistics. With these features, you can choose the most appropriate trading instrument for the current market conditions. Additionally, you can easily integrate your own arrow indicators into Scalper Inside Pro to quickly evaluate their statistics and profitability. Scalper Inside
FX Volume
Daniel Stein
4.6 (35)
mql5と Telegramの モーニング・ブリーフィングで、詳細とスクリーンショットを含む毎日のマーケット・アップデートをご覧 ください! FX Volumeは、ブローカーの視点から市場のセンチメントをリアルに洞察する、最初で唯一の出来高インジケーターです。 ブローカーのような機関投資家が外国為替市場でどのようなポジションをとっているか、COTレポートよりもはるかに速く、素晴らしい洞察を提供します。 この情報をチャート上で直接見ることは、あなたの取引にとって真のゲームチェンジャーであり、画期的なソリューションです。 以下のようなユニークなマーケットデータ洞察から利益を得てください。 比率は 、通貨のロングポジションとショートポジションの比率をパーセントで表示します。 比率の変化は 、選択した期間内のロング比率とその変化率を表示します。 Volumes Totalは 、通貨の取引量(ロングとショート)の合計をロット単位で表示します。 Volumes Long :全通貨のロングポジションの取引量を表示します。 Volumes(ショート )は、全通貨のショートポジションの取引量を表示
mql5と Telegramの モーニング・ブリーフィングで、詳細とスクリーンショットを含む毎日のマーケット・アップデートをご覧 ください! FX Power MT4 NGは 、長年の人気を誇る通貨強度計FX Powerの次世代モデルです。 この次世代ストレングスメーターは何を提供するのでしょうか?初代FXパワーの魅力すべて プラス GOLD/XAUの強さ分析 より正確な計算結果 個別に設定可能な分析期間 カスタマイズ可能な計算上限値により、さらに優れたパフォーマンスを実現 もっと見たい人のための特別なマルチインスタンス設定 すべてのチャートでお好みの色を無限に設定可能 数え切れないほどの通知オプションにより、重要なことを見逃すことはありません。 Windows 11とmacOSのスタイルで角を丸くした新しいデザイン 魔法のように動くインジケーターパネル FXパワーの主な機能 すべての主要通貨の強さの完全な履歴 すべての時間枠における通貨の強さの履歴 すべてのブローカーとチャートで同一の計算結果 100%信頼できるリアルタイム計算 -> リペイントなし ドロップダウン・リストから
ご紹介     Quantum Breakout PRO は 、ブレイクアウト ゾーンの取引方法を変革する画期的な MQL5 インジケーターです。 13年以上の取引経験を持つ経験豊富なトレーダーのチームによって開発された Quantum Breakout PROは 、革新的でダイナミックなブレイクアウトゾーン戦略により、あなたの取引の旅を新たな高みに押し上げるように設計されています。 クォンタム ブレイクアウト インジケーターは、5 つの利益ターゲット ゾーンを備えたブレイクアウト ゾーン上のシグナル矢印と、ブレイクアウト ボックスに基づいたストップロスの提案を提供します。 初心者トレーダーにもプロのトレーダーにも適しています。 量子EAチャネル:       ここをクリック MT5バージョン:   ここをクリック 重要!購入後、インストールマニュアルを受け取るためにプライベートメッセージを送ってください。 推奨事項: 時間枠: M15 通貨ペア: GBPJPY、EURJPY、USDJPY、NZDUSD、XAUUSD アカウントの種類: ECN、Raw、また
現在31%オフ! 初心者やエキスパートトレーダーに最適なソリューション! このインジケータは、独自の機能と秘密の数式を組み込んだ、ユニークで高品質かつ手頃な価格のトレーディングツールです。たった1枚のチャートで28の通貨ペアのアラートを表示します。新しいトレンドやスキャルピングチャンスの引き金となるポイントを正確に把握することができるので、あなたのトレードがどのように改善されるか想像してみてください! 新しい基本的なアルゴリズムに基づいて構築されているため、潜在的な取引の特定と確認がより簡単になります。これは、通貨の強さや弱さが加速しているかどうかをグラフィカルに表示し、その加速のスピードを測定するためです。加速すると物事は明らかに速く進みますが、これはFX市場でも同じです。つまり、反対方向に加速している通貨をペアにすれば、利益を生む可能性のある取引を特定することができるのです。 通貨の勢いを示す縦の線と矢印は、あなたの取引の指針となるでしょう。 ダイナミックマーケットフィボナッチ23レベルはアラートトリガーとして使用され、市場の動きに適応します。もしインパルスが黄色
まず第一に、この取引ツールはノンリペイント、ノンリドロー、ノンラグの指標であり、プロの取引に理想的ですことを強調する価値があります。 オンラインコース、ユーザーマニュアル、デモ。 スマートプライスアクションコンセプトインジケーターは、新米から経験豊富なトレーダーまで、非常 に強力なツールです。Inner Circle Trader AnalysisやSmart Money Concepts Trading Strategiesなど、20以上の有用な指標を1つに組み合わせています。このインジケーターはスマートマネーコンセプトに焦点を当て、大手機関の取引方法を提供し、彼らの動きを予測するのに役立ちます。 特に、流動性分析に優れており、機関がどのように取引しているかを理解しやすくしています。市場のトレンドを予測し、価格の動きを慎重に分析するのに優れています。機関の戦略とトレードを合わせることで、市場の動向についてより正確な予測ができます。このインジケーターは多目的であり、市場構造を分析し、重要な注文ブロックを特定し、さまざまなパターンを認識するのに優れています。 このインジケー
ブレーカートレーダーになり、価格が反転すると市場構造からの利益が変化します。 注文ブロックブレーカーインジケーターは、トレンドまたは価格の動きが枯渇に近づいており、逆転の準備ができていることを識別します。通常、反転または大規模なプルバックが発生しようとしているときに発生する市場構造の変化について警告します。 この指標は、ブレイクアウトと価格の勢いを識別する独自の計算を使用します。使い果たされる可能性のあるポイントの近くで新しい高値が形成されるたびに、インディケーターはその高値の作成を担当する最後の注文ブロックを描きます。次に、移動する価格とともに注文ブロックを追跡します。その後、価格が反対方向にシフトし、その注文ブロックを突破すると、新しい市場構造を作成し、トレンドまたは大きな後退の可能性のある反転の開始を警告します。 注文ブロックは、高値/安値が作成される前の最後の反対色のろうそくであり、価格がこれらの重要な領域を下抜けすると、トレンドの短期的ま​​たは長期的な反転の兆候です。 特徴 重要な枯渇点での市場構造の変化を警告します 価格が使い果たされるレベルに近づくと、
ON Trade Waves Patterns Harmonic Elliot Wolfeをご紹介します。これは手動および自動の方法を使用して市場のさまざまなパターンを検出するために設計された高度なインジケーターです。以下はその動作方法です: ハーモニックパターン: このインジケーターは、チャートに表示されるハーモニックパターンを識別できます。これらのパターンは、Scott Carneyの「Harmonic Trading vol 1および2」で説明されているように、ハーモニックトレーディング理論を実践するトレーダーにとって重要です。手動で描画するか、自動検出に頼るかにかかわらず、ON Trade Waves Patternsがお手伝いします。 コントロールパネル: このインジケーターはユーザーフレンドリーなコントロールパネルを備えています。チャートと時間枠の設定を保存し、異なる構成間をスムーズに切り替えることができます。チャートスペースを最大限に活用するために最小化することもできます。他の分析ツールで作業することを好む場合、閉じるボタンをクリックするだけで、すべてのインジケーターデ
Trend Screener
STE S.S.COMPANY
4.83 (88)
トレンドインジケーター、1つのツールに組み込まれたすべての重要なトレンド機能を備えたトレンドトレーディングとフィルタリングのための画期的なユニークなソリューション! これは、すべてのシンボル/商品(外国為替、商品、暗号通貨、インデックス、株式)で使用できる100%再描画されていないマルチタイムフレームおよびマルチ通貨インジケーターです。 トレンドスクリーナーは、チャート内のドットで矢印トレンドシグナルを提供するインジケーターに続く効率的なインジケーターです。 トレンド分析インジケーターで使用できる機能: 1.トレンドスキャナー。 2.最大利益分析を備えたトレンドライン。 3.トレンド通貨強度メーター。 4.アラート付きのトレンド反転ドット。 5.アラート付きの強いトレンドドット。 6.トレンド矢印 毎日の分析例、毎日のシグナルパフォーマンス...など、トレンドスクリーナーインジケーターを使用して、ここで見つけることができます: ここをクリックしてください 期間限定オファー:トレンドスクリーナーインジケーターは、50ドルと生涯でのみご利用いただけます。 (元の価格125 $) MQ
通貨強さウィザードは、取引を成功させるためのオールインワン ソリューションを提供する非常に強力な指標です。このインジケーターは、複数の時間枠のすべての通貨のデータを使用して、このまたはその外国為替ペアのパワーを計算します。このデータは、使いやすい通貨インデックスと通貨パワーラインの形式で表され、特定の通貨のパワーを確認するために使用できます。 必要なのは、取引したいチャートにインジケーターを接続することだけです。インジケーターは、取引する通貨の実際の強さを示します。このインジケーターは、トレンドに合わせて取引するときに有利に利用できる売買高の圧力の極値も示します。このインジケーターには、フィボナッチに基づく可能なターゲットも表示されます。 このインジケーターは、PUSH 通知を含むあらゆるタイプのアラートを提供します。 購入後ご連絡下さい。私の取引のヒントをあなたと共有し、素晴らしいボーナスインジケーターを無料で提供します! 幸せで有益な取引をお祈りします。
TrendDecoder Premium
Christophe, Pa Trouillas
5 (3)
レンジと次の動きを特定    |  トレンドの最も早いシグナルと強さを得る   |  反転の前に明確な出口を得る   |  価格がテストするフィボ・レベルを見つける。 非リペイント、非遅延インディケータ - マニュアルおよび自動売買に最適 - すべての資産、すべての時間単位に対応 期間限定キャンペーン   >> 50%OFF 購入後、 推奨セッティングについては、このチャンネルで私に連絡してください。 MT5 バージョン: ここをクリック BladeSCALPER   と   PowerZONES   を使った完全な方法を入手する どのようなものですか? TrendDECODERは、トレンド監視をシンプルかつ簡単にするための複数のイノベーションを集約したものです。 Projective TrendLine (投影トレンドライン) - 今後のトレンドのスピードリファレンス。 RealTime TrendLine vs. Projective TrendLine (リアルタイムトレンドライン vs. Projective TrendLine) - 市場が同じ方
Scalper Vault は、スキャルピングを成功させるために必要なすべてを提供するプロフェッショナルなスキャルピング システムです。このインジケーターは、外国為替およびバイナリー オプションのトレーダーが使用できる完全な取引システムです。推奨される時間枠は M5 です。 システムは、トレンドの方向に正確な矢印シグナルを提供します。また、トップとボトムのシグナルとギャン マーケット レベルも提供します。 インジケーターは、プッシュ通知を含むすべてのタイプのアラートを提供します。 インジケータの購入後にご連絡ください。私の個人的な取引の推奨事項と素晴らしいボーナス指標を無料で共有します! 幸せで有益な取引をお祈りします!
PRO Renko Systemは、特別にRENKOチャートを取引するために設計された高精度の取引システムです。 これは、様々な取引商品に適用することができる普遍的なシステムです。 システムは効果的に正確な逆転信号へのアクセスを与えるいわゆる市場の騒音を中和する。 表示器は非常に使いやすく、信号の生成に責任がある1つの変数だけがあります。 あなたは簡単にお好みの任意の取引ツールとレンコバーのサイズにツールを適応させることができます。 私はいつもあなたが私のソフトウェアで収益性の高い取引を支援するために余分なサポートを提供する準備ができています! 私はあなたに幸せで収益性の高い取引をしたいです! ご購入後にご連絡ください! 私はあなたに私のレンコチャートジェネレータを送信します。 私はまた、私の個人的な推奨事項やシステムの他のモジュールを無料で共有します!
現在20%OFF! 初心者やエキスパートトレーダーのためのベストソリューション! このダッシュボードソフトウェアは、28の通貨ペアで動作しています。それは私達の主要な指標(高度な通貨の強さ28と高度な通貨インパルス)の2に基づいています。それは全体の外国為替市場の大きい概観を与えます。それは、すべての(9)時間枠で28の外国為替ペアのための高度な通貨の強さの値、通貨の動きの速度と信号を示しています。チャート上で1つのインディケータを使用して市場全体を観察し、トレンドやスキャルピングの機会をピンポイントで見つけることができたら、あなたのトレードがどのように改善されるか想像してみてください。 このインディケータには、強い通貨と弱い通貨の識別、潜在的な取引の識別と確認がより簡単になるような機能が搭載されています。このインディケータは、通貨の強さや弱さが増加しているか減少しているか、また、すべての時間枠でどのように機能しているかをグラフィカルに表示します。 新機能として、現在の市場環境の変化に適応するダイナミックなマーケットフィボナッチレベルが追加され、すでに当社のAdvan
このインジケータは、手動および自動的な方法でチャートに描かれたハーモニックパターンを検出します。ユーザーマニュアルは、このリンクから参照できます: あなたのレビューを追加し、入手するために私たちに連絡してください。 この製品をmt4で試すための無料版があります。 GartleyおよびNenstarパターンを検出するために使用できます。 https://www.mql5.com/en/market/product/30181 完全なMT4バージョンを購入するには、次の場所から購入できます。 https://www.mql5.com/en/market/product/15212 注 インジケータにはコントロールパネルがあり、すべての(チャート&時間枠)設定が保存されます。チャート上でスペースをより多く確保するために、最小化することができ、他の分析ツールで作業する場合は、すべてのインジケータデータを非表示にするために閉じるボタンを押すことができます。 このインジケータを使用して設定を変更し、移動平均やボリンジャーバンドなどのインジケータを追加すると、編集のテンプレートが自動的に保存され、必
TrendMaestro
Stefano Frisetti
5 (2)
note: this indicator is for METATRADER4, if you want the version for METATRADER5 this is the link:  https://www.mql5.com/it/market/product/108106 TRENDMAESTRO ver 2.4 TRENDMAESTRO recognizes a new TREND in the bud, he never makes mistakes. The certainty of identifying a new TREND is priceless. DESCRIPTION TRENDMAESTRO identifies a new TREND in the bud, this indicator examines the volatility, volumes and momentum to identify the moment in which there is an explosion of one or more of these data a
このダッシュボードは、市場構造反転インジケーターで使用するためのアラートツールです。主な目的は、特定の時間枠での取消の機会と、インジケーターと同様にアラートの再テスト(確認)についてアラートを出すことです。ダッシュボードは、それ自体でチャート上に配置され、バックグラウンドで動作して、選択したペアと時間枠でアラートを送信するように設計されています。多くの人々が1つのMT4の複数のチャートで市場反転インジケーターを実行するのではなく、一度に複数のペアと時間枠を監視するためにダッシュを要求した後に開発されました。 M5、M15、M30、H1、H4、およびD1の時間枠でアラートを出します。もちろん、取引の場合と同様に、より高い時間枠が最も効果的です。 このダッシュボードは、市場構造反転インジケーターのアドオンとして設計されています。それは独立して機能し、マーケットリバーサルアラートインジケーターによって与えられたパターンと信号にアラートを出します。 ここでマーケットリバーサルアラートインジケーターを取得します:https:// www.mql5.com/en/market/produ
支持線と抵抗線、そしてローソク足のギャップをチャート上に自動的に表示するため、価格が次に向かう可能性のある場所や反転する可能性のある場所を確認することができます。 このインジケーターは、私のウェブサイト(The Market Structure Trader)で教えているポジショントレード手法の一部として使用するように設計されており、ターゲットとエントリーの可能性のための重要な情報を表示します。 このインジケーターには、2つのコア機能と4つの追加機能があります: コア機能1 - 日足、週足、月足のサポートラインとレジスタンスラインの自動表示 このインジケーターは、直近2日間、最大6週間前、数ヶ月前のサポートレベルとレジスタンスレベルを自動的に引き込みます。これらのレベルの見た目は完全にカスタマイズすることができ、いくつ表示されるかを表示することもできます。これらの重要な水準は、しばしば主要な支持線と抵抗線として機能し、価格が転換して引き戻されたり反転したりする場所です。また、価格が向かうターゲットでもあるため、価格が転換する前に、取引に利用できる潜在的な距離を素早く確認するこ
Thise indicator is up down v6  comes with tradingwiev pinescript. purchased people, after installed on terminal ,contact me on mql5  to get BONUS  TradingView pinescript. up-down indicator is no repaint and works all pairs and lower than weekly time frames charts. it is suitable also 1 m charts for all pairs. and hold long way to signal. dont gives too many signals. when red histogram cross trigger line that is up signal.and price probably will down when blue histogram cross trigger line that
Volatility Trend System - a trading system that gives signals for entries. The volatility system gives linear and point signals in the direction of the trend, as well as signals to exit it, without redrawing and delays. The trend indicator monitors the direction of the medium-term trend, shows the direction and its change. The signal indicator is based on changes in volatility and shows market entries. The indicator is equipped with several types of alerts. Can be applied to various trading
作者のその他のプロダクト
Stochastic Signals is a simple dashboard type indicator that displays the values of the stochastic oscillator on various instruments and time frames chosen by the user. The stochastic is usually used in many trading strategies, especially in countertrend systems when the price reaches overbought/oversold conditions. In addition, this indicator can be configured by the trader to show signals when the stochastic oscillator is in an overbought/oversold condition, when it crosses these levels or whe
Indicador de Bandas de Fibonacci para Metatrader 4 . Este indicador funciona de forma similar a las conocidas Bandas de Bollinger clásicas, pero en lugar de usar la desviación estándar para trazar las bandas usa números de Fibonacci y el ATR (Average True Range). Puede usarse para trazar niveles de soporte y resistencia que pueden emplearse en sistemas de scalping de corto plazo y swing trading.  Las bandas del indicador son calculadas de la siguiente forma: Línea central : Media móvil de n peri
FREE
RSI Signals is a simple dashboard type indicator that displays the values of the RSI (Relative Strength Index) oscillator on various instruments and time frames chosen by the user. In addition, it can be configured by the trader to show signals when the RSI is in an overbought/oversold condition, when it crosses these levels or when it crosses the 50 level, which is important in some strategies. It is simple and easy to set up. By itself, it should not be used as a trading system since RSI signa
El indicador Tablero de Cruces de MA es un indicador que muestra los cruces de 2 medias móviles seleccionadas en el gráfico de precios indicando si se trata de un cruce alcista o bajista. Además, como su nombre lo indica, muestra un tablero de señales que indica en que mercado y marco de tiempo se produce un cruce de las dos medias móviles. En la ventana de configuración el usuario puede seleccionar los mercados y marcos de tiempo que puede visualizar en el tablero. También tiene la opción de ac
The Magic MA Moving Average Indicator is a market analysis tool that has more than 30 types of moving averages that the trader can use to gauge the market trend. Among the types of moving averages that the trader can visualize are the most common MAs (SMA, EMA and SMMA), adaptive moving averages such as FRAMA and KAMA and other MAs based on innovative calculation and analysis methods such as LSMA, ZLEMA and others. The indicator is designed to display all these moving averages on a single c
ADX Analyzer is a simple dashboard type indicator that displays the values of the ADX oscillator on multiple instruments and time frames chosen by the trader. The ADX is a trend strength indicator that is usually used in many trading strategies, especially in trend following systems, as a filter that indicates when the price has a strong bullish or bearish trend. This indicator and its dashboard can be configured to show signals when the ADX detects a strong bullish/bearish trend, when a strong
Williams R Scanner Indicator is a technical tool for Metatrader 4 designed to display a simple dashboard showing the values of the Williams %R oscillator across multiple markets and time frames of the trader's choosing. The dashboard also shows when the Williams %R indicator reaches an overbought or oversold condition which may precede market reversals. The trader also has the option of viewing signal alerts on the platform that indicate when the Williams %R has made a bullish or bearish cros
The Donchian Scanner Signals Indicator with is a powerful tool designed for traders operating in the financial market using the Metatrader 4 platform. This indicator combines the popular Donchian Channels strategy with advanced signalization and real-time alert features, providing a clear view of potential entry and exit points in a financial asset. Key Features: Donchian Channels Visualization: The indicator graphically displays Donchian Channels on the price chart. These channels are formed us
MA Trend Following Indicator for MT4 is a simple technical analysis tool designed to follow the trend in any currency pair chosen by the trader by combining 3 moving averages on two different time frames, one long term and one short term.  It basically provides a bullish or bearish signal when the moving averages on one time frame align with the moving averages on a different time frame to have a confluence signal. The indicator is presented as a screener with multiple currency pairs (that
フィルタ:
Carlos Alexandre Ribeiro Da Silva
362
 

I thought the indicator was excellent, just two suggestions: having the option to hide the lines in the graph and leaving only the visible frame and another to enable cell phone alerts too, I put it on my vps and I was disappointed not to receive the cell phone alerts.

レビューに返信
バージョン 1.2 2023.07.25
-This new version has signal alerts via push notifications, email and sound alerts.

-It also incorporates the Parabolic SAR as a new filter for moving average cross signals.
バージョン 1.1 2023.06.28
This new version has minor fixes in the indicator signals.