BBMA Oma Ally Labels
- インディケータ
- Moch Ramdhan
- バージョン: 1.70
- アップデート済み: 26 8月 2023
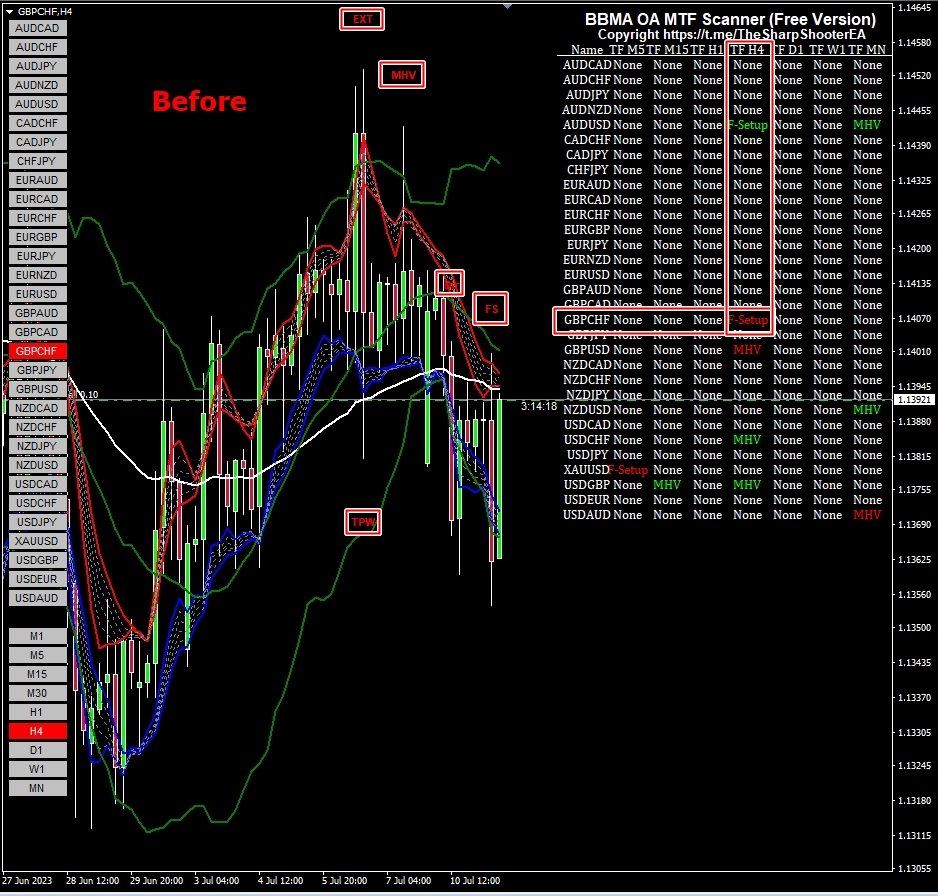
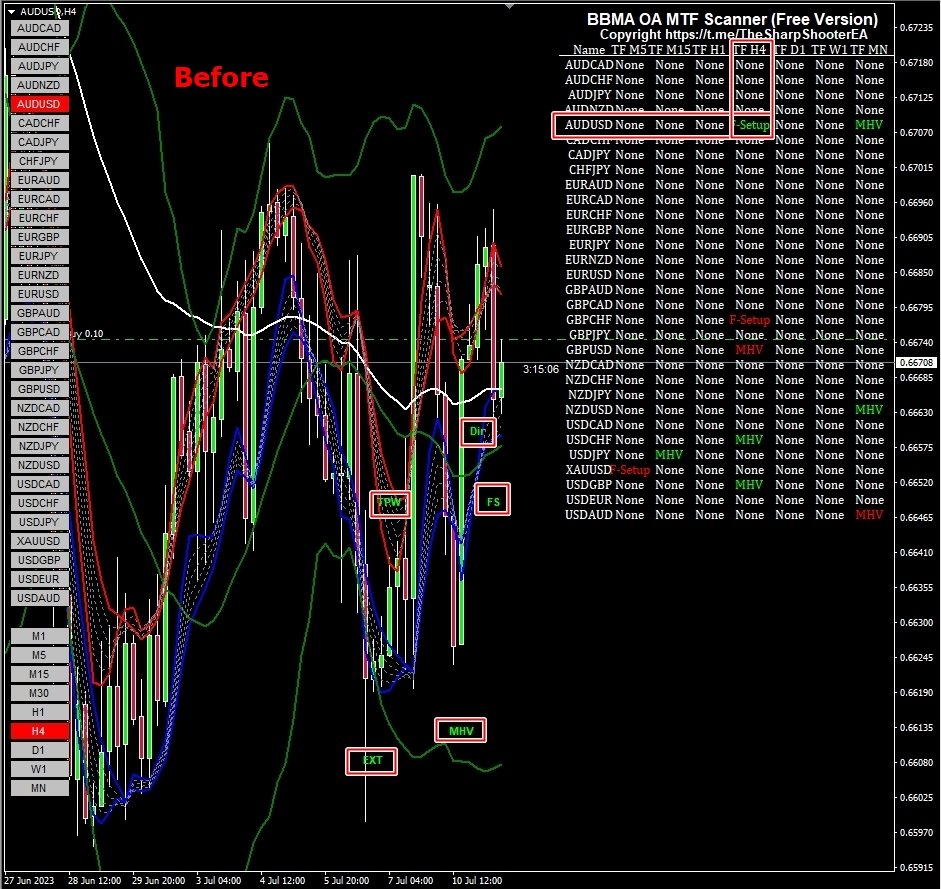
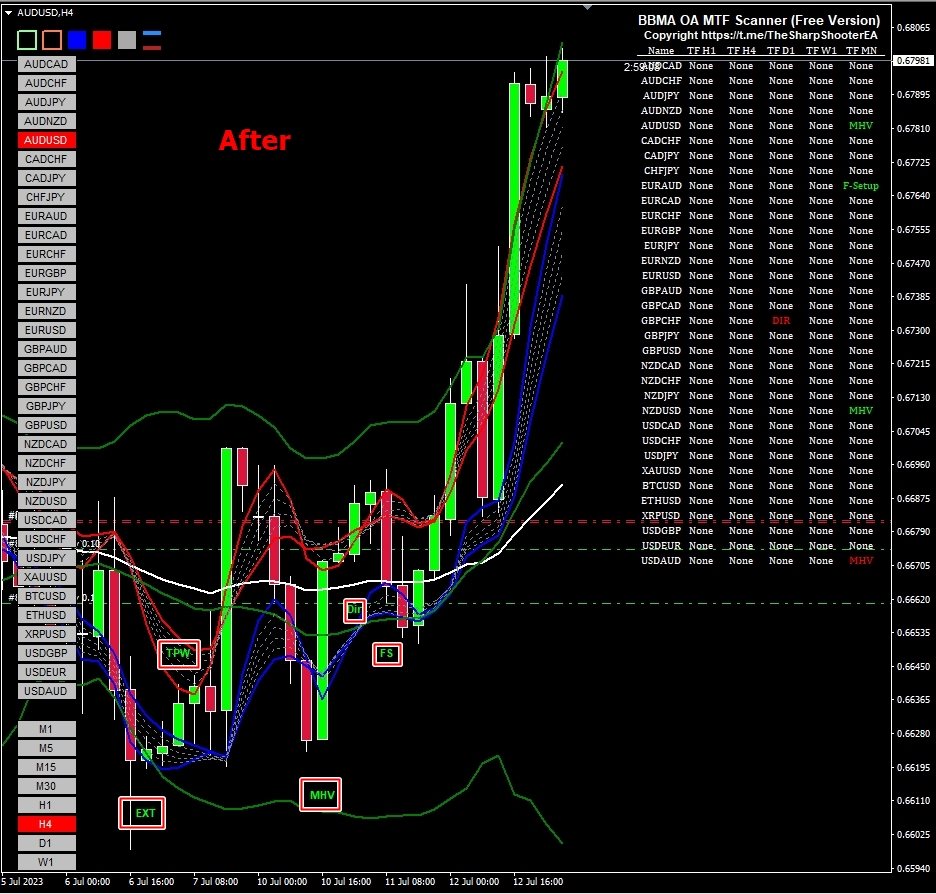
6. Alert & Show labels
BBMA consists of the use of 2 indicators:
- Moving Averages
- Bollinger Bands
BBMA consists of 3 types of entries:
- Extreme
- MHV
- Re-Entry
Moving Average Settings:
There are 5 MAs used in the system:
2 High Moving Averages, 2 Low Moving Averages and 1 Exponential Moving Average.
- MA 5 HIGH
- MA 10 HIGH
- MA5 LOW
- MA10 LOW
- EXPONENTIAL MA 50
Bollinger Band Settings:
Period = 20
Shift = 0
Deviations = 2
Apply to = Close
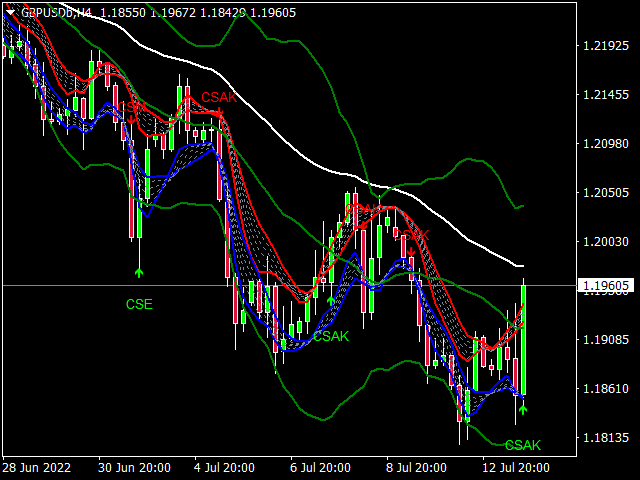
Understanding the Moving Averages:
- Downtrend: MA 5/10 HIGH is above the candles
- MA 5/10 LOW goes through the candles
- MA 10 HIGH is above MA 5 HIGH
- MA 10 LOW is above MA 5 LOW
- Uptrend: MA 5/10 LOW is below the candles
- MA 5/10 HIGH goes through the candles
- MA 5 HIGH is above MA 10 HIGH
- MA 5 LOW is above MA 10 LOW
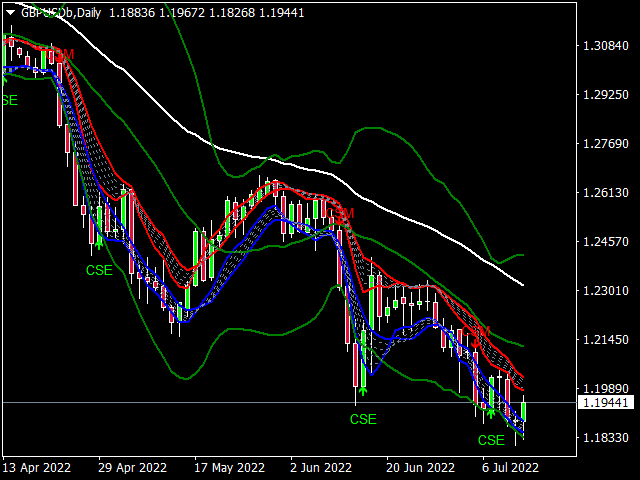
Note :
The above MA are only used to help determine trends use the MA50 on a daily chart to help and get confirmation of the trend. When the market is above the MA50 price is said to be in an uptrend. When the market is below the MA50 price is said to be in a down trend.
MAs can also act as support and resistance.
Understanding Bollinger Bands:
Downtrend: Candles are below the MID BB
Uptrend: Candles are above the MID BB
MID BB: MID BB acts as support and resistance as well.
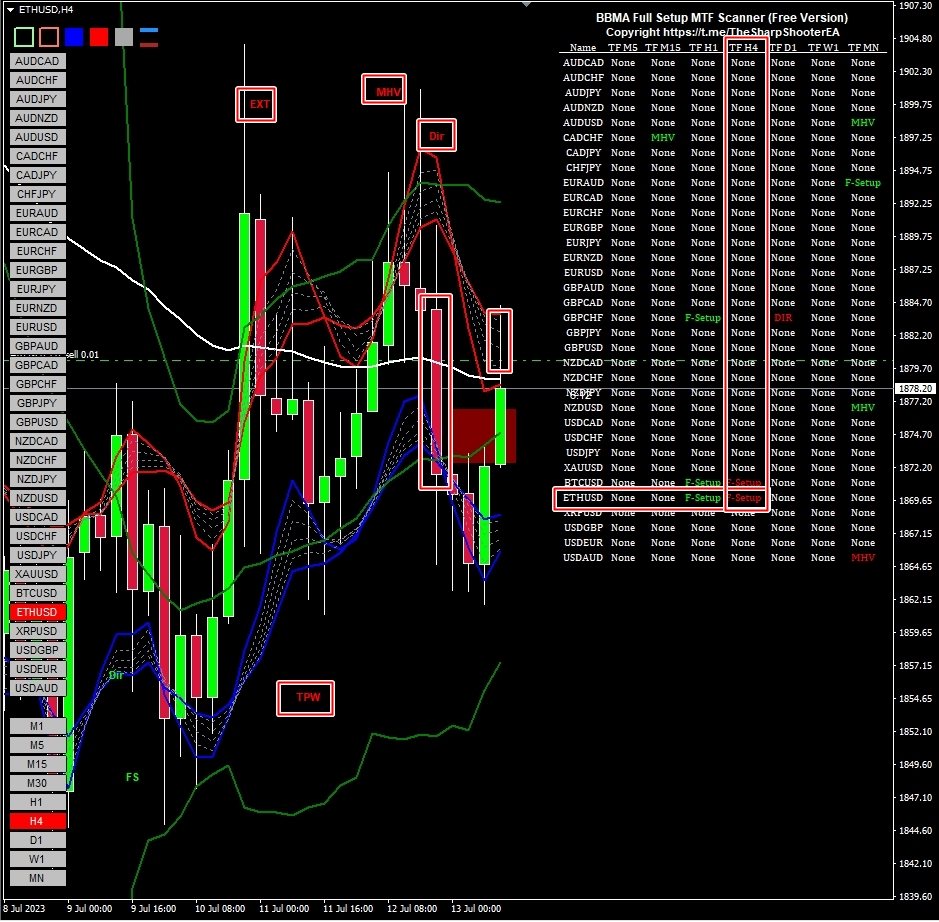
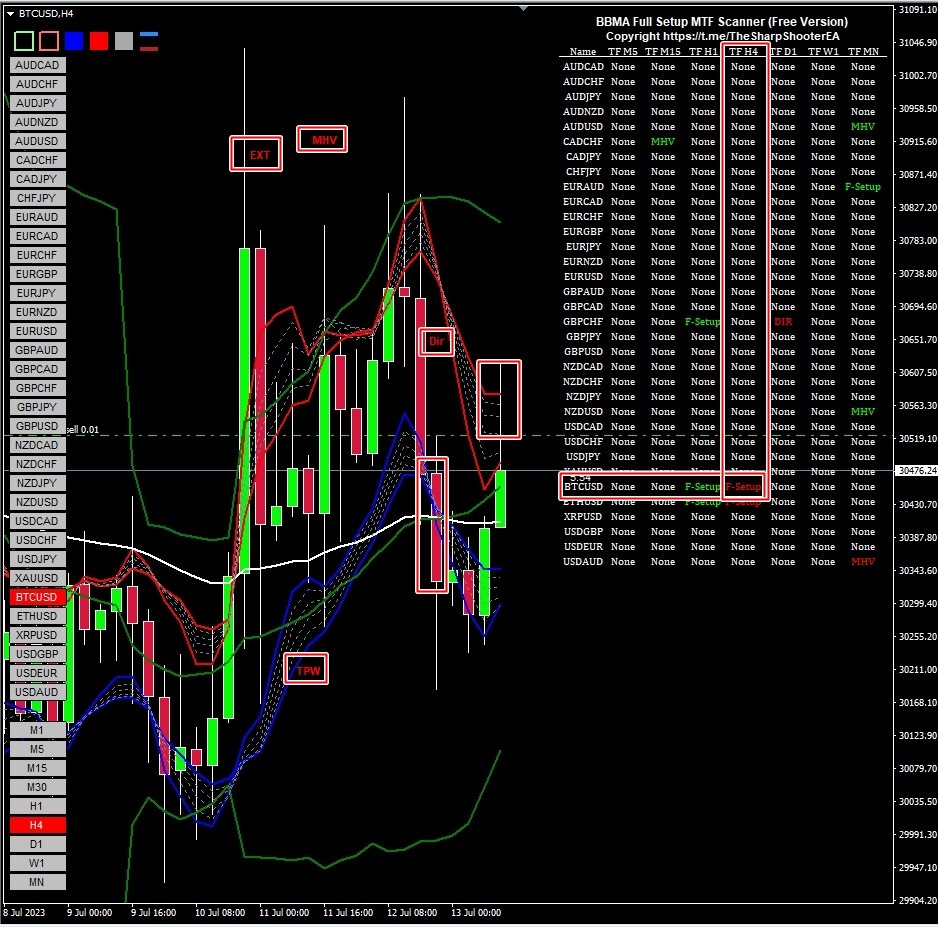
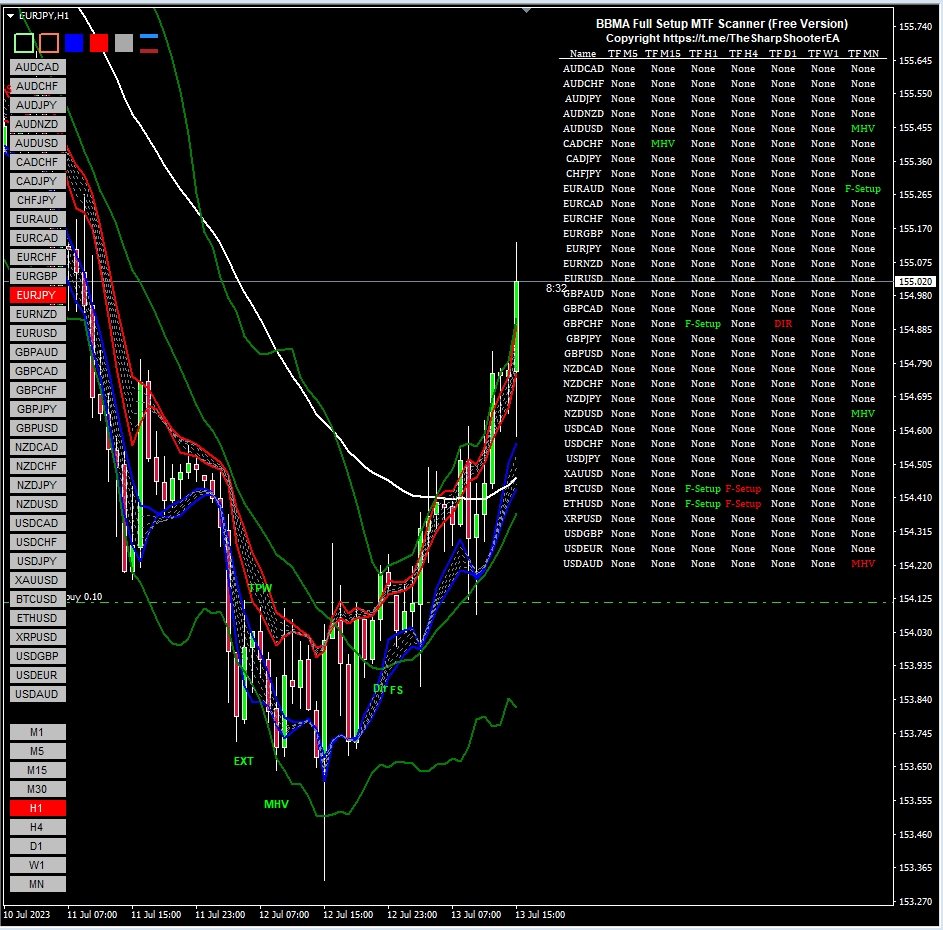
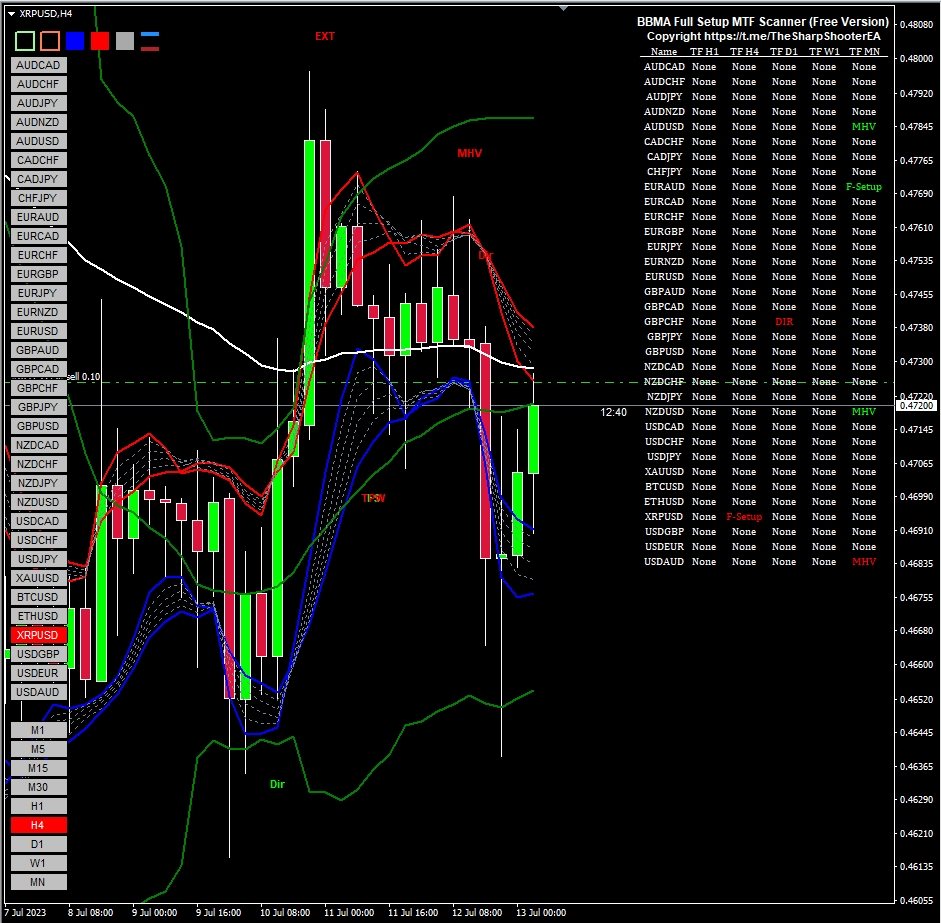
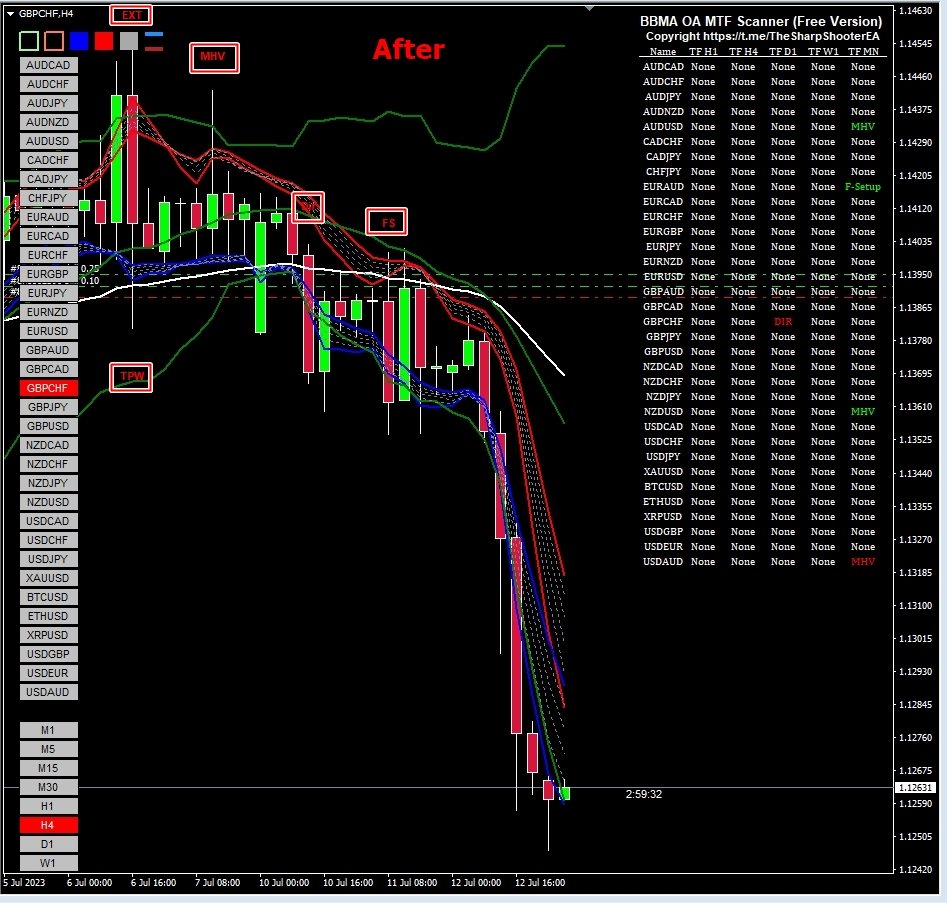
BBMA Entry Types:
- Extreme
- MHV
- Re-Entry
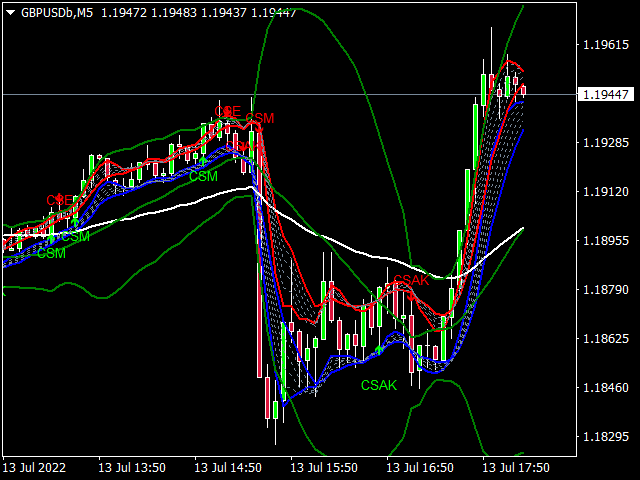
- CS Direction
- CS Momentum
"In-depth knowledge of BBMA Oma Ally strategy is needed"


sangat sangat membantu Kang