Fasb1a
- インディケータ
- Li Qiang Tang
- バージョン: 1.0
- アクティベーション: 5
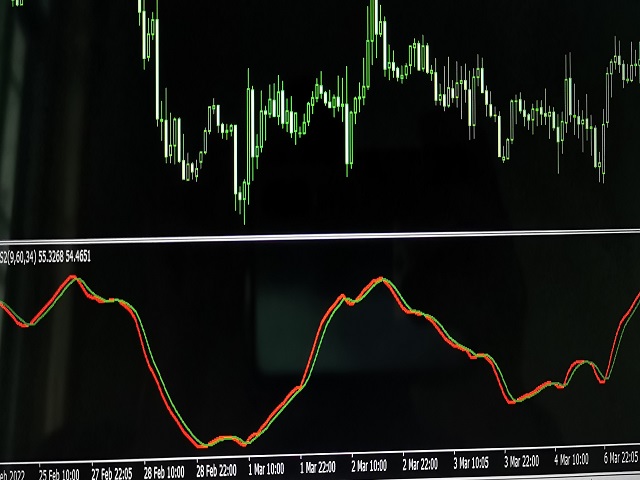
欢迎来到本产品界面
指标,简单可观,直接加载即可,对于趋势有一定的把握及反转。
本指标可在Taxcr EA工具中使用,作为开初始单依据,单次运用,非循环开单!伙伴们可以去了解 axcr EA工具。
IWelcome to the product interface
Indicators, simple and considerable, can be loaded directly, and have a certain grasp and reversal of the trend.
This indicator can be used in Taxcr EA tool as the basis for initial billing, single use, non cyclic billing!