Indicator for binary options arrow is easy to use and does not require configuration works on all currency pairs, cryptocurrencies buy signal blue up arrow sell signal red down arrow tips do not trade during news and 15-30 minutes before their release, as the market is too volatile and there is a lot of noise it is worth entering trades one or two candles from the current period (recommended for 1 candle) timeframe up to m 15 recommended money management fixed lot or fixed percentage of the depo
Power Renko is an indicator which plots Renko bricks underneath the chart using a histogram. You can select the brick size and the timeframe of the Renko bricks as well as whether or not to use the close price or the high/low price of the candles. Renko bricks are based on price alone, not time, therefor the Renko bricks will not be aligned with the chart's time. They are extremely useful for trend trading and many different strategies can be formed from them. Buffers are provided allowing you t
Noize Absorption Index - is the manual trading system that measures the difference of pressure between bears forces and bulls forces. Green line - is a noize free index that showing curent situation. Zero value of index shows totally choppy/flat market.Values above zero level shows how powerfull bullish wave is and values below zero measures bearish forces.Up arrow appears on bearish market when it's ready to reverse, dn arrow appears on weak bullish market, as a result of reverse expectation. S
FX Flow indicator can be used as an anticipator of the next trend, preferably confirmed by Price Action or another oscillator (RSi, Stochastic ..).
It takes the money flows of the major currencies USD EUR GBP AUD NZD CAD CHF JPY into account, and processes them. Excellent tool for indices, but also for correlations between currencies. Works on each timeframes.
Blue line: Bull market Yellow line: Bear market
Note : if the indicator opens the window, but does not draw lines, load the histo
The indicator displays the data of the Stochastic oscillator from a higher timeframe on the chart. The main and signal lines are displayed in a separate window. The stepped response is not smoothed. The indicator is useful for practicing "manual" forex trading strategies, which use the data from several screens with different timeframes of a single symbol. The indicator uses the settings that are identical to the standard ones, and a drop-down list for selecting the timeframe.
Indicator Parame
The indicator detects and displays Shark harmonic pattern (see the screenshot). The pattern is plotted by the extreme values of the ZigZag indicator (included in the resources, no need to install). After detecting the pattern, the indicator notifies of that by a pop-up window, a mobile notification and an email. The indicator highlights the process of the pattern formation and not just the complete pattern. In the former case, it is displayed in the contour triangles. After the pattern is comple
Binary Options Support Resistance Indicator This indicator is designed for binary options trading and effectively shows retracements from support and resistance levels. Signals appear on the current candle. A red arrow pointing downwards indicates a potential selling opportunity, while a blue arrow pointing upwards suggests buying opportunities. All that needs adjustment is the color of the signal arrows. It is recommended to use it on the M1-M5 timeframes as signals are frequent on these timef
The indicator detects and displays 3 Drives harmonic pattern (see the screenshot). The pattern is plotted by the extreme values of the ZigZag indicator (included in the resources, no need to install). After detecting the pattern, the indicator notifies of that by a pop-up window, a mobile notification and an email. The indicator highlights the process of the pattern formation and not just the complete pattern. In the former case, it is displayed in the contour triangles. After the pattern is com
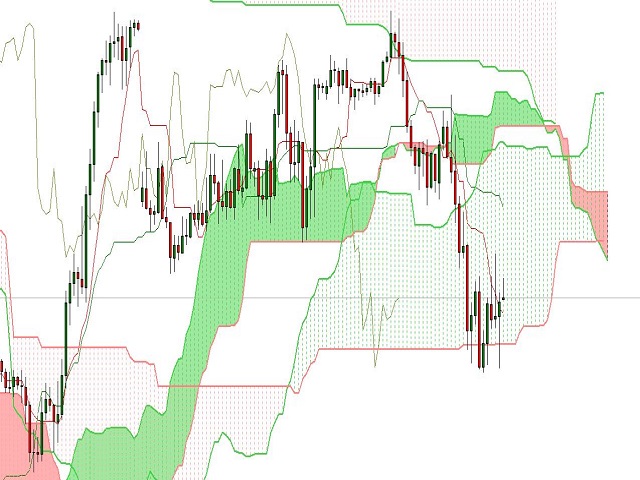
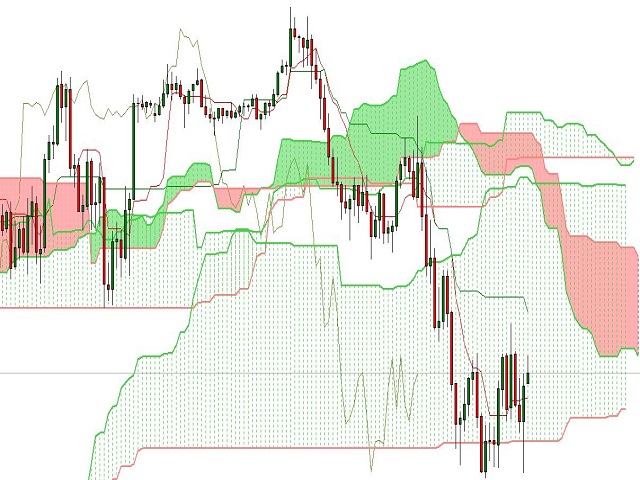
This indicator is based on Ichimoku kynko Hyo but personalized with We-Trading rules.
Ichimoku Trend Arrows As you can see, the indicator shows two types of arrows (signals): Big arrows to follow the big trends Minor arrows to re-enter on trend adding more trades With Ichi-Trend indi, you can follow the trend of the market. You can use it on Forex and on all CFDs and with all the fimeframe you like.
Parameters Main parameters help trader to setup Ichimoku value as: tenkan_sen - default valu
Colored trend indicator advanced is a trend indicator that is based on Fast Moving Average and Slow Moving Average and also uses RSI and Momentum to give a trend strength in percent. It is aimed to find more healthy trends with this indicator. This indicator can be used alone as a trend indicator.
Colors (Default) Green = Uptrend (Default) Red = Downtrend No color = No trend, no good trend
Indicator Parameters WarnPosTrendchange: Warns you when the trend may change. FullColor: See screenshot
GTAS S-Trend is a momentum indicator that helps to determine trends using combination of MACD, RSI and moving averages. This indicator was created by Bernard Prats Desclaux, proprietary trader and ex-hedge fund manager, founder of E-Winvest.
Description The indicator oscillates between -65 and +65 with a neutral zone between -25 and +25 around a 0 equilibrium line. S-Trend between -25 and +25 indicates congestion zones with a bullish bias between 0 and +25, and a bearish bias between 0 and -25
An improved version of the classic Alligator indicator by Bill Williams.
Description The Alligator technical indicator is a combination of moving averages (balance lines). Blue line (Alligator Jaw) is a 13-period smoothed moving average, shifted by 8 bars into the future; Red line (Alligator Teeth) is an 8-period smoothed moving average, shifted by 5 bars into the future; Green line (Alligator Lips) is a 5-period smoothed moving average, shifted by 3 bars into the future; Purple line (Fast Gat
Индикатор DivergenceMRDM ситуацию, когда направление движения цены и технических индикаторов не совпадает. Что можно воспринимать как точки для входа в рынок, точки потенциального разворота рынка. Чаще всего проявляется сигнал при достижении индикатором зоны перекупленности или перепроданности. Один из четырех индикаторов: MACD , RSI , ADX , Momentum . Готовая торговая система. Индикатор не перерисовывается и не запаздывает 95% сделок прибыльные. Работает на всех валютных парах и на всех таймфр
Gvs Undefeated Trend indicator is designed for trend and signal trading. This indicator generates trend signals. It uses many algorithms and indicators to generate this signal. It tries to generate a signal from the points with the highest trend potential. This indicator is a complete trading product. This indicator does not need any additional indicators. You can only trade with this indicator. The generated signals are displayed on the graphical screen. Thanks to the alert features you ca
The presented indicator allows you to determine potential entry points into the market and set protective orders at reasonable levels. This product can be useful for both beginners and experienced traders. The indicator is based on calculation methods proven by time and practicing traders.
The indicator is calculated in two stages: At the first stage, linear regression (LR) of the selected price type is determined for a given number of chart periods. At the second stage, the obtained data is p
StarSwing è un indicatore NO REPAINT che unisce in un unico strumento oscillatori e indicatori di forza. I parametri esterni permettono di bilanciare il peso delle componenti e di regolare a proprio piacimento l'indicatore stesso. StarSwing, graficamente, è composto da segmenti di 2 colori: uno rappresentante il rialzo e uno il ribasso. Il colore non dipende dalla pura direzione del segmento ma dal trend di fondo calcolato dall'indicatore stesso. Sul grafico, si può far disegnare una media mobi
This is a trend indicator without redrawing Developed instead of the binary options strategy (by the color of the Martingale candlestick) Also works well in forex trading When to open trades (binary options) A signal will appear in the place with a candle signaling the current candle It is recommended to open a deal for one candle of the current timeframe M1 and M5 When a blue dot appears, open a deal up When a red dot appears, open a trade down. How to open trades on Forex. When a signal is rec
DYJ Alligator SignalSource is based on Alligator indicator. It can be used for any currency pair and timeframe. The blue line (Alligator's Jaw) is the Balance Line for the timeframe that was used to build the chart (13-period Smoothed Moving Average, moved into the future by 8 bars); Red Line (Alligator's Teeth) is the Balance Line for the value timeframe of one level lower (8-period Smoothed Moving Average, moved by 5 bars into the future); Green Line (Alligator's Lips) is the Balance Line
This Real Magic Trend indicator is designed for signal trading. This indicator generates trend signals.
It uses many algorithms and indicators to generate this signal. It tries to generate signals from the points with the highest trend potential.
This indicator is a complete trading product. This indicator does not need any additional indicators.
The indicator is never repainted. The point at which the signal is given does not change.
Features and Recommendations Time Frame
Tired of choosing indicator settings, losing precious time? Tired of uncertainty in their optimality? Scared by the unknown in their profitability? Then the Trend IM indicator is just for you. The indicator will save you a lot of time that can be spent on more useful activities, such as relaxing, but at the same time, the efficiency will increase many times over. It uses only one parameter for setting, which sets the number of bars for calculation.
Trend IM is a reversal indicator and is part
This indicator displays Stochastic osc signals on the price chart and allows the user to receive notifications of such signals. The Stochastic indicator is a classic and proven indicator of the technical analysis of the markets. Despite its age, it is still relevant today. Depending on the settings, the indicator allows you to work effectively on various TFs and any markets. Signals are given on fully formed bars and are not redrawn.
Custom Parameters: Stochastic_Price (0-1) - The applied pric
The indicator displays the signals of the RSX oscillator on the price chart. (To display these signals in a separate window, along with the oscillator, another indicator is used - RSX Osc 4 AM ). It is optimal to use the indicator signals as signals to open a trade when the price overcomes the maximum or minimum of the bar at which the signal was given. An opposite signal cancels the previous signal.
Settings: Data period for indicator calculation - data period for indicator calculation; Data
TPSpro TRENDPRO - is a trend indicator that automatically analyzes the market and provides information about the trend and each of its changes, as well as giving signals for entering trades without redrawing! The indicator uses each candle, analyzing them separately. referring to different impulses - up or down impulse. Exact entry points into transactions for currencies, crypto, metals, stocks, indices! - Version MT5 DETAILED DESCRIPTION / TRADING SETUPS
SALE NOW! Limited Time Offer! An exclusive indicator that utilizes an innovative algorithm to swiftly and accurately determine the market trend. The indicator automatically calculates opening, closing, and profit levels, providing detailed trading statistics. With these features, you can choose the most appropriate trading instrument for the current market conditions. Additionally, you can easily integrate your own arrow indicators into Scalper Inside Pro to quickly evaluate their statistics and
A key element in trading is zones or levels from which decisions to buy or sell a trading instrument are made. Despite attempts by major players to conceal their presence in the market, they inevitably leave traces. Our task was to learn how to identify these traces and interpret them correctly. Reversal First Impulse levels (RFI) - Version MT5 INSTRUCTIONS RUS ENG R ecommended to use with an indicator -
Break & Retest is unstoppable when combined with our other divergence indicator. After purchase, send us a message and you could get this 2nd indicator for FREE as a BONUS! You can visually backtest Break & Retest to see how it behaved in the past!
Manual guide: Click here
$59 for the first 25 copies ( 4 left)! Next price is $120 .
After many months of hard work and dedication, we are extremely proud to present you our Break and Retest price action indicator crea
note: this indicator is for METATRADER4, if you want the version for METATRADER5 this is the link: TRENDMAESTRO recognizes a new TREND in the bud, he never makes mistakes. The certainty of identifying a new TREND is priceless. DESCRIPTION TRENDMAESTRO identifies a new TREND in the bud, this indicator examines the volatility, volumes and momentum to identify the moment in which there is an explosion of one or more of these data and therefore the moment in which prices have strong probability of f
This indicator is unstoppable when combined with our other indicator called Katana. After purchase, send us a message and you could get Katana for FREE as a BONUS After purchase, send us a private message for your instructions.
MT5 version: click here
3 copies left available at $45. Next price is $99. Don't miss this great deal!
The Trend Forecasting indicator is a very unique & easy tool that is able to make prediction about future price movement based on the signals generated
Thise indicator is up down v6 comes with tradingwiev version. purchased people, after installed on terminal ,contact me on mql5 to get BONUS TradingView version.
up-down indicator is no repaint and works all pairs and lower than weekly time frames charts. it is suitable also 1 m charts for all pairs. and hold long way to signal. dont gives too many signals. when red histogram cross trigger line that is up signal.and price probably will down when blue histogram cross trigger line that is dow
How to use Pair Trading Station Pair Trading Station is recommended for H1 time frame and you can use it for any currency pairs. To generate buy and sell signal, follow few steps below to apply Pair Trading Station to your MetaTrader terminal. When you load Pair Trading Station on your chart, Pair Trading station will assess available historical data in your MetaTrader platforms for each currency pair. On your chart, the amount of historical data available will be displayed for each currency pai
一目のパネルは、すべての時間枠でのさまざまな一目の信号の動作を示すインジケーターです。
システムパラメータ:
てんかんせん:てんかんせんの平均期間。
KIJUN SEN:KijunSenの平均期間。
SENKOU SPAN B:SenkouSpanBの平均期間。
SHOW TENKAN..KIJUN:移動平均TENKANSENとKIJUNSENの交差を示します。
SHOW KIJUN..KUMO:雲または一目の雲に対するkijunsen移動平均の位置を示します。
SHOW CHICOU..KUMO:雲または一目の雲に対する移動平均チクースパンの位置を示します。
SHOW KIJUN:移動平均kijunsenの角度動作を示します。
SHOW CHICOU..PRICE:価格に対するスパンチクーの位置を示します。
SHOW KUMO:未来の雲や雲の気持ちを表現します。
強気の色:強気のシグナルの色。
弱気の色:弱気のシグナルの色。
ニュートラルカラー:ニュートラル信号の色。