Trend direction colored
- インディケータ
- Anton Luik
- バージョン: 1.0
- アクティベーション: 5
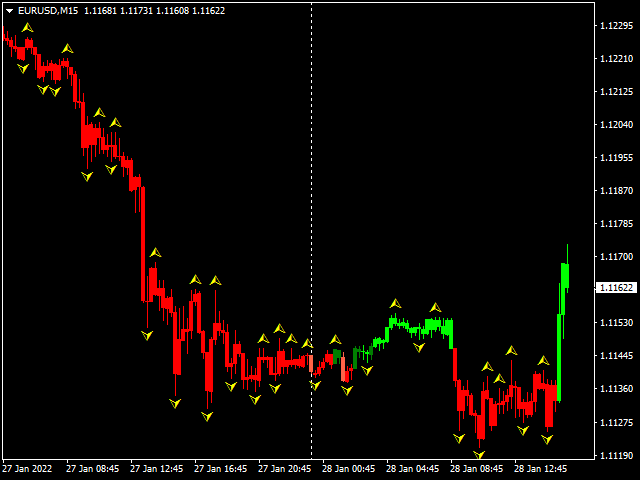
This indicator helps you to build position and profit when market turns in your favor. You will build your full position by trading many small position. If there is green colored candle on the chart, you could add long position. If there is red colored candle on the chart, you could add short position. I personally spread my full size position in to 5-10 small position. I use small target of 2-5 pips on eurusd pair.
ユーザーは評価に対して何もコメントを残しませんでした