• 概要
  • レビュー (1)
  • コメント (2)
  • 最新情報

SharpEntry V1

5

概要を確認する

お知らせ:これは2021年10月11日までのプロモーション価格のみです


SharpEntry version 2.3

- Adjust signals for each Timeframes structure.
- Allow to attach the indicator only Timeframes M1, H1, D1 for a better detection of the signal.
- Resolve a little repaint on a current price.


SharpEntry version 2.0
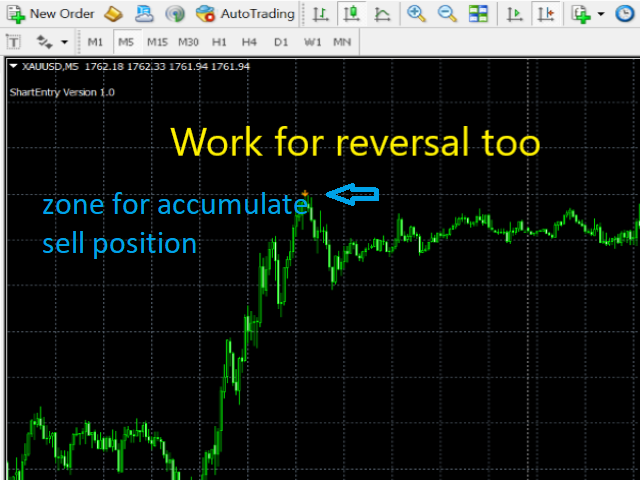
- Support trending mode.
- Increase arrow size.
- Fix arrow icon floating after switch Timeframe.

SharpEntry version 1.1

How does it work?


- The indicator provide a good entry point.

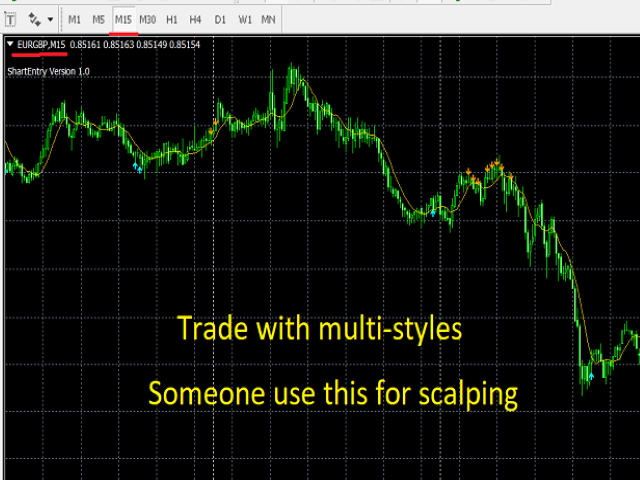
- It's working with all timeframe.

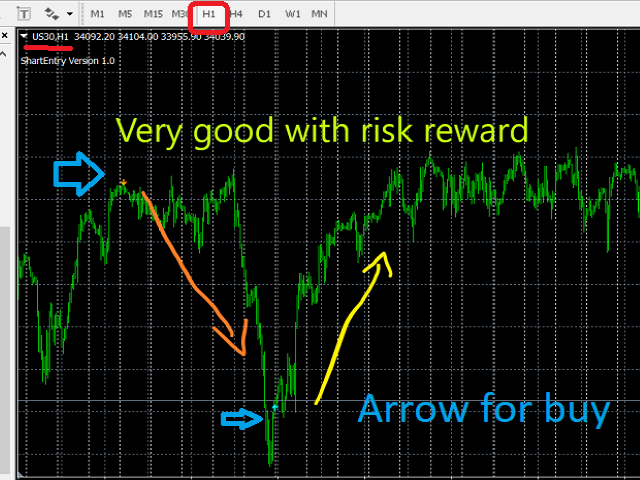
- The indicator will draw the arrow sign for buying and selling.

- Work with all pairs

Advise to use

- Be able to use for scalping with M1 - M5

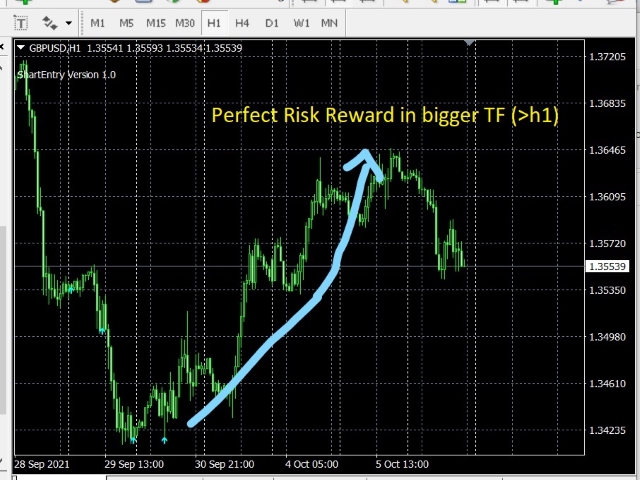
- For bigger timeframe such as H1 - Daily, recommend to do money management e.g, open 1-3 orders ( not much as grid system ) set appropriate SL, but this indicator rather predict well no need wide stop loss.

- Risk reward / suggest at minimum 1:3 to suitable with the indicator.


レビュー 1
Aravind Kolanupaka
8870
Aravind Kolanupaka 2022.01.30 18:48 
 

Good.

おすすめのプロダクト
PipFinite Energy Beam
Karlo Wilson Vendiola
3.94 (17)
Pipfinite creates unique, high quality and affordable trading tools. Our tools may or may not work for you, so we strongly suggest to try the Demo Version for MT4 first. Please test the indicator prior to purchasing to determine if it works for you. We want your good reviews, so hurry up and test it for free...we hope you will find it useful. Combo Energy Beam with Swing Control Strategy: Confirm swing pullback signals Watch Video: (Click Here) Energy Beam with Trend Laser Strategy: Confirm Tr
Was: $249  Now: $99   Market Profile defines a number of day types that can help the trader to determine market behaviour. A key feature is the Value Area, representing the range of price action where 70% of trading took place. Understanding the Value Area can give traders valuable insight into market direction and establish the higher odds trade. It is an excellent addition to any system you may be using. Blahtech Limited presents their Market Profile indicator for the MetaTrader community. Ins
The Market Profile Indicator for MT4 displays the price levels and zones where increased trading activity happens. These zones with substantial forex trading activity provide the forex traders with the best entry levels, support, and resistance levels. Moreover, price levels indicate the best reversal zones. As a result, forex traders can identify BULLISH and BEARISH market trends and BUY and SELL entry points as well as the best reversal points. The indicator works well in all intraday timefram
This indicator is a conventional analytical tool for tick volumes changes. It calculates tick volumes for buys and sells separately, and their delta on every bar, and displays volumes by price clusters (cells) within a specified bar (usually the latest one). The algorithm used internally is the same as in the indicator VolumeDelta , but results are shown as cumulative volume delta bars (candlesticks). Analogous indicator for MetaTrader 5 exists - VolumeDeltaBars . This is a limited substitution
PipFinite Razor Scalper
Karlo Wilson Vendiola
4.44 (50)
Pipfinite creates unique, high quality and affordable trading tools. Our tools may or may not work for you, so we strongly suggest to try the Demo Version for MT4 first. Please test the indicator prior to purchasing to determine if it works for you. We want your good reviews, so hurry up and test it for free...we hope you will find it useful. Combo Razor Scalper with Trend Laser Strategy: Scalp in the direction of the trend Watch Video: (Click Here) Features Scalping indicator using a confir
The Indicator show Daily Pivot Points. It is possible to specify the number of days to display. For forex it doesn't consider the sunday session data. It is possibile to modify the color, style and  width for every level.It is better to use this indicator with timeframe not higher than Н1. 4 Levels of support and resistance with also Intermediate Levels that is possible to hide. Pivot trading: 1.pp pivot 2. r1 r2 r3, s1 s2 s3 Pivot points have been a trading strategy for a long time
Title : Market Bias Indicator - Oscillator-Based Trading Tool Introduction : Discover the potential of the "Market Bias Indicator," a revolutionary oscillator-based trading tool designed for precise market analysis. If you're in search of a robust alternative to traditional bias indicators, your quest ends here. Market Bias Indicator offers unparalleled accuracy in identifying market sentiment and is your gateway to confident trading decisions. Recommended Trading Pairs : Market Bias Indicator i
EZT Trade History This is a great tool to analyze past trades or follow current ongoing trades, especially when you using an EA to manage your transactions. You will see the exact candle where the trade was opened and closed. Collapsible floating panel on the chart, free to move anywhere with your mouse. When you using multiple EA’s with different magic numbers, you have 5 options to separate those trades, so you will know which EA opened specific transactions. You can set the day limits how fa
This indicator scans and displays currency pairs that have recently aligned moving averages on a given timeframe. You can configure which pairs the indicator will scan. It also includes all types of alert options. Bullish MA Alignment =  MA1>MA2>MA3>MA4>MA5 Bearish MA Alignment =  MA1<MA2<MA3<MA4<MA5 Features Attach to one chart and scans all the currency pairs configured and visible in the Market Watch Window It can monitor all the available timeframes from M1 to MN1 and sends alerts on ever
Real-time trend, pricing, and volume details in the corner of the current chart. This indicator displays useful trend, pricing, and volume information in the corner of the current chart. With this indicator, you get real-time market trend, pricing (Ask, Bid, spread, Open, High, Low, change from previous bar Close), and volume (current, High, average). After the indicator is executed, you will see this real-time data in the upper right-hand corner of the chart or an alert indicating that an error
PipFinite Channel Flow
Karlo Wilson Vendiola
4.67 (3)
Pipfinite creates unique, high quality and affordable trading tools. Our tools may or may not work for you, so we strongly suggest to try the Demo Version for MT4 first. Please test the indicator prior to purchasing to determine if it works for you. We want your good reviews, so hurry up and test it for free...we hope you will find it useful. Combo Channel Flow with Strength Meter Strategy: Increase probability by confirming signals with strength Watch Video: (Click Here) Features Detects ch
A technical indicator that calculates its readings on trading volumes. In the form of a histogram, it shows the accumulation of the strength of the movement of the trading instrument. It has independent calculation systems for bullish and bearish directions. Works on any trading instruments and time frames. Can complement any trading system. The indicator does not redraw its values, the signals appear on the current candle. It is easy to use and does not load the chart, does not require additi
This indicator displays the histogram and arrows on chart. When Simple The Best Pro are placed on a chart, they identify the trend.  The color of may be blue or red. The blue color stands for upside moves and the red color stands for downside trends. The indicator offers to set Stop Loss (SL) and  Take Profit (TP)  setting. The default value is ATR. Indicator has automatic optimization. The STB is a unique indicator that shows the tendency (button Bars) of a particular signals. The STB tells us
Time Bubble ***Specialized for GBPJPY 1H time frame*** (tested for two years with success rates about 82%) Time Circle's smart algorithm detects the price circles with time . give strong signals at the right time as result of combine the price and time. our team spent months to develop this indicator specially for GBPJPY ..with high success rates about 82% win trades over two years .tested from December 2016 to November 2018. *** in last two years total signals 1012 with 829 Wins and
Gioteen Volatility Index (GVI)   - your ultimate solution to overcoming market unpredictability and maximizing trading opportunities. This revolutionary indicator helps you in lowering your losing trades due to choppy market movements. The GVI is designed to measure market volatility, providing you with valuable insights to identify the most favorable trading prospects. Its intuitive interface consists of a dynamic red line representing the volatility index, accompanied by blue line that indicat
This indicator displays in a separate window the difference between the number of points which increased the price, and the number of points that decreased the price during the time interval specified in the settings. The time interval for calculation is expressed as the number of bars of the chart the indicator is attached to. This approach allows you to evaluate the movement direction (growth or fall) of the instrument's price, the strength of the movement and the size of the movement in point
Pipfinite creates unique, high quality and affordable trading tools. Our tools may or may not work for you, so we strongly suggest to try the Demo Version for MT4 first. Please test the indicator prior to purchasing to determine if it works for you. We want your good reviews, so hurry up and test it for free...we hope you will find it useful. Attention This trading tool is specifically designed to help grid, martingale, averaging, recovery and hedging strategies. If you are not familiar with t
Volume Confirm Trend Zone is the indicator for filtering sideways and confirm trend to help your system trading. Indicator can use every currency pairs, every time frame, and every broker. You can see trend zone when color to change in volume indicator. Features When the color changes to the blue: Buy Zone is a strong trend. When the color changes to the red: Sell Zone is a strong trend.
Heiken Ashi candle chart is an improved version of The Japanese candle chart, which can effectively filter the market "noise" of the Japanese candle chart. It is favored by many traders for its simplicity and intuition. For trend traders, the HA candle chart is a magic tool. Unlike the traditional Japanese candle chart, Heikenashi does not reflect the opening price, high price, low price and closing price of the market. Instead, Heikenashi calculates the value of a single K line in the dominant
This indicator has been developed to identify and display these trends quickly and easily, allowing you to see instantly, those currency pairs which are trending, and those which are not – and in all timeframes, with just one click. The 28 currency pairs are displayed as a fan as they sweep from strong to weak and back again, and this is why we call it the ‘currency array’. All 28 pairs are arrayed before you, giving an instant visual description of those pairs that are trending strongly, those
PipFinite Swing Control
Karlo Wilson Vendiola
4.2 (5)
Pipfinite creates unique, high quality and affordable trading tools. Our tools may or may not work for you, so we strongly suggest to try the Demo Version for MT4 first. Please test the indicator prior to purchasing to determine if it works for you. We want your good reviews, so hurry up and test it for free...we hope you will find it useful. Combo Swing Control with Energy Beam Strategy: Confirm swing pullback signals Watch Video: (Click Here) Features Detects overall bias and waits for ove
This multi time frame and multi symbol indicator alerts about Heiken Ashi Smoothed color changes. As a bonus it can also scan for Hull Moving Average trend (color) changes. Combined with your own rules and techniques, this indicator will allow you to create (or enhance) your own powerful trading system. Features Can monitor all symbols visible in your Market Watch window at the same time. Apply the indicator to just one chart and instantly monitor the entire market. Can monitor every time frame
We present you the indicator "Candle closing counter", which will become your indispensable assistant in the world of trading. That’s why knowing when the candle will close can help: If you like to trade using candle patterns, you will know when the candle will be closed. This indicator will allow you to check if a known pattern has formed and if there is a possibility of trading. The indicator will help you to prepare for market opening and market closure. You can set a timer to create a p
If you are tired of jumping from chart to chart or loading up a 1000 of currency pairs on restricted MetaTrader 4 terminal to see what are the best trading opportunities out of the Asian Session, then Sessions Indicator Scanner may be the perfect indicator for you. Based on Steve Mauro's Forex training, the Sessions Indicator was developed to scan the entire Forex market at the opening of the London Session and the closing of the Asian Session. This can also be used for those who incorporate bre
今、147ドル(いくつかの更新後に499ドルに増加します) - 無制限のアカウント(PCSまたはMac) RelicusRoad ユーザー マニュアル + トレーニング ビデオ + プライベート Discord グループへのアクセス + VIP ステータス 市場の新しい見方 RelicusRoad は、外国為替、先物、暗号通貨、株式、および指数の世界で最も強力な取引インジケーターであり、トレーダーに収益を維持するために必要なすべての情報とツールを提供します。初心者から上級者まで、すべてのトレーダーが成功するためのテクニカル分析と取引計画を提供します。これは、将来の市場を予測するのに十分な情報を提供する重要な取引指標です。意味をなさないチャート上のいくつかの異なる指標ではなく、完全な解決策を信じています.これは、信号、矢印 + 価格アクション情報を表示するオールインワンのインジケーターで、他に類を見ない非常に正確です。 強力な AI に基づいて、RelicusRoad は不足している情報とツールを提供して、あなたを教育し、トレーディングのプロ、成功したトレーダーにします。
This indicator alerts you when/before new candle bar formed. In other words,this indicator alerts you every 1/5/30/60/240 minutes. This indicator is especially useful for traders who trade when new bars formed. *This indicator don't work propery in strategy tester.Use Free Version to check functionality in live trading. Input Parameters Alert_Or_Sound =Sound ----- Choose alert or sound or both to notify you when new bar is coming. Enable_1mBarAlert ----- Enable alert for 1 min bar dif
Indicator for binary options arrow is easy to use and does not require configuration works on all currency pairs, cryptocurrencies buy signal blue up arrow sell signal red down arrow tips do not trade during news and 15-30 minutes before their release, as the market is too volatile and there is a lot of noise it is worth entering trades one or two candles from the current period (recommended for 1 candle) timeframe up to m 15 recommended money management fixed lot or fixed percentage of the depo
This indicator will draw you strong supply-demand level that we may see some reactions in the market. You can use it from H1 TO M5. Everything is set, you don't need to configure something, all you need is to wait for confirmation entry in lower timeframe like rejection at the zone, engulfing, break of structure... depends on your trading criteria. If the zone failed to hold and the zone is still on the chart, use again confirmation entry once the price came back. enjoys!!!
PipFinite Exit EDGE
Karlo Wilson Vendiola
4.89 (160)
Did You Have A Profitable Trade But Suddenly Reversed? In a solid strategy, exiting a trade is equally important as entering. Exit EDGE helps maximize your current trade profit and avoid turning winning trades to losers. Never Miss An Exit Signal Again Monitor all pairs and timeframes in just 1 chart www.mql5.com/en/blogs/post/726558 How To Trade You can close your open trades as soon as you receive a signal Close your Buy orders if you receive an Exit Buy Signal. Close your Sell orde
Currency Strength Meter is the easiest way to identify strong and weak currencies. The indicator shows the relative strength of 8 major currencies: AUD, CAD, CHF, EUR, GBP, JPY, NZD, USD. By default the strength value is normalised to the range from 0 to 100 for RSI algorithm: The value above 60 means strong currency; The value below 40 means weak currency; The indicator is created and optimized for using it externally at an Expert Advisors or as a Custom Indicator inside your programs. For
このプロダクトを購入した人は以下も購入しています
現在26%オフ 初心者やエキスパートトレーダーに最適なソリューション! このインジケーターは、独自の機能と新しい計算式を取り入れた、ユニークで高品質、かつ手頃な価格のトレーディングツールです。たった1枚のチャートで28の為替ペアの通貨強度を読み取ることができます。新しいトレンドやスキャルピングチャンスの引き金となるポイントを正確に特定することができるので、あなたのトレードがどのように改善されるか想像してみてください。 ユーザーマニュアルはこちら  https://www.mql5.com/en/blogs/post/697384 これが最初の1本、オリジナルだ! 価値のないクローンを買わないでください。 特別な サブウィンドウの矢印で強い通貨の勢いを表示 GAPがあなたのトレードを導く! 基準通貨や気配値が売られすぎ・買われすぎのゾーン(外相フィボナッチレベル)にあるとき、個別チャートのメインウィンドウに警告表示。 通貨がレンジの外側から反落した場合、プルバック/リバーサルのアラート。 クロスパターンの特別なアラート 複数の時間枠を選択可能で、トレンドを素早く
まず第一に、この取引インジケーターは再描画されず、再描画されず、遅延しないことを強調する価値があります。これにより、手動取引とロボット取引の両方に理想的なものになります。 ユーザーマニュアル:設定、入力、戦略。 アトミックアナリストは、価格の強さとモメンタムを利用して市場でより良いエッジを見つけるためのPA価格アクションインジケーターです。ノイズや誤ったシグナルを除去し、取引ポテンシャルを高めるための高度なフィルターを備えています。複雑なインジケーターの複数のレイヤーを使用して、アトミックアナリストはチャートをスキャンし、複雑な数学的計算をシンプルなシグナルと色に変換します。これにより、どのような初心者トレーダーでも理解して使用し、一貫した取引の決定を行うことができます。 「アトミックアナリスト」は、新規および経験豊富なトレーダー向けにカスタマイズされた包括的な取引ソリューションです。プレミアムインジケーターとトップノッチの機能を1つの取引戦略に組み合わせ、すべてのタイプのトレーダーにとって汎用性のある選択肢にします。 デイリートレーディングとスキャルピング戦略:高
Reversal First Impulse levels (RFI)    INSTRUCTIONS        RUS       -       ENG              R ecommended to use with an indicator   -   TREND PRO -  Version MT5 A key element in trading is zones or levels from which decisions to buy or sell a trading instrument are made. Despite attempts by major players to conceal their presence in the market, they inevitably leave traces. Our task was to learn how to identify these traces and interpret them correctly. Main functions: Displaying active zones
An exclusive indicator that utilizes an innovative algorithm to swiftly and accurately determine the market trend. The indicator automatically calculates opening, closing, and profit levels, providing detailed trading statistics. With these features, you can choose the most appropriate trading instrument for the current market conditions. Additionally, you can easily integrate your own arrow indicators into Scalper Inside Pro to quickly evaluate their statistics and profitability. Scalper Inside
Advanced Supply Demand
Bernhard Schweigert
4.92 (312)
現在33%オフ 初心者にもエキスパートトレーダーにも最適なソリューション このインジケーターは独自の機能と新しい公式を多数内蔵しており、ユニークで高品質かつ手頃な取引ツールです。このアップデートでは、2つの時間枠ゾーンを表示できるようになります。より長いTFだけでなく、チャートTFとより長いTF(ネストゾーンを表示)の両方を表示できます。すべてのSupply Demandトレーダーの皆さんのお気に召すはずです。:) 重要情報の公開 Advanced Supply Demandの可能性を最大化するには、 https://www.mql5.com/ja/blogs/post/720245 にアクセスしてください。   エントリーまたはターゲットの正確なトリガーポイントを正確に特定できれば取引がどのように改善されるか想像してみてください。新しい基盤となるアルゴリズムに基づいて構築されているため、買い手と売り手の間の潜在的な不均衡をさらに簡単に特定できます。これは、最も強い需要と供給のゾーンと、過去のパフォーマンス(古いゾーンを表示)がグラフィカルに表現されるためです。これらの機能は、最適
現在20%OFF! 初心者やエキスパートトレーダーのためのベストソリューション! このダッシュボードソフトウェアは、28の通貨ペアで動作しています。それは私達の主要な指標(高度な通貨の強さ28と高度な通貨インパルス)の2に基づいています。それは全体の外国為替市場の大きい概観を与えます。それは、すべての(9)時間枠で28の外国為替ペアのための高度な通貨の強さの値、通貨の動きの速度と信号を示しています。チャート上で1つのインディケータを使用して市場全体を観察し、トレンドやスキャルピングの機会をピンポイントで見つけることができたら、あなたのトレードがどのように改善されるか想像してみてください。 このインディケータには、強い通貨と弱い通貨の識別、潜在的な取引の識別と確認がより簡単になるような機能が搭載されています。このインディケータは、通貨の強さや弱さが増加しているか減少しているか、また、すべての時間枠でどのように機能しているかをグラフィカルに表示します。 新機能として、現在の市場環境の変化に適応するダイナミックなマーケットフィボナッチレベルが追加され、すでに当社のAdvan
TPSpro TRENDPRO  - is a trend indicator that automatically analyzes the market and provides information about the trend and each of its changes, as well as giving signals for entering trades without redrawing! The indicator uses each candle, analyzing them separately. referring to different impulses - up or down impulse. Exact entry points into transactions for currencies, crypto, metals, stocks, indices!  -  Version MT5               DETAILED DESCRIPTION                R ecommended to use with
mql5と Telegramの モーニング・ブリーフィングで、詳細とスクリーンショットを含む毎日のマーケット・アップデートをご覧 ください! FX Power MT4 NGは 、長年の人気を誇る通貨強度計FX Powerの次世代モデルです。 この次世代ストレングスメーターは何を提供するのでしょうか?初代FXパワーの魅力すべて プラス GOLD/XAUの強さ分析 より正確な計算結果 個別に設定可能な分析期間 カスタマイズ可能な計算上限値により、さらに優れたパフォーマンスを実現 もっと見たい人のための特別なマルチインスタンス設定 すべてのチャートでお好みの色を無限に設定可能 数え切れないほどの通知オプションにより、重要なことを見逃すことはありません。 Windows 11とmacOSのスタイルで角を丸くした新しいデザイン 魔法のように動くインジケーターパネル FXパワーの主な機能 すべての主要通貨の強さの完全な履歴 すべての時間枠における通貨の強さの履歴 すべてのブローカーとチャートで同一の計算結果 100%信頼できるリアルタイム計算 -> リペイントなし ドロップダウン・リストから
Volatility Trend System - a trading system that gives signals for entries. The volatility system gives linear and point signals in the direction of the trend, as well as signals to exit it, without redrawing and delays. The trend indicator monitors the direction of the medium-term trend, shows the direction and its change. The signal indicator is based on changes in volatility and shows market entries. The indicator is equipped with several types of alerts. Can be applied to various trading
TakePropips Donchian Trend Pro
Eric John Pajarillaga Aldana
4.82 (17)
TakePropips Donchian Trend Pro   (MT4) は、ドンチャン チャネルを使用してトレンドの方向を自動的に検出し、エントリーとエグジットの取引シグナルを提供する強力で効果的なツールです! この多機能インジケーターには、トレンド スキャナー、取引シグナル、統計パネル、スクリーナー、取引セッション、およびアラート履歴ダッシュボードが含まれます。取引シグナルを提供し、チャートを分析する時間を節約するように設計されています! ユーザー マニュアルとインストール ガイドは、ブログ投稿 (   https://www.mql5.com/en/blogs/post/751368   ) からダウンロードできます。 今日は 50% オフ! 98ドルから49ドルに値下げ! このインジケーターは、ストラテジー テスターでテストできます (ビジュアル モードを有効にします)。 詳細については、説明の下にあるビデオ チュートリアルも利用できます。 ご不明な点やサポートが必要な場合は、私に連絡してください。 TakePropips Donchian Trend Pro イン
NAM Order Blocks
NAM TECH GROUP, CORP.
5 (1)
MT4マルチタイムフレームオーダーブロック検出インジケーター。 特徴 -チャートコントロールパネルで完全にカスタマイズ可能で、完全な相互作用を提供します。 -必要な場所でコントロールパネルを表示および非表示にします。 -複数の時間枠でOBを検出します。 -表示するOBの数量を選択します。 -さまざまなOBユーザーインターフェイス。 -OBのさまざまなフィルター。 -OB近接アラート。 -ADRの高線と低線。 -通知サービス(画面アラート|プッシュ通知)。 概要 注文ブロックは、金融機関や銀行からの注文収集を示す市場行動です。著名な金融機関と中央銀行が外国為替市場を牽引しています。したがって、トレーダーは市場で何をしているのかを知る必要があります。市場が注文ブロックを構築するとき、それは投資決定のほとんどが行われる範囲のように動きます。 注文の構築が完了すると、市場は上向きと下向きの両方に向かって急激に動きます。注文ブロック取引戦略の重要な用語は、機関投資家が行っていることを含むことです。それらは主要な価格ドライバーであるため、機関投
FX Volume
Daniel Stein
4.6 (35)
mql5と Telegramの モーニング・ブリーフィングで、詳細とスクリーンショットを含む毎日のマーケット・アップデートをご覧 ください! FX Volumeは、ブローカーの視点から市場のセンチメントをリアルに洞察する、最初で唯一の出来高インジケーターです。 ブローカーのような機関投資家が外国為替市場でどのようなポジションをとっているか、COTレポートよりもはるかに速く、素晴らしい洞察を提供します。 この情報をチャート上で直接見ることは、あなたの取引にとって真のゲームチェンジャーであり、画期的なソリューションです。 以下のようなユニークなマーケットデータ洞察から利益を得てください。 比率は 、通貨のロングポジションとショートポジションの比率をパーセントで表示します。 比率の変化は 、選択した期間内のロング比率とその変化率を表示します。 Volumes Totalは 、通貨の取引量(ロングとショート)の合計をロット単位で表示します。 Volumes Long :全通貨のロングポジションの取引量を表示します。 Volumes(ショート )は、全通貨のショートポジションの取引量を表示
BullseyeSignal – NoRepaint は、名前が示すように、いかなる状況でも再描画されないシグナルです。シグナルは画像に表示された同じローソク足に表示されます。外為、暗号通貨、株式、指数、先物などの高ボラティリティ市場に最適です。 購入には緑の矢印、販売には赤の矢印のみが表示されますが、その背後にはより簡潔な取引体験を提供するために多くの指標が協力しています。 これは正確なエントリーを提供するために特別に設計されています。 多くのエントリーではなく、指標がトレンドの変化を示し、前のトレンドの反対方向に0レベルを超えたときに特定のエントリーを提供します。より正確な取引を実現するために、指標はトレンドの変化を確認するために最初のプルバックを待ち、偽の逆転を回避します。したがって、前のトレンドのブレイクとプルバックの確認後にシグナルが発行されます。 これは非常に慎重な取引アプローチです。 したがって、これらのヒントに従うことが重要です(初心者および上級トレーダーの両方がこの戦略を使用できます): ニューヨーク、ロンドン、または両市場の重複を使用することをお勧めします。
現在31%オフ! 初心者やエキスパートトレーダーに最適なソリューション! このインジケータは、独自の機能と秘密の数式を組み込んだ、ユニークで高品質かつ手頃な価格のトレーディングツールです。たった1枚のチャートで28の通貨ペアのアラートを表示します。新しいトレンドやスキャルピングチャンスの引き金となるポイントを正確に把握することができるので、あなたのトレードがどのように改善されるか想像してみてください! 新しい基本的なアルゴリズムに基づいて構築されているため、潜在的な取引の特定と確認がより簡単になります。これは、通貨の強さや弱さが加速しているかどうかをグラフィカルに表示し、その加速のスピードを測定するためです。加速すると物事は明らかに速く進みますが、これはFX市場でも同じです。つまり、反対方向に加速している通貨をペアにすれば、利益を生む可能性のある取引を特定することができるのです。 通貨の勢いを示す縦の線と矢印は、あなたの取引の指針となるでしょう。 ダイナミックマーケットフィボナッチ23レベルはアラートトリガーとして使用され、市場の動きに適応します。もしインパルスが黄色
TrendMaestro
Stefano Frisetti
5 (3)
note: this indicator is for METATRADER4, if you want the version for METATRADER5 this is the link:  https://www.mql5.com/it/market/product/108106 TRENDMAESTRO ver 2.4 TRENDMAESTRO recognizes a new TREND in the bud, he never makes mistakes. The certainty of identifying a new TREND is priceless. DESCRIPTION TRENDMAESTRO identifies a new TREND in the bud, this indicator examines the volatility, volumes and momentum to identify the moment in which there is an explosion of one or more of these data a
このダッシュボードは、選択されたシンボルの最新の利用可能なハーモニックパターンを表示するので、時間を節約し、より効率的に / MT5バージョン 。 無料インジケーター: Basic Harmonic Pattern インジケーター列 Symbol : 選択したシンボルが表示されます。 Trend : 強気または弱気 Pattern : パターンの種類(ガートレー、バタフライ、バット、カニ、サメ、サイファー、ABCD) Entry : エントリー価格 SL: ストップロス価格 TP1: 1回目の利食い価格 TP2: 2回目の利食い価格 TP3: 3回目の利食い価格 Current price : 現在値 Age (in bars):  最後に描画されたパターンの年齢 主な入力項目 Symbols: "28 Major Currency Pairs "または "Selected Symbols "から選択。 Selected Symbols: カンマで区切られた監視したいシンボル("EURUSD,GBPUSD,XAUUSD")。ブローカーがペアに接尾辞または接頭辞を付けて
The Volume by Price Indicator for MetaTrader 4 features Volume Profile and Market Profile TPO (Time Price Opportunity). Volume and TPO histogram bar and line charts. Volume Footprint charts. TPO letter and block marker collapsed and split structure charts. Session filtering and grouping. Static, dynamic and flexible range segmentation and compositing methods with relative and absolute visualizations. Graphical layering, positioning and styling options to suit the user's analytic and aesthetic n
Thise indicator is up down v6  comes with tradingwiev pinescript. purchased people, after installed on terminal ,contact me on mql5  to get BONUS  TradingView pinescript. up-down indicator is no repaint and works all pairs and lower than weekly time frames charts. it is suitable also 1 m charts for all pairs. and hold long way to signal. dont gives too many signals. when red histogram cross trigger line that is up signal.and price probably will down when blue histogram cross trigger line that
MTF Supply Demand Zones
Georgios Kalomoiropoulos
4.83 (23)
次世代の自動化された需要と供給のゾーン。どのチャートでも機能する新しい革新的なアルゴリズム。すべてのゾーンは、市場の価格行動に従って動的に作成されています。 2種類のアラート --> 1) 価格がゾーンに達したとき 2) 新しいゾーンが形成されたとき もう 1 つの役に立たない指標はありません。実績のある完全な取引戦略を手に入れることができます。     新機能:     価格が需給ゾーンに達したときにアラートを出す     新しい需給ゾーンが作成されたときにアラートを発します     プッシュ通知アラート     ピップ単位のゾーン幅ラベル     MTF のもう 1 つのタイムフレーム。したがって、現在より 2 時間足高いのではなく、現在より 3 時間足し上に見えるようになります。     アラート/ゾーン/MTF 機能を有効/無効にするボタン あなたが得る利点:     取引から感情を取り除きます。     取引エントリをオブジェクト化します。     確率の高いセットアップで利益
このインディケータは、当社の2つの製品 Advanced Currency IMPULSE with ALERT  +   Currency Strength Exotics . のスーパーコンビネーションです。 このインジケーターは全ての時間枠で作動し、8つの主要通貨と1つのシンボルの強弱のインパルスをグラフで表示します。 このインジケータは、金、エキゾチックペア、商品、インデックス、先物など、あらゆるシンボルの通貨強度の加速度を表示することに特化されています。金、銀、原油、DAX、US30、MXN、TRY、CNHなどの通貨強度の加速度(インパルスまたは速度)を表示するために、任意のシンボルを9行目に追加できる、この種の最初のものです。 新しいアルゴリズムに基づいて構築され、潜在的な取引の特定と確認がさらに容易になりました。これは、通貨の強さや弱さが加速しているかどうかをグラフィカルに表示し、その加速の速度を測定するためです。加速すると物事は明らかに速く進みますが、これはFX市場でも同じです。つまり、反対方向に加速している通貨をペアリングすれば、潜在的に利益を生む取
の紹介     Quantum平均足PRO チャート 市場のトレンドに対する明確な洞察を提供するように設計された平均足キャンドルは、ノイズを除去し、誤ったシグナルを排除する能力で知られています。混乱を招く価格変動に別れを告げ、よりスムーズで信頼性の高いチャート表現を導入しましょう。 Quantum Heiken Ashi PRO を真にユニークなものにしているのは、従来のローソク足データを読みやすい色のバーに変換する革新的なフォーミュラです。赤と緑のバーはそれぞれ弱気トレンドと強気トレンドをエレガントに強調し、潜在的なエントリーポイントとエグジットポイントを驚くほど正確に見つけることができます。 量子EAチャネル:       ここをクリック MT5のバージョン:       ここをクリック この注目すべき指標には、いくつかの重要な利点があります。 明確性の向上: 価格変動を平滑化することで、平均足バーは市場トレンドをより明確に表現し、有利な取引機会を特定しやすくします。 ノイズの削減: 誤ったシグナルを引き起こすことが多い不安定な価格変動に別れを告げます。 Quan
Indicator : RealValueIndicator Description : RealValueIndicator is a powerful tool designed specifically for trading on the EURUSD pair. This indicator analyzes all EUR and USD pairs, calculates their real currency strength values, and displays them as a single realistic value to give you a head start on price. This indicator will tell you moves before they happen if you use it right. RealValueIndicator allows you to get a quick and accurate overview of the EURUSD currency pair tops and bottoms,
The All-in-One Trade Indicator (AOTI) determines daily targets for EURUSD, EURJPY, GBPUSD, USDCHF, EURGBP, EURCAD, EURAUD, AUDJPY, GBPAUD, GBPCAD, GBPCHF, GBPJPY, AUDUSD, and USDJPY. All other modules work with any trading instruments. The indicator includes various features, such as Double Channel trend direction, Price channel, MA Bands, Fibo levels, Climax Bar detection, and others. The AOTI indicator is based on several trading strategies, and created to simplify market analysis. All-in-One
ご紹介   クォンタム トレンド スナイパー インジケーターは 、トレンド反転を特定して取引する方法を変革する画期的な MQL5 インジケーターです。 13年以上の取引経験を持つ経験豊富なトレーダーのチームによって開発されました。     クォンタムトレンドスナイパーインジケーター   は、非常に高い精度でトレンドの反転を識別する革新的な方法で、あなたのトレーディングの旅を新たな高みに押し上げるように設計されています。 ***Quantum Trend Sniper Indicatorを購入すると、Quantum Breakout Indicatorを無料で入手できます!*** クォンタム ブレイクアウト インジケーターは、トレンドの反転を特定するとアラートを発し、矢印を示し、3 つのテイクプロフィットレベルを提案します。 初心者トレーダーにもプロのトレーダーにも適しています。 量子EAチャネル:       ここをクリック MT5のバージョン:       ここをクリック 推奨事項: 期間: すべての時間枠。最良の結果を得るには、
トレンドトレーディング は、タイミングのプルバックとブレイクアウトにより、市場で起こっているトレンドから可能な限り利益を得るように設計された指標です。確立されたトレンドの中で価格が何をしているかを分析することにより、取引の機会を見つけます。 [ インストールガイド | 更新ガイド | トラブルシューティング | よくある質問 | すべての製品 ] 自信を持って効率的に金融市場を取引する むち打ちにならずに確立されたトレンドから利益を得る 収益性の高いプルバック、ブレイクアウト、早期の逆転を認識する この指標は、独自の品質とパフォーマンスを分析します 複数時間枠のダッシュボードを実装します インジケーターは再描画されていません 電子メール/音声/視覚アラートを実装します 確立されたトレンドは多くの取引機会を提供しますが、ほとんどのトレンド指標はそれらを完全に無視しています。インジケーターの解釈はかなり簡単です: (1) トレンドの変化 (2) トレンドの方向への後退 (3) トレンドの方向へのブレイクアウト 赤いダッシュ は下降トレンド中の修正です 青いダッシュ は上昇ト
Enigmera
Ivan Stefanov
5 (2)
エニグメラ:市場の中核 https://www.enigmera.com はじめに このインディケータと取引システムは、金融市場に対する驚くべきアプローチです。ENIGMERAは、フラクタルサイクルを使用して、サポートとレジスタンスレベルを正確に計算します。本格的な蓄積局面を示し、方向性と目標を示します。 トレンド中でも調整中でも機能するシステムです。 どのように作動するのか? ENIGMERAは、支持線・抵抗線、目標線、乖離線の3つのラインで構成されています。このシステムは、過去のデータを現在と未来に外挿する典型的な市場指標とは異なり、現在の完全な画像を提供します。支持線上にある場合、それは本当の支持を意味し、抵抗線上にある場合、それは本当の抵抗を意味する。ある水準が破られた場合、それはトレンドの変化を意味する。再描画はしない。 市場は常に進化しているため、ENIGMERAはその評価ツールを適応させ、定期的に戦略を修正しています。  これにより、すべてのシナリオが徹底的に評価されることが保証されます。この市場指標の独自性は、その能力を見れば明らかです。  ENIGM
これはMT4のインジケーターで、再描画なしで取引に参入するための正確なシグナルを提供します。 外国為替、暗号通貨、金属、株式、インデックスなど、あらゆる金融資産に適用できます。かなり正確な見積もりを提供し、取引を開始して終了するのに最適な時期を教えてくれます。1つのシグナルを処理しただけでインジケーターの元が取れた例の 動画 (6:22)をご覧ください。Entry PointsPro インジケーターの助けを借りたほとんどのトレーダーの最初の1週間の結果が改善しています。 Telegramグループ に登録してください。Entry Points Proインジケーターのメリットは次の通りです。 再描画のないエントリーシグナル 再描画されるインジケーターでは一度表示されたシグナルが削除されて大きな金銭的損失につながることがありますが、これと異なり、表示されて確認されたシグナルは消えることがありません。 エラーなしの取引開始 インジケーターアルゴリズムによって取引を開始する(資産を売買する)理想的な瞬間を見つけることができます。それを使用するすべてのトレーダーの成功率が向上します。
This indicator is based on the mathematics of the great trader W.D. Ganna. With its help, you can easily find strong levels by analyzing swings to find the optimal entry point. The indicator works on all instruments and all timeframes. The indicator is fully manual and has control buttons. All you need to do is press the NEW button, a segment will appear, which you can place on any movement, swing or even 1 candle that you want to analyze. By placing the segment, press the OK button. A grid (th
ご紹介     Quantum Breakout PRO は 、ブレイクアウト ゾーンの取引方法を変革する画期的な MQL5 インジケーターです。 13年以上の取引経験を持つ経験豊富なトレーダーのチームによって開発された Quantum Breakout PROは 、革新的でダイナミックなブレイクアウトゾーン戦略により、あなたの取引の旅を新たな高みに押し上げるように設計されています。 クォンタム ブレイクアウト インジケーターは、5 つの利益ターゲット ゾーンを備えたブレイクアウト ゾーン上のシグナル矢印と、ブレイクアウト ボックスに基づいたストップロスの提案を提供します。 初心者トレーダーにもプロのトレーダーにも適しています。 量子EAチャネル:       ここをクリック MT5バージョン:   ここをクリック 重要!購入後、インストールマニュアルを受け取るためにプライベートメッセージを送ってください。 推奨事項: 時間枠: M15 通貨ペア: GBPJPY、EURJPY、USDJPY、NZDUSD、XAUUSD アカウントの種類: ECN、Raw、また
Royal Wave Pro M4
Vahidreza Heidar Gholami
5 (3)
Royal Wave is a Trend-Power oscillator which has been programmed to locate and signal low-risk entry and exit zones. Its core algorithm statistically analyzes the market and generates trading signals for overbought, oversold and low volatile areas. By using a well-designed alerting system, this indicator makes it easier to make proper decisions regarding where to enter and where to exit trades. Features Trend-Power Algorithm Low risk Entry Zones and Exit Zones Predictions for Overbought and Over
作者のその他のプロダクト
Multi ATR
Mr Ittiphol Pudkrajang
5 (1)
複数の時間枠でATR値を表示するシンプルなダッシュボード。どの時間枠でもクリックする必要はなく、ATRの概要をすばやく確認できます。 ATR期間の値の変更をサポートします。 無料ダウンロード! すでにStrategyTesterでテストしましたが、何も問題はありません。 何か問題を見つけた場合は、下のコメントをドロップするか、サイトで私に連絡してください:http:// www.thanksmybot.com メール:gmail@thanksmybot.com IQ Option Robotなどのソフトウェアで私たちをサポートしていただければ幸いです/そしてMQL4市場でも私たちをサポートしてください>> Forex EA、ForexIndicator。 ============================== 別の指標:https:// www.mql5.com/en/market/product/72859 !! お勧め !!
FREE
NotifyMaCross
Mr Ittiphol Pudkrajang
4 (2)
Moving average cross over notification ! How to use Add NotifyMaCross indicator into the chart. Set Moving average line one and two. Wait the notification when moving average cross over Support for development : https://www.buymeacoffee.com/itwetrade Check out all indicator and expert advisor here https://www.mql5.com/en/users/thanksmybot/seller ------------------------------------- Como usar     Adicione o indicador NotifyMaCross ao gráfico.     Defina a linha média móvel um e dois.   
FREE
Have you ever lost your mind? Cause you open multiple positions try to revenge the market or sometime open double, triple position to maximize the profit? if you are win it is okay, but how about if you lose? So "MaxOrdersWarning" may remind your consciousness not to open too many orders in the same time. How to use - Drag and drop Indicator on your chart. - Set the limitation number of your position ( per Chart Symbol that you open ) Then what's next? If you reaches the limit, the backgro
FREE
フィルタ:
Aravind Kolanupaka
8870
Aravind Kolanupaka 2022.01.30 18:48 
 

Good.

Mr Ittiphol Pudkrajang
1196
開発者からの返信 Mr Ittiphol Pudkrajang 2022.11.02 09:09
Thanks so much for the review.
レビューに返信
バージョン 2.3 2023.05.30
- Fix tiny bugs.
- Specified user to run on Timeframes M1, H1, D1 pattern only.
- Changed pattern of bigger TF to be dynamic pattern.
バージョン 2.1 2023.05.24
- Update tiny input bugs
バージョン 2.0 2023.05.24
- Support trending mode.
- Increase arrow sizes.
- Fixed arrow icon floating while changing Timeframe.
バージョン 1.1 2021.10.07
Change text