Alert Everything ToolBox divergence Moving Cross
- インディケータ
- Mohammadhossein Yoosefiizad
- バージョン: 1.2
- アップデート済み: 10 9月 2021
- アクティベーション: 10
NEXT PRICE 99$
Alert Everything ToolBox divergence And Moving Cross:
| Buy "ALERT EVERYTHING" at 99$ and receive 1 EA for free (* for ONE trade accounts) THIS EA IS GIFT : https://www.mql5.com/en/market/product/63710 |
|---|
1. 4 Moving Average Cross Alert.
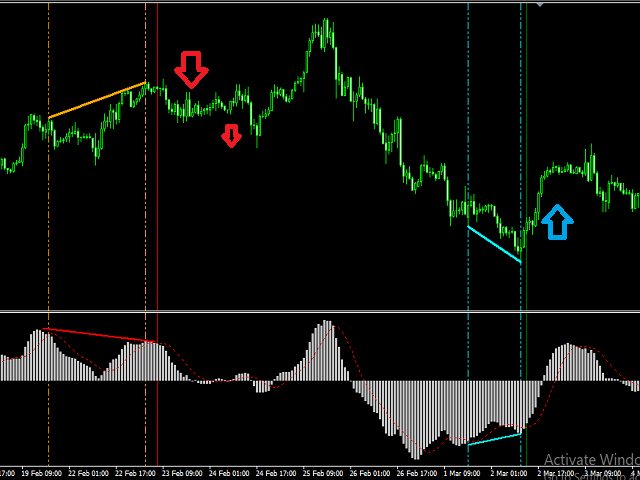
2. MACD divergence Alert
3. Indicators Alerting( ICHIMUKO /RSI/CCI/MACD/STOCH)
4. Pattern Alert
5. Draw Daily Support / Resistance
6. Display Some information on chart.
| If you need help : My Email : Money.transporter@gmail.com Telegram : https://t.me/ForexGoldenRoad |
|---|
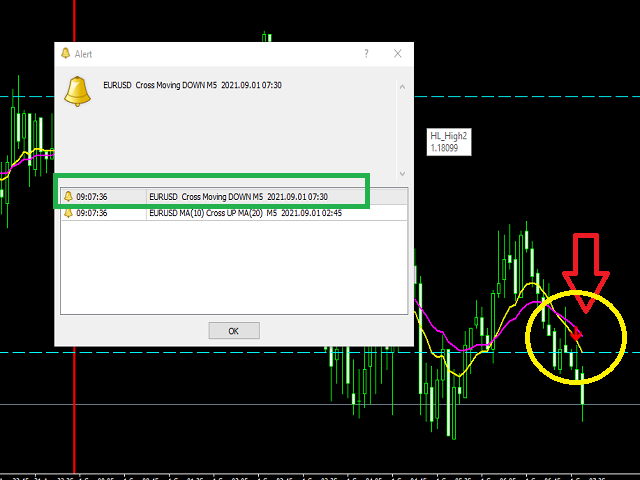
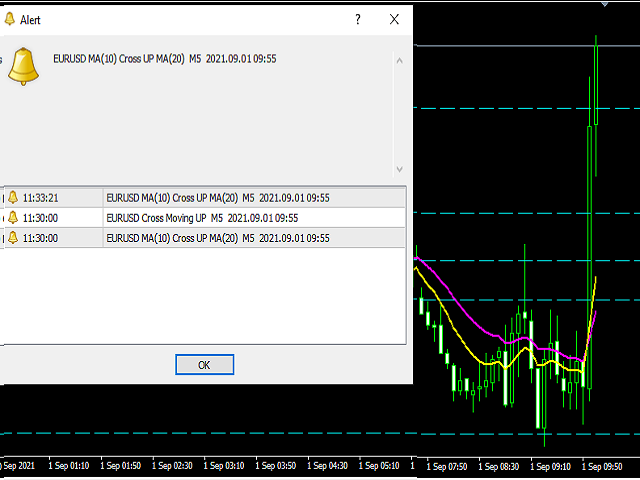
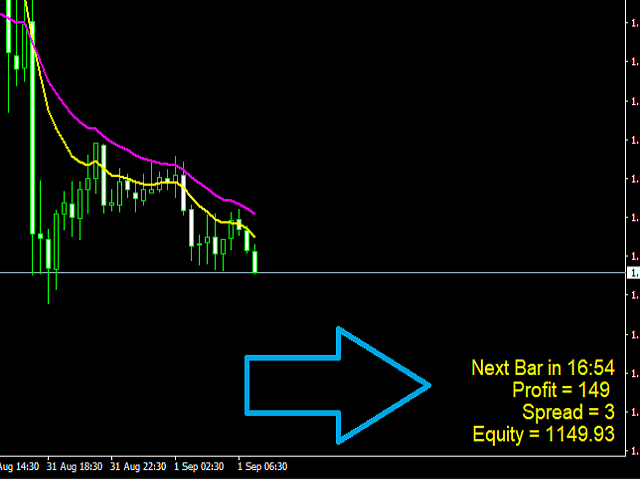
- Moving average Cross is considered as a signal to detect the trend, in this indicator it is possible to activate four moving average lines simultaneously, whose intersection with each other is displayed by the message box and with an arrow. If only one moving average is activated, the intersection of that line with the candlestick is considered.
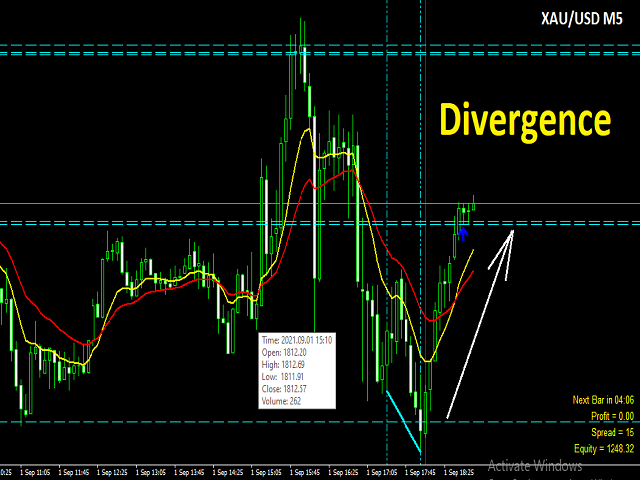
- Divergence: Divergence means changing the situation and one of the ways to identify a change in market direction at the end of the process is by identifying Divergence . In this set, it is possible to activate the ability to identify MACD divergence in all time frames, and of course, it is better to check the other conditions for entering and confirming the Position in order to enter the position.
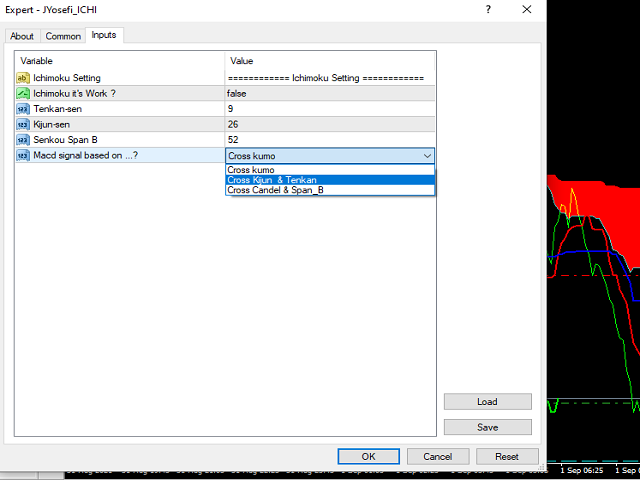
- Indicator Alerts: Indicators crossing a certain value level can be important to us as it needs to be alerted. In this set, we have included a number of indicators( ICHIMOKU , Rsi , CCI , MACD , Stochastic ), the most important of which is the Ichimoku indicator, which can warn in the following three situations: 1- Changing the phase of the KUMO cloud from Down Kumo to UP Kumo and vice versa. 2- Intersection(Cross) of Tenkan-sen and Kijun-sen lines. 3- Intersection of CANDLE and Span B surface.
- Ability to identify "Hammer", "Shooting Star" and "Engulf" patterns.
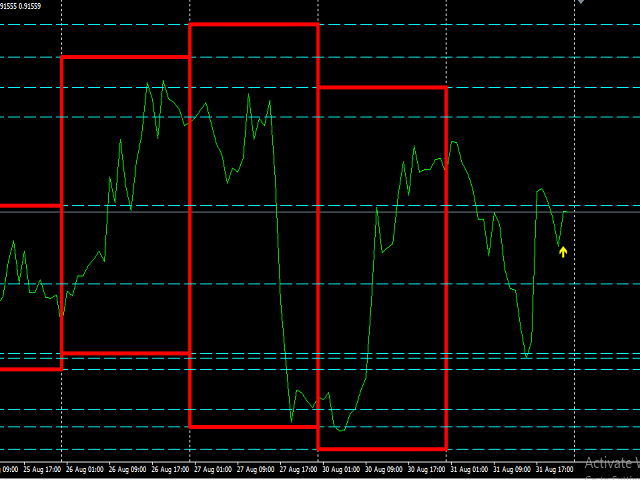
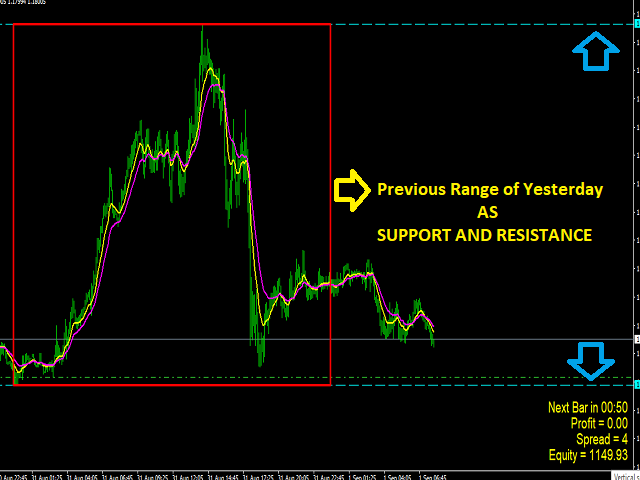
- Ability to draw daily support and resistance lines: In this collection, it is possible to draw HIGH and LOW lines for many days for any desired period of time and use their Role in Position . The daily HIGH and LOW lines are used as support and resistance lines and can be used in their strategy either separately or in combination.
- Display information on the chart: In this set, information such as "Equity", "Spread", "Remaining time until the closing of the candle" and "Floating profit" are displayed on the chart.