Real NonRePaint MultiTimeFrame Heiken Ashi
- インディケータ
- Aleksandr Martynov
- バージョン: 1.0
- アクティベーション: 9
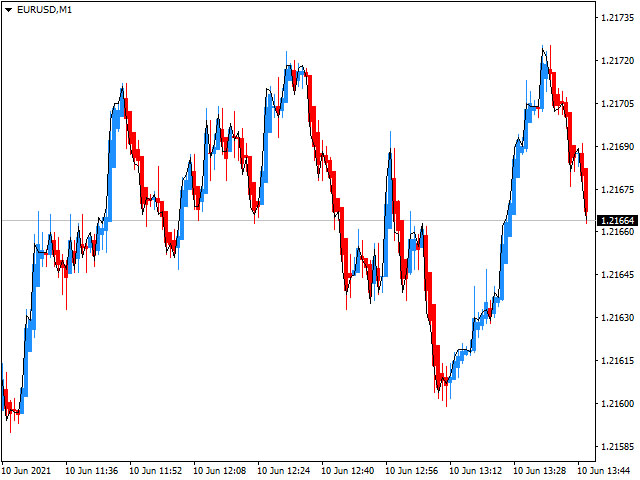
Indicator from the Real Non RePaint MultiTimeFrame (Real NRP MTF) series.
The indicator is based on the standard one. Does not redraw in any mode: the last closed candle is a rock.
Does not look into the future for history at the senior TF.
The formula for sensitivity enhancement has been changed (disabled in settings).
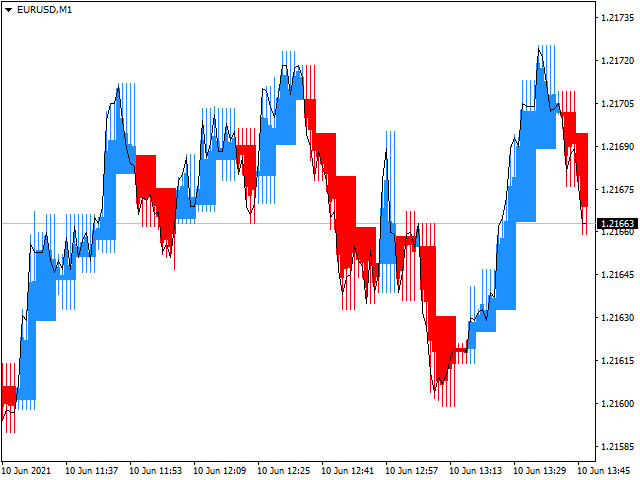
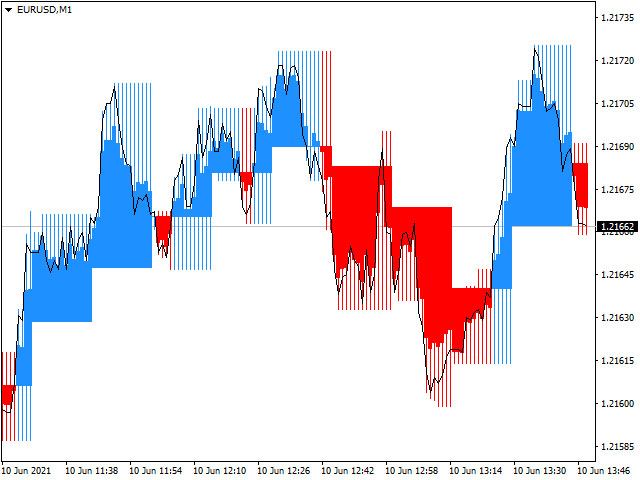
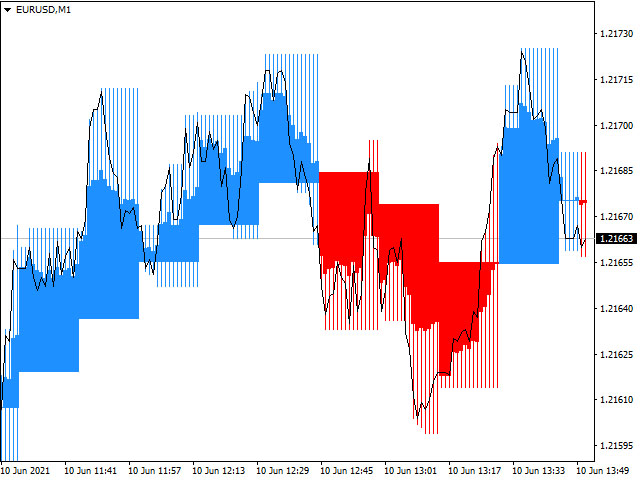
It works on the current TF or older ones with the display on the current one.
The last closed Heiken Ashi candle of the current timeframe before the opening of the new senior timeframe candle corresponds to the last closed Heiken Ashi candle on the senior timeframe.
An invisible buffer with the current trend has been added for advisors.
Settings:
TimeFrame - working timeframe.
Actuation and deactivation of indicator building (acceleration) modes.
You can change the color and thickness of the lines in the standard indicator settings tab.
Critical is the state and correspondence of the history of the current and senior TF. Check completeness before use.