• 概要
  • レビュー
  • コメント (14)
  • 最新情報

Namiri Trade Engine

Namiri Trade Engine is an ALL in ONE trading system that combines market structure, volume pressure, market condition & risk management to give you the BEST opportunities for A+ trade setups with auto lot size

WAIT FOR YOUR A+ SETUP || ONLY TAKE YOUR A+ TRADE || RINSE REPEAT YOUR A+ MOVE

Chart Features

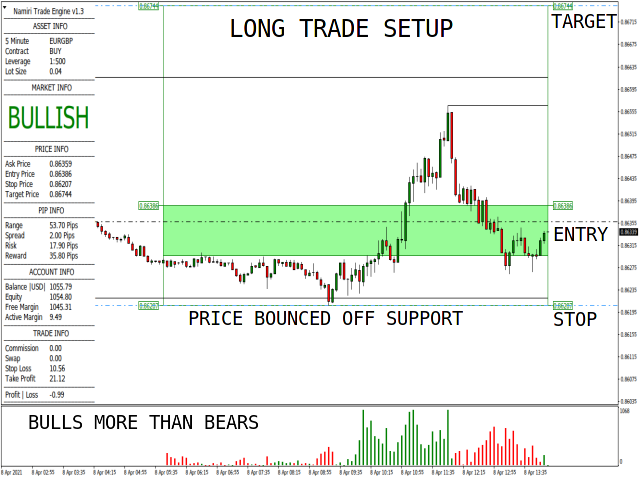
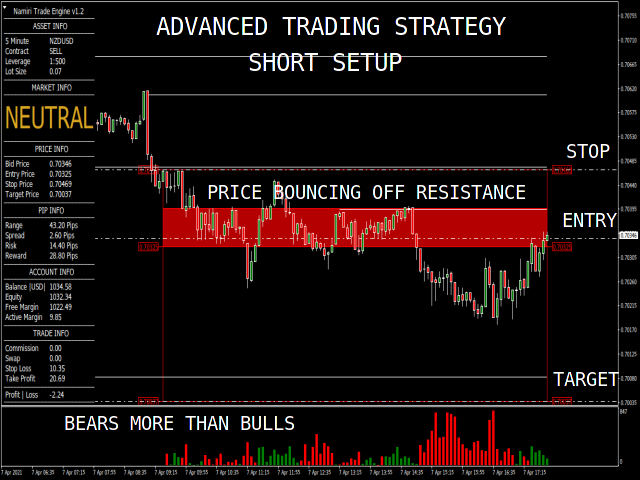
  • Panel - Shows the asset, market, price, pip, account, trade & profit|loss information
  • Structure - Shows areas of support & resistance
  • Risk Management - Shows risk analysis period of 100 bars, buy | sell entry zone as well as stop loss & take profit levels for a {1:2 risk:reward}
  • Volume - Shows volume pressure bars of bulls & bears at the bottom of your chart

Panel Features

  • Asset Info - Shows current time-frame, pair, contract is a buy|sell, leverage & lot size
  • Market Info - Shows the current market condition
  • Price Info - Shows bid|ask, entry, stop & target prices
  • Pip Info - Shows range, spread, risk & reward in pips
  • Account Info - Shows account balance, equity, free margin & active margin
  • Trade Info - Shows the amounts of commission, swap, stop loss & take profits
  • Profit | Loss - Shows the profit | loss on the active trade on that specific pair

Parameters

  • Trade Risk - Default: percent risk at 0.2%
  • Trade Setups - Bounce | Breach | Buddle { PICK ONE | MASTER ONE | TRADE ONE }
  • Color Theme - Bullish | Neutral | Bearish | Buy Zone | Sell Zone

Trade Setups

STOP BEHIND STRONG BARRIER || WEAK TO NO BARRIER TO TARGET || VOLUME PRESSURE CONFIRMATION
  • BUY Contract - Trade when a BUY ALERT is triggered for a bounce | breach | buddle trade setups, ASK price MUST close inside the LONG entry zone based on BULLISH market info, entry at SUPPORT, bullish volume pressure clusters MUST be significantly STRONGER on the LONG impulse move than bearish volume pressure clusters, A+ setup has a STOP BELOW a STRONG BARRIER & WEAK to NO BARRIER between your entry & target
  • SELL Contract - Trade when a SELL ALERT is triggered for a bounce | breach | buddle trade setups, BID price MUST close inside the SHORT entry zone based on BEARISH market info, entry at RESISTANCE, bearish volume pressure clusters MUST be significantly STRONGER on the SHORT impulse move than bullish volume pressure clusters, A+ setup has a STOP ABOVE a STRONG BARRIER & WEAK to NO BARRIER between your entry & target

Things To Note

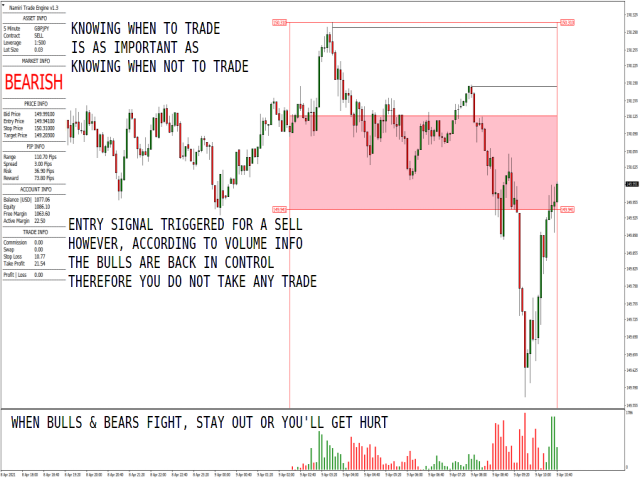
WHEN THE BULLS & BEARS FIGHT STAY OUT OR YOU WILL GET HURT

  • Depending on the risk percentage, spread & leverage, the lot size is some cases are rounded up or down therefore your actual trade amounts may differ slightly; a strong barrier is the one that is formed from the current price period all the way out past the risk analysis period {the longer the structure the stronger the barrier}
  • The stop loss & take profit dollar amounts shown under trade info are based on risk percentage plus hard stops and targets, therefore your actual trade amounts may differ slightly depending on your actual entry price, slippage, spreads & rounded lot size
  • Please DO NOT just take each & every trade setup alert, MOST are low quality trade setup alerts because of NO structure & NO volume pressure confirmations. First, pick one asset, one setup, one time frame. Secondly, ensure its an A+ setup that has been confirmed by structure & volume pressure. TEST it, PROVE it & TRADE it on a demo account BEFORE a live account. Lastly, just rinse & repeat those A+ trade setups; Ignore all trade setup alerts during red news on M1 & M5 they are most likely false positives

TEST IT || PROVE IT || TRADE IT

Share comments & reviews

おすすめのプロダクト
The Smooth Price technical indicator is used for plotting a smoothed line as close to the price of the financial instrument as possible, and serves to eliminate its noise components. The indicator is part of the Monarch trading system, but here it is presented as an independent technical analysis tool. The indicator is based on the cluster digital filter , which, unlike the ClusterSMA , is applied directly to the price time series. Smooth Price does not redraw (except the very last, zero bar) an
Black series MT4 - The indicator is designed for trading on binary options with Timeframe M1-M5-M15 Multicurrency (Works on cryptocurrency and currency pairs) The signal appears when the candle opens Up to 90% correct signals There is no signal redrawing at all Can be used with other indicators. Good for scalping! In Settings there is: -Indicator working methods -I Allert Arrow color Red signal down Blue signal up Also watch the video how the indicator works and signals
Limitless MT4は、すべての初心者と経験豊富なトレーダーに適したユニバーサルインジケーターです。 すべての通貨ペア、暗号通貨、生の株式で動作します 無制限のMT4-構成済みで、追加の構成は不要 そして今、主なもの なぜ無制限のMT4なのか? 1再描画の完全な欠如 2トレーディングの最高のスペシャリストによる2年間のテスト 3正しい信号の精度が80%を超える 4ニュースリリース中の取引で好調 取引ルール 1買いシグナル-青い上向き矢印の出現 下向きの赤い矢印の外観を販売するシグナル シグナル後の次のローソク足で取引を開始するには2 3テイクプロフィット チャート上 М1-40ピップ М5-50ピップ М15-55-60ピップ 4ストップロスは利益をとる 5誤った信号をフィルタリングするために、 パラボリックSAR-トレンドとのトレードへの参入を除外する移動平均または同様のトレンドインジケーター。 
ギャラクティックボリュームスプレッド分析(VSA)は、ボリュームを視覚化するために設計されたインジケーターであり、異なるペアのスプレッドのボラティリティに影響する割合です。 戦略は以下から構成されます。 ブルトレンド: 常にトレンドに賛成し、Galactic VSAインディケーターによって示される高ボリュームと一致する限り、トレンドの低価格でのオープン購入オペレーション。 下降トレンド: 常にトレンドに賛成し、トレンドの高値でオープンな営業活動を行います。ただし、Galactic VSAインディケーターによって示される高ボリュームと一致します。 優先ペア: EURUSD、GBPUSD、USDJPY H1未満の時間枠を推奨するのではなく、スイング取引でインジケーターをテストしました。 
Development of this indicator goes back several years, we have successfully used this latest algorithm since 2019, and it generally works well enough to be profitable. It was originally attempted to make it work on the daily chart, but as you will see in practice it doesn't work so well on the daily chart, while it works extremely well on the weekly chart, for the period setting between 0 and 2,  (0 is the latest running week candle,  1 is the latest candle plus the previous one, 2 weeks combine
Binary Options Support Resistance Indicator This indicator is designed for binary options trading and effectively shows retracements from support and resistance levels. Signals appear on the current candle. A red arrow pointing downwards indicates a potential selling opportunity, while a blue arrow pointing upwards suggests buying opportunities. All that needs adjustment is the color of the signal arrows. It is recommended to use it on the M1-M5 timeframes as signals are frequent on these timef
This indicator identifies and displays zones, as it were areas of strength, where the price will unfold. The indicator can work on any chart, any instrument, at any timeframe. The indicator has two modes. The indicator is equipped with a control panel with buttons for convenience and split into two modes. Manual mode: To work with manual mode, you need to press the NEW button, a segment will appear. This segment is stretched over the movement and the LVL button is pressed. The level is displayed
Introduction It is common practice for professional trades to hide their stop loss / take profit from their brokers. Either from keeping their strategy to the themselves or from the fear that their broker works against them. Using this indicator, the stop loss / take profit points will be drawn on the product chart using the bid price. So, you can see exactly when the price is hit and close it manually.  Usage Once attached to the chart, the indicator scans the open orders to attach lines fo
FxBears Super Trading Indicator を使用した高度な取引の世界へようこそ。 MT4 プラットフォーム専用に設計されたこの革新的なツールは、エリオット波動、需要供給ゾーン、内部インジケーターの力を組み合わせて、情報に基づいた取引決定のための高品質のシグナルをトレーダーに提供します。 90% 以上の成功率を誇る FxBears Super は、あなたの取引戦略に新たなレベルの精度と収益性をもたらします。 Of Corse は再描画も再描画もありません。 エリオット波動分析:      FxBears Super はエリオット波動の予測可能性を活用し、市場サイクルとトレンドを特定します。 特徴的な5波動インパルスと3波動修正パターンを分析し、潜在的な転換点や継続パターンを高精度に抽出します。 需要と供給のゾーン:      需要ゾーンと供給ゾーンの重要性を認識し、FxBears Super はチャート上の重要なサポートとレジスタンスのレベルを正確に示します。 市場センチメントが変化するこれらのゾーンは、潜在的な価格反転やブレイクアウトに関する貴重な洞
Welcome to the world of SMC (Smart Money Concepts) Trading, where we empower traders with the tools and knowledge to make smarter trading decisions. Our latest addition to our suite of trading tools is the SMC Trading Pro indicator, version 1.0. Key Features: Major Market Structure Identification with BODY break. Order Block must be in Major Swing ( not Small Swing ). Order Block with Fair Value Gap Detection. Order Block in Discount | Premium zone. Filter for only Bullish, Bearish or All Order
クオンツ移動平均勾配は、方向性と勢いを与える非常に強力な指標です。 インジケーターは塗り直しではありません。ma角度を効率的に計算してトレンドを見つけることができます。 シグナルキャンドルが閉じられると、利益カウントが始まります。 したがって、ライブで行われるのは正確な結果です。 提案されたTimeFrameはH1でそれを使用しています。 インジケーターのすべてのオプションは編集可能です。 ヒント:トレードスイングとトレンドブレイクアウトの方向。 フラクタル、練行足、ボリンジャーバンドは、精度と収益性を向上させることができます。 高低は、角度線の発散アプローチを使用して見つかる可能性があります。 このインジケータは、サポート抵抗、供給需要インジケータの追加確認として使用できます。 Ma勾配情報は、トレンドの方向と出口点を使用して入力するのに非常に役立ちます。 それは外国為替、株式、インデックスのために働きます。 PushNotifications / Email / SoundAlerts / PopUpAlertsでアラートを受け取ることができます。
FX Flow   indicator can be used as an anticipator of the next trend, preferably confirmed by Price Action or another oscillator (RSi, Stochastic ..). It takes the money flows of the major currencies USD EUR GBP AUD NZD CAD CHF JPY into account, and processes them. Excellent tool for indices, but also for correlations between currencies. Works on each timeframes.  Blue line: Bull market Yellow line: Bear market Note : if the indicator opens the window, but does not draw lines, load the histo
BSA indicator is a ZigZag based indicator. This indicator is used to find the reversal level of the price. You can use the existing risk ratio and calculation timeframe in the entries by optimizing them according to your usage preference.  In lower time frames, the indicator can repaint. For healthier results, you can detect the least repainting by observing for a while according to the graphic you will apply.
Wave Impulse OmegaScalper - is the manual system for scalping. In many cases Indicator "eats" almost all possible trend wave. System defines up price wave and down price wave. Inside the exact wave - system defines true trend movement and choppy market. Indicator plots signals while market is trending, powerfull and has quiet good volatility. This is complete system with enter and exit points. Main Indicator's Features Signals are not repaint,non-late or disappear(exept cases when system recalcu
POWER TO GET WEALTHY TRADING SYSTEMS.  NON REPAINT REVERSAL ARROW AND CHANNEL  Intra-Day trading and Scalping Strategy:   Designed for fast and accurate day trading and short-term trades. Day and Swing Trading Strategy:   Can be used as a reliable tool for day and swing traders who aim for the big moves of the price. Multi Currencies and Markets:   Works on different instruments and markets with its reliable precision. Multi Timeframes:   Can be used on multiple timeframes with good perfor
Towers - Trend indicator, shows signals, can be used with optimal risk ratio. It uses reliable algorithms in its calculations. Shows favorable moments for entering the market with arrows, that is, using the indicator is quite simple. It combines several filters to display market entry arrows on the chart. Given this circumstance, a speculator can study the history of the instrument's signals and evaluate its effectiveness. As you can see, trading with such an indicator is easy. I waited for an a
VR Cub
Vladimir Pastushak
VR Cub は、質の高いエントリーポイントを獲得するためのインジケーターです。このインジケーターは、数学的計算を容易にし、ポジションへのエントリーポイントの検索を簡素化するために開発されました。このインジケーターが作成されたトレーディング戦略は、長年にわたってその有効性が証明されてきました。取引戦略のシンプルさはその大きな利点であり、初心者のトレーダーでもうまく取引することができます。 VR Cub はポジション開始ポイントとテイクプロフィットとストップロスのターゲットレベルを計算し、効率と使いやすさを大幅に向上させます。取引の簡単なルールを理解するには、以下の戦略を使用した取引のスクリーンショットを見てください。 設定、設定ファイル、デモ版、説明書、問題解決方法は、以下から入手できます。 [ブログ] レビューを読んだり書いたりすることができます。 [リンク] のバージョン [MetaTrader 5] エントリーポイントの計算ルール ポジションをオープンする エントリーポイントを計算するには、VR Cub ツールを最後の高値から最後の安値までストレッチする必要があります。
The indicator detects and displays Shark harmonic pattern (see the screenshot). The pattern is plotted by the extreme values of the ZigZag indicator (included in the resources, no need to install). After detecting the pattern, the indicator notifies of that by a pop-up window, a mobile notification and an email. The indicator highlights the process of the pattern formation and not just the complete pattern. In the former case, it is displayed in the contour triangles. After the pattern is comple
Next level of trend trading here. Possibility 75%, the indicator analyzes the current market to determine short (small dot), middle (circle with a dot inside) and long (cross with a circle and a dot inside) trends.  Wingdings characters of  Aqua color represents the beginning of the UP trend. Wingdings characters of  Orange color represents the beginning of the DOWN trend. Possibility 75% Indicator will improve your trading in the world of forex, commodities, cryptocurrencies and indices.
FairyFibo  can generate as many as 70 different BUY signals and 70 different SELL signals solely based on Price Action and Fibonacci levels. The idea is to catch as many as Swing High's and Swing Low's but with the consideration of the current trend mind. This indicator can be also used for Binary Options Trading as most of the time price tends to follow the signal direction immediately. Most of the strategies are already optimized for different time frames and different market conditions. While
Gioteen Volatility Index (GVI)   - your ultimate solution to overcoming market unpredictability and maximizing trading opportunities. This revolutionary indicator helps you in lowering your losing trades due to choppy market movements. The GVI is designed to measure market volatility, providing you with valuable insights to identify the most favorable trading prospects. Its intuitive interface consists of a dynamic red line representing the volatility index, accompanied by blue line that indicat
1. Going offline means that the market is in a wait-and-see state. In this situation, it is common to choose to wait and see rather than taking immediate action to wait for more market information or trend confirmation in order to make wiser decisions. 2.When there is a trend of going up and down, the market shows a bullish signal. At this point, investors may consider entering the market in hopes of future price increases and profits. 3.When the market situation is online, it will once again t
LDS Scalper
Justice Chinemelum Clement
PLEASE LEAVE US A 5-STAR REVIEW   LDS Scalper User Manual+ Extra LDS CSDIF INDICATOR + Training Videos   ABOUT LDS SCALPER INDICATOR STRATEGY Built on  15+ years of trading experience. LDS Scalper is a very powerful  trading indicator for scalping strategy, returns very high accuracy rate in forex, futures, cryptocurrencies, stocks and indices. This indicator displays arrow signals based on price action information with high accuracy. The LDS Scalper Indicator strategy when applied can turn a ne
In Out Trend is a trend indicator for working in the Forex market. A feature of the indicator is that it confidently follows the trend, without changing the signal if the price slightly pierces the trend line. The indicator is not redrawn. In Out Trend - the indicator gives entry signals at the most logical prices after the price pierces the trend line. The indicator works on the basis of mathematical calculations on the price chart. It is one of the most common and useful indicators for find
This is the complete REX package. It consists of the lite, pro and ULTRA version.  Perfect for beginners and intermediates. REX complete is 100% non repaint. The strategy is based on a mix of different strategies, statistics, including pivot points, oscillators and patterns.  As the trading idea consists of a variety of some classic indicators like Momentum, Williams Percent Range, CCI, Force Index, WPR, DeMarker, CCI, RSI and Stochastic, it is clear that the fundamental indicators have being
トレンドキャッチャー: アラートインジケーター付きのトレンドキャッチャーストラテジーは、市場トレンドやポテンシャルなエントリーポイントやエグジットポイントを特定するのに役立つ多目的な技術分析ツールです。動的なトレンドキャッチャーストラテジーを備えており、市場状況に適応してトレンドの方向を明確に視覚化します。トレーダーは、自身の好みやリスク許容度に合わせてパラメーターをカスタマイズできます。このインジケーターはトレンドの識別を支援し、ポテンシャルなリバーサルをシグナルし、トレイリングストップのメカニズムとして機能し、市場への迅速な対応のためのリアルタイムアラートを提供します。 特徴: - トレンドの識別:上昇トレンドと下降トレンドをシグナルします。 - トレンドのリバーサル:ローソク足の色が上昇から下降に変わった場合やその逆の場合に、ポテンシャルなリバーサルを警告します。 - リアルタイムアラート:新しいトレンドの識別に対するアラートを生成します。 推奨事項: - 通貨ペア:EURUSD、AUDUSD、XAUUSDなど... - タイムフレーム:H1。 - アカウン
FREE
This indicator works on MT4 and is very easy to use. When you receive a signal from it, you wait for that candle with the signal to close and you enter your trade at the beginning of the next new candle . A red arrow means sell and a green arrow means buy. All arrows comes with Alert  like for easy identification of trade signal. Are you okay with that? 1 minute candle 1 minute expire
OFFER! OFFER! NEXT Price Will be 650$ and the rental option will be removed after this. Don't miss the current price offer before it is too late. Dear Traders I am so glad to introduce my Super Powers Indicator.  The purpose of this trading tool is to help serious traders who want to make trading one of their main source of income.  I know trading is not an easy task but if you have the right tools, knowledge and motivation to trade then you are ready to go in this industry. My role is to help y
PABT Pattern Indicator - it's classical system one of the signal patterns. Indicator logic - the Hi & Lo of the bar is fully within the range of the preceding bar, look to trade them as pullback in trend. In the way if indicator found PABT pattern it's drawing two lines and arrow what showing trend way.  - First line - it's entry point and drawing at: 1. On the high of signal bar or on middle of the signal bar (depending from indicator mode) for buy; 2. On the low of signal bar or on middle of t
This is a Binary Options signal indicator. Extremely powerful for the 1 min chart. The signals are based on my personal tweak (based on real trial and error & backtested) of the RSI, ADX and Ichimoku and my observation on how price moves. It turns out, 2 candles expiry is the most consistent with this set up. How to use: 1. Wait for arrow signal to show. 2. Place a 2 candle expiry right after the close of the signal candle. So if you are trading a 1 min chart, place an expiry for 2 mins... if yo
このプロダクトを購入した人は以下も購入しています
Automatic, live & interactive picture of all trendlines. Assign push, email and sound alerts to the lines of your choice and be informed about price rollback, breakout, rollback after breakout, number of rollbacks, line expiration by double breakout. Correct, drag or delete the lines and interactively tune the line system. https://youtu.be/EJUo9pYiHFA . Chart examples https: //www.mql5.com/en/users/efficientforex Price Interaction Events All events are effective immediately and only after on
サポート と 抵抗レベルインジケーター( Support and resistance )をダウンロードできます。 インジケーターは、水平とトレンドのサポートと抵抗レベルを 表示します 。 インジケーター設定: トレンド( Trends ) トレンド又は水平のサポートと抵抗レベルの表示モード設定 はい( Yes )-トレンドレベルしか表示しない いいえ( No )- 水平 レベルしか表示しない リソース使用( UseResource ) インジケーターに組み込まれているリソースの使用モード設定。 はい( Yes )-商品リソースからのジグザグ( ZigZag )インジケーターを使用すること。 いいえ( No )-ジグザグ( ZigZag )ユーザーインジケーターを使用すること。 履歴バー( HistoryBar ) レベルが表示される履歴バーの数 バー数( CountBar ) 現在のバーを始め、サポートと 抵抗レベル が検索されるバーの数 商品で使用されている ジグザグ ( ZigZag ) インジケーターの設定 : デプス( Depth ) 前の値 より 偏差( Deviatio
The [GRAFF] III manual trading system is based on multiple MetaTrader (MT4) indicators. Together, the entire PACK of GRAFF III indicators makes an advanced trading tool. The system consists of over 20 different custom-built indicators which have been carefully selected and tested in the long term to produce strong and efficient trading signals. The particular indicators are based on different mathematical formulas, so the entire system is calibrated to remove false signals from its own indicator
The arrows are calculated with: -     2 Parabolic  parameters -     2 ADX parameters -     4 Stochastic parameters We recommend to combine it with Parabolic, ZigZag or Elliot waves indicator. Always trade the trend! If you make sure to draw your trend lines and support/resistance zones you will just have to wait for the signal to appear. Take the trade. For Binary Options it is advisable to set the expiry time to 5-15 min in M1 chart. THIS INDICATOR IS ZERO REPAINT Best assets to trade: -
Let´s try to make some real money! Call me profit addicted. I thought why not try to make THE dream come reality. With discipline, a clear strategy and this indicator I focus on entering the perfect trades. This indicator is very easy to use as you will get perfect entry points for Put or Call trades. The arrows are calculated with: -     Momentum  parameters -     Candle stick patterns -     Fundamental Price action We recommend to combine it with Parabolic, ZigZag or Elliot waves indic
Golden Chip provides Basic Market Structure, Fibonacci, supply and Demand Zones. Letting you identify when a sell off point is approaching or whne a buy opportunity is arriving. The awesome thing about Golden Chip is that, you will see rejection levels or continuation before ANYBODY ! This indicator moves directly with price and lines up perfectly with the Chart. Some indicators would lag but NOT this one ! Golden Chip is amazing for Clean chart (Naked Chart). GOLDEN CHIP IS ONLY ON METATRADER (
Counter trade type indicator. Jcounter can capture the timing of the trend collapse phase. There are signs of a trend collapse. It is the world standard to confirm the sign with LSMA adopted by Jcounter. The numerical setting of LSMA is very important, but after many years of verification, the numerical value was identified and completed. When the trend starts, the rising market moves like a support, and the falling market moves like a resistance. Gradually overtake the candlest
Axebagsh
Batsukh Sumchin Khuyagbaatar
Only work on Crude Oil H1  time frame  Swing follow trend.  do not trade against trends Specifies the first destination and entry and exit points For 16 years, I only traded on CrudeOil. Crude oil is one of the most extreme combinations in the world and it is safe to say that such a good indicator has never been made before.   This indicator will save you a lot of money because it introduces a new type of approach, Good luck
Forex Signal Generator is a cutting edge technology for Trend Trading, and filtering all inbuilt in one tool. The Signal Generator  analysis the market like a Pro  by using its smart algorithms to detect  the trend, filter out market noise  and display on  your chart with the : ENTRY, STOPLOSS AND TARGET PROFIT Advantages You Get     Access to the proven reliable trend indicator based     Easy and  effective trend detection.     Gives you the ability to filter  out  'NOISE' from the ma
The breakout algorithm is a technique based on price, price features, to shape a breakout strategy. The strategy in this indicator will not be redrawn (none-repaint indicator), it is suitable for short or long term traders In the screenshot is the EURUSD pair, these currency pairs, commodities or stocks, it have similar strength *Non-Repainting (not redrawn) *For Metatrader4 Only *Great For Scalping *Great For Swing Trading *Arrow Entry, Green is Long, Red is Short *Works On Any Timeframe *Work
Premium support and resistance - the best combination of different indicators allowed us to create the best product on the market! And that's Premium support and resistance! A convenient and flexible tool that will help you in trading! Shows where the price will go from the support and resistance levels! The arrows Blue buy Red sell will help you with this! Alert is already built into the indicator for your convenience! Alert in order not to miss the "Own" signal! It is already co
CFF Dark M Volume This is the most accurate Volume Reversal & Trend Following System for MT4 providing accurate signals to enter a trade without redrawing or delays.   It can be applied to:  All MT4 Charts . . The best results are on the timeframe 1H & 4H     IMPORTANT! Contact me after your purchase to get the detailed guide.   Most traders are %99 accurate with the help of CFF Dark Money Volume System.    Benefits of CFF Dark M Volume System  Entry signals  based on real volume of
MMM Gold Sniper
Gilang Wardhana Purnama Putra
指標はマーケットメーカー戦略に基づいています。再塗装なし。 MM はトレーダーであり、彼らの目的はお金を稼ぐことです。これには、小売トレーダーとの取引戦略が含まれます。彼らと他のトレーダーとの主な違いは、大量の取引量にアクセスすることで、自由に価格を動かす能力があることです。そのため、利益を得るために、彼らはより低い価格で購入し、より高い価格で販売することを目指しています。 彼らは次の方法でこれを達成します。 1. トレーダーにポジションを取るように誘導する。これは、一連の価格変動を使用して、トレーダーを「だまして」特定の方向にポジションを取り、その後再び反転させることによって達成されます。これは、MM が特定の通貨を特定の価格で売却し、リテール トレーダーが通貨の価値が後退して再び売却したいという苦痛を感じたときに、より低い価格で買い戻すことができることを意味します (たとえば、ストップ ロスを介して)。 ) 2. パニックと恐怖を引き起こし、トレーダーが感情的になったり、不合理に考えたりするように仕向けます。多くの場合、これには次のことが含まれます。 ⋅ 素早い動き ⋅ スパイクキ
Place the indicator on the chart, preferably with a timeframe of H1 or H4. If you are trading in the daily range or, conversely, on lower timeframes, you will need to adjust the RSI and ATR levels accordingly.  The blue arrows of the indicator will be a signal to open a long position, the red arrows will be a signal to open a short position: 1) Blue arrow for longs (growth) and red arrow for shorts (decline). 2) Two horizontal lines for current positions (one for entry and one for stop). 
WARNING!! THIS SWORD IS TOO SHARP!    ONLY 10 COPIES LEFT FOR THE NEXT PRICE TO BE 8,000$ FOR UNLIMITED PLAN. Dear traders I am very glad once again to introduce to you my other tool called "Forex Sword Indicator". In short this tool is meant to give you an edge over the market that you have been waiting for  so long. Now, here it is. It is a very very simple tool but yet a dangerous sword. I call it a  Holy grail indicator!. I will not talk a lot about this tool. Just let the tool speak by itse
IconTradeSL.  Возможность выставлять sl по уровням. В индикаторе установлена возможность показывать историю уровней на графике. Возможность выставлять sl по уровням. Настройки индикатора: ЦВЕТ_BAR - цвет баров по которым ищем SL ЦВЕТ_Тек_BAR - Purple;//цвет текущего бара BAR - поиск в последних BAR барах (по умолчанию 200) show_bar - показывать бары по которым ищем SL
This indicator has a lot of numerology analyzing methods that can support your analyzes or can work as custom strategy by it self ..we will start to explain them one by one :   1- Range   channel that draws the limits of daily movements to detect places of buy and places of sell . 2-   Angler   will detect Dynamic numeral levels that result of time and price squaring with custom numeral method that works like support and resistant and will support your analyzes 3-   Shepherd Levels   it is l
Golden Range 2
Damian Mateusz Wojtowicz
Golden Range 2 is one of the top entry indicators securing its future with its results.  Indicator settings: Points = how precise pattern detection is AlertConfirmation = turn on(true) off(false) alert CalculatedBars = how many bars will be calculated Please leave Positive comments, reviews. Buffer 0 Buy Arrow, Buffer 1 Sell Arrow, Buffer2 Buy Signal(Value:1/0), Buffer3 Sell Signal(Value:1/0)  Buy Green, Sell Red
StakBank Lines
Hjone Maykson Antonelli Dos Santos
-AUDUSD M15 - Every time there is any crossing of the RED lines , it means sell.  - Every time there is any crossing of the GREEN lines , it indicates buy. Discover the Future of Trading with Our Exclusive Indicator! In the dynamic world of financial markets, precision and the ability to anticipate movements are crucial for success. With this in mind, we have developed an exclusive indicator that combines cutting-edge technology with a sophisticated approach to offer you an indispensable to
Gann Made Easy は、ミスター・ギャンの理論を使用した取引の最良の原則に基づいた、プロフェッショナルで使いやすい外国為替取引システムです。 W・D・ガン。このインジケーターは、ストップロスとテイクプロフィットレベルを含む正確な買いと売りのシグナルを提供します。 PUSH通知を利用して外出先でも取引可能です。 購入後はご連絡ください!私の取引のヒントと素晴らしいボーナスインジケーターを無料で共有します! おそらく、ギャンの取引手法についてはすでに何度も聞いたことがあるでしょう。通常、ギャンの理論は初心者のトレーダーだけでなく、すでにある程度の取引経験がある人にとっても非常に複雑なものです。なぜなら、ギャンの取引手法は理論的にはそれほど簡単に適用できるものではないからです。私はその知識を磨き、最良の原則を私の外国為替インジケーターに組み込むために数年を費やしました。 このインジケーターは非常に簡単に適用できます。必要なのは、それをチャートに添付し、簡単な取引推奨事項に従うだけです。このインジケーターは常に市場分析の仕事を行い、取引の機会を探します。適切なエントリーポイントを検出
指示する     ロシア     -        utilizar con   el indicador の ESP 推奨事項 -   TPSpro トレンド プロフェッショナル版 -   MT5のバージョン 最も重要なことは、将来においても最も重要なことです。 機能のプリンシパル: ゾーンのほとんどは、ベンダーとコンプラドールによってアクティブ化されます。 状況を直感的に把握できるよう、初期の衝動を修正します。 LOGIC AI: MUESTRA zonas (círculos) parabuscar puntos de entrada cuando se activa una plantilla 視覚的に優れた視覚効果があり、最も重要な機能がすべて揃っていることに注意してください。 優れたニベレス/ゾーンの視覚化 (modo MTF) 世界で最も人気のある場所/ゾーンです。これを使用するのに最適な方法です (   TPSproTREND PRO   )。 アルゴリズム プロフェッショナル セパラド パソ ア パソ パラ オペラ それは、オペラハウスやコントラ・デ・エラの指導におい
Gold Stuff
Vasiliy Strukov
4.89 (239)
Gold Stuff は、金専用に設計されたトレンド指標であり、あらゆる金融商品にも使用できます。 インジケーターは再描画せず、遅れません。 推奨時間枠 H1. それインディケータでフルオートExpert Advisor EA Gold Stuffが動作します。 あなたは私のプロフィールでそれを見つけることができます. 設定と個人的なボーナスを得るために、購入後すぐに私に連絡してください! トレンド スキャナーの強力なサポートを利用して、無料のインジケーターを入手し、プライバシーを守ります。あーみー!   設定 矢印を描く - オンオフ。 チャートに矢印を描く。 アラート - 可聴アラートのオンオフ。 メール通知 - オンオフ。 電子メール通知。 プチ通知 - オンオフ。 プッシュ通知。 次に、色域を調整します。 Gold Stuff は、金専用に設計されたトレンド指標であり、あらゆる金融商品にも使用できます。 インジケーターは再描画せず、遅れません。 推奨時間枠 H1. それインディケータでフルオートExpert Advisor EA Gold Stuff
まず第一に、この取引インジケーターは再描画されず、再描画されず、遅延しないことを強調する価値があります。これにより、手動取引とロボット取引の両方に理想的なものになります。 ユーザーマニュアル:設定、入力、戦略。 アトミックアナリストは、価格の強さとモメンタムを利用して市場でより良いエッジを見つけるためのPA価格アクションインジケーターです。ノイズや誤ったシグナルを除去し、取引ポテンシャルを高めるための高度なフィルターを備えています。複雑なインジケーターの複数のレイヤーを使用して、アトミックアナリストはチャートをスキャンし、複雑な数学的計算をシンプルなシグナルと色に変換します。これにより、どのような初心者トレーダーでも理解して使用し、一貫した取引の決定を行うことができます。 「アトミックアナリスト」は、新規および経験豊富なトレーダー向けにカスタマイズされた包括的な取引ソリューションです。プレミアムインジケーターとトップノッチの機能を1つの取引戦略に組み合わせ、すべてのタイプのトレーダーにとって汎用性のある選択肢にします。 デイリートレーディングとスキャルピング戦略:高
Trend Punch
Mohamed Hassan
4.95 (19)
This indicator is unstoppable when combined with our other indicator called  Support & Resistance . After purchase, send us a message and you will get it   for  FREE as a BONUS! Introducing Trend Punch , the revolutionary forex trend indicator that will transform the way you trade! Trend Punch is uniquely designed to provide precise buy and sell arrows during strong market trends, making your trading decisions clearer and more confident. Whether you're trading major currency pairs or exotic sym
TPSpro TREND PRO は 、市場を自動的に分析し、トレンドとその各変化に関する情報を提供し、再描画せずに取引に参加するためのシグナルを提供するトレンド指標です。 インディケータは各ローソク足を使用し、個別に分析します。さまざまなインパルス(アップまたはダウンインパルス)を指します。通貨、仮想通貨、金属、株、指数の取引への正確なエントリーポイント! バージョンMT5                   インジケーターの完全な説明   インジケーター -   RFI LEVELS と併用することをお勧めします。 主な機能: レンダリングなしで正確な入力信号! シグナルが表示された場合、それは関連性を維持します。これは、シグナルを提供してからそれを変更する可能性があり、入金時の資金の損失につながる可能性があるリドローインジケーターとの重要な違いです。より高い確率と精度で市場に参入できるようになりました。矢印が表示された後、ターゲットに達する (利益確定) か反転シグナルが表示されるまで、ローソク足を色付けする機能もあります。 STOP LOSS / TAKE PROFIT
MetaBands M4
Vahidreza Heidar Gholami
5 (2)
MetaBandsは、強力でユニークなアルゴリズムを使用してチャンネルを描画し、トレンドを検出して、トレーダーに取引の入出ポイントを提供することができます。チャンネル指標に加えて、強力なトレンド指標でもあります。入力パラメータを使用して新しいチャンネルを作成するために、異なるタイプのチャンネルを統合することができます。MetaBandsは、市場のイベントについてユーザーに通知するために、すべてのタイプのアラートを使用します。 特徴 ほとんどのチャンネルアルゴリズムをサポート 強力なトレンド検出アルゴリズム 異なるタイプのチャンネルを統合する能力 マルチタイムフレームおよびマルチカレンシー(シグナルマトリックス) すべてのタイプのアラート機能(サウンド、画面フラッシャー、プッシュ通知、メール、ポップアップ、矢印) 再描画しない トレンド検出 MetaBandsは、チャネル内を振動する青いラインを使用してトレンドを検出します。ラインがチャネルの上部バンドに達すると、下降トレンドの開始を示し、下部バンドに達すると上昇トレンドの開始を示します。青いラインが中心ラインに近づくと、市場はコンソ
- Real price is 80$ - 40% Discount ( It is 49$ now ) Contact me for instruction, add group and any questions! Related EA Product: Bitcoin Expert Introduction The breakout and retest strategy is traded support and resistance levels. it involves price breaking through a previous level.  The break and retest strategy is designed to help traders do two main things, the first is to avoid false breakouts. Many false breakouts start with a candlestick that breaks out of a level but ends with an immedi
FX Volume
Daniel Stein
4.58 (33)
mql5と Telegramの モーニング・ブリーフィングで、詳細とスクリーンショットを含む毎日のマーケット・アップデートをご覧 ください! FX Volumeは、ブローカーの視点から市場のセンチメントをリアルに洞察する、最初で唯一の出来高インジケーターです。 ブローカーのような機関投資家が外国為替市場でどのようなポジションをとっているか、COTレポートよりもはるかに速く、素晴らしい洞察を提供します。 この情報をチャート上で直接見ることは、あなたの取引にとって真のゲームチェンジャーであり、画期的なソリューションです。 以下のようなユニークなマーケットデータ洞察から利益を得てください。 比率は 、通貨のロングポジションとショートポジションの比率をパーセントで表示します。 比率の変化は 、選択した期間内のロング比率とその変化率を表示します。 Volumes Totalは 、通貨の取引量(ロングとショート)の合計をロット単位で表示します。 Volumes Long :全通貨のロングポジションの取引量を表示します。 Volumes(ショート )は、全通貨のショートポジションの取引量を表示
An exclusive indicator that utilizes an innovative algorithm to swiftly and accurately determine the market trend. The indicator automatically calculates opening, closing, and profit levels, providing detailed trading statistics. With these features, you can choose the most appropriate trading instrument for the current market conditions. Additionally, you can easily integrate your own arrow indicators into Scalper Inside Pro to quickly evaluate their statistics and profitability. Scalper Inside
Trend Screener
STE S.S.COMPANY
4.8 (87)
トレンドインジケーター、1つのツールに組み込まれたすべての重要なトレンド機能を備えたトレンドトレーディングとフィルタリングのための画期的なユニークなソリューション! これは、すべてのシンボル/商品(外国為替、商品、暗号通貨、インデックス、株式)で使用できる100%再描画されていないマルチタイムフレームおよびマルチ通貨インジケーターです。 期間限定オファー: サポートおよびレジスタンス スクリーナー インジケーターは、たった 50 ドルで永久的にご利用いただけます。(元の価格 250 ドル) (オファー延長) トレンドスクリーナーは、チャート内のドットで矢印トレンドシグナルを提供するインジケーターに続く効率的なインジケーターです。 トレンド分析インジケーターで使用できる機能: 1.トレンドスキャナー。 2.最大利益分析を備えたトレンドライン。 3.トレンド通貨強度メーター。 4.アラート付きのトレンド反転ドット。 5.アラート付きの強いトレンドドット。 6.トレンド矢印 毎日の分析例、毎日のシグナルパフォーマンス...など、トレンドスクリーナーインジケーターを使用して、ここで見つけること
作者のその他のプロダクト
Prometheus Smart Money is an indicator that combines both price & volume with calculations based on other custom indicators, smart volume and retail volume to create this leading indicator that gives you high probability moves to help you make a decision on what is MOST likely to happen in the market going forward Advantages You can use it in ALL financial markets including binary options on ALL asset classes or instruments. You can use it as a stand alone indicator or as a confirmation tool wit
Centaurus Trend Engine is an indicator that uses custom indicators to give the current momentum moves of the market with a multi-timeframe approach to trading Features Value Area -It is the (red/green) rectangular box on your chart based on the dynamic structure period set;Green to indicate you focus on LONG moves & Red for SHORT moves Analysis - Displays The Market Analysis Strength - Displays The Market Strength Trend - Displays The Market Trend Entry State - Displays the BEST entry time for t
Primus Smart Money is an indicator that shows the average of bulls and bears on an asset. Used as a confirmation indicator for bullish and bearish control to assist in predicting future price moves Advantages Used in ALL financial markets including binary options on ALL asset classes or instruments. To be used as a confirmation tool with other indicators Parameters Period - default set to 9 (Recommended) Entry requirements Focus on the clusters on the indicator - the height or depth of the bars
Primus Trading Engine is a trading system that combines price action,ratio based indicators & custom indicators to create this leading indicator with a multi-timeframe approach to give you high probability trade setups for forex,CFD cash/futures,metals & binary option to assist in making predictions on what is MOST likely to happen in the market Main Chart Features Price Action Signal-Arrow displayed on a specific bar;NOT buy/sell arrow;DOES NOT repaint;Bullish arrow on a bullish bar,price is l
Prometheus Trade Engine is an indicator that combines price action, ratio based indicator with custom indicators& other lagging indicators to create this leading indicator that has a multi-timeframe approach to trading so that you are able to see what other timeframes are doing all in one chart and give you high probability trade setups to assist you to make a prediction on what is MOST likely to happen in the market going foward Chart Features 1. Reversal Zone It is the rectangular box on
フィルタ:
レビューなし
レビューに返信
バージョン 17.5 2024.09.20
Updated risk management tool
Updated volume pressure code
Updated structure code
バージョン 17.4 2024.09.02
Changes to entry zone on the risk management tool
Changes to entry criteria on all namiri trade setups
Changes to structure & volume pressure calculations
バージョン 17.3 2024.07.10
Adjusted the risk analysis period to 100
Adjusted the entry criteria to namiri breach setup
バージョン 17.2 2024.07.02
Adjusted the risk analysis period to 200
Improvements to structure code
Improvements to volume pressure calculations
バージョン 17.0 2024.06.11
Improvements to volume pressure code
バージョン 16.9 2024.06.08
Modified structure code
Simplified entry criteria for namiri bounce | breach | defense | strike setups
バージョン 16.8 2024.05.23
Added an adjustable maximum pip risk per trade parameter
Improvements to volume pressure code & re-added namiri defense setup
バージョン 16.7 2024.05.05
Removed namiri defense setup
Simplified entry criteria for namiri bounce, breach & strike setups
Improvements to structure to include broken support & resistance
Improvements to volume pressure calculations
バージョン 16.6 2024.03.19
Fixed a critical error on structure support & resistance code
バージョン 16.5 2024.03.19
Removed volume analysis limit
バージョン 16.4 2024.03.16
Improvements to volume pressure calculations
バージョン 16.3 2024.03.14
Improvements to structure to show broken support & resistance
バージョン 16.2 2024.03.12
Adjustments to the volume pressure period
バージョン 16.1 2024.03.07
Set market info & volume info analysis limit to 200 bars
The first 100 volume pressure bars represents "inside the wire"
The last 100 volume pressure bars represents "outside the wire"
バージョン 16.0 2024.02.28
Modified market info calculations
Modified volume pressure calculations
Added a filter to the entry criteria for all namiri trade setups
バージョン 15.9 2024.02.12
Modified entry criteria for namiri breach setup
Improvements to volume pressure calculations
バージョン 15.8 2024.01.29
Modified entry criteria for namiri defense setup
Improvements to volume pressure calculations
バージョン 15.7 2024.01.25
Modified entry criteria for namiri strike setup
Modified volume pressure calculations
バージョン 15.6 2024.01.25
Modified volume info calculations
Modified structure code
バージョン 15.5 2024.01.18
Modified entry criteria for namiri strike setup
Modified volume info calculations
バージョン 15.4 2023.12.01
Re-added namiri strike trade setup
Modified market info calculations
Modified entry criteria for all namiri trade setups
バージョン 15.3 2023.11.09
Modified volume pressure calculations
バージョン 15.2 2023.10.30
Removed strike trade setup
Modified entry criteria for breach & defense trade setups
バージョン 15.1 2023.10.23
Modified volume pressure calculations
バージョン 15.0 2023.10.18
Modified volume pressure calculations
Modified alerts on all trade setups
バージョン 14.9 2023.09.23
Added namiri strike trade setup
Improvements to support & resistance structure calculations
Added trade setup parameter options
Changed parameter options display
バージョン 14.8 2023.09.15
Modified analysis period
Modified namiri bounce setup
バージョン 14.7 2023.08.28
Modified namiri breach & namiri defense entry setups
バージョン 14.6 2023.08.25
Modified namiri bounce, namiri breach & namiri defense setups
バージョン 14.5 2023.08.02
Improvements to support & resistance code
バージョン 14.4 2023.07.24
Modifications to namiri breach & namiri defense entry setups
バージョン 14.3 2023.07.14
Fixed trade info -- commission, swap & stop loss display errors
バージョン 14.2 2023.07.12
Improvements to support & resistance code
バージョン 14.1 2023.07.11
Improvements to volume pressure calculations
バージョン 14.0 2023.07.10
Modified market info calculations
Modified volume pressure calculations
Added entry criteria for 3 entry setups (namiri bounce, namiri breach & namiri defense)
バージョン 13.9 2023.06.02
Modified market info calculations
Modified volume pressure calculations
Modified entry criteria
バージョン 13.8 2023.05.25
Updated entry criteria
バージョン 13.7 2023.05.19
Fixed issues in structure code
Modifications to volume pressure code
バージョン 13.6 2023.05.11
Modified entry criteria
Modified focus hooks
バージョン 13.5 2023.04.27
Improvements to market info to include fast market response
Improvements to volume info to include a longer analysis period
Improvements to structure calculations to include a longer analysis period
バージョン 13.4 2023.04.12
Improvements to volume pressure code
バージョン 13.3 2023.04.05
Added a filter to the entry criteria
Improvements to the volume pressure code
バージョン 13.2 2023.03.28
Removed momentum tag
バージョン 13.1 2023.03.22
Improvements to volume pressure code
Added momentum tag
バージョン 13.0 2023.03.21
Improvements to volume pressure code
バージョン 12.9 2023.03.16
Improvements to volume pressure code
バージョン 12.8 2023.03.15
Improvements to structure code
バージョン 12.7 2023.03.09
Changes to focus hooks on market info
バージョン 12.6 2023.03.09
Increased analysis period range to improve on chart analysis
Modification to display of focus hooks on market info
バージョン 12.5 2023.02.28
Removed volume pressure threshold levels
バージョン 12.4 2023.02.23
Improvements to structure calculations to only show verified levels
バージョン 12.3 2023.02.22
Modifications to market info & volume info
Replaced volume pressure threshold level 30 with level 15
バージョン 12.2 2023.02.21
Modifications to volume pressure
バージョン 12.1 2023.02.20
Removed volume pressure threshold level
Modification to market info focus hooks
バージョン 12.0 2023.02.17
Added volume pressure threshold level 30
Added the minimum 10 pip risk to entry criteria
バージョン 11.9 2023.02.16
Removed volume pressure threshold level
Removed the10 pip minimum risk entry criteria
バージョン 11.8 2023.01.26
Changed structure from dynamic to static
Removed daily, weekly, monthly dynamic structure
Removed daily, weekly, monthly market info direction bias
Removed momentum tag
Added focus hooks on market info
Added volume pressure threshold of level 30 to assist in monitoring the bull & bear fight
バージョン 11.7 2022.12.07
Modifications to structure to include daily, weekly & monthly structure as well as their open (depending on which time frame you are on)
Modifications to volume pressure calculations to confirm if you have a valid setup
Modifications to market info to give you direction bias based on structure & daily, weekly or monthly open (depending on which time frame you are on)
バージョン 11.6 2022.11.11
Changed structure from fixed to dynamic
Added momentum tag to identify whether price is oscillating bullish | bearish
バージョン 11.5 2022.10.26
Modifications to analysis period
Modifications to market info calculations
Modifications to volume pressure calculations
Modifications to potential entry alert criteria
バージョン 11.4 2022.10.06
Modifications to volume info range
Modifications to entry alert criteria
バージョン 11.3 2022.09.29
Modifications to volume pressure calculations
Modifications to trade entry alert criteria
Reduced the default risk to 0.5%
バージョン 11.2 2022.09.27
Modifications to market info calculations
Modifications to volume info calculations
Modifications to structure calculations
バージョン 11.1 2022.09.14
Modifications to analysis period
Modifications to market info calculations
Doubled volume pressure analysis range
バージョン 11.0 2022.08.26
Modifications to entry criteria
Modifications to structure calculations
Modifications to market info calculations
Modifications to volume pressure calculations
Removed volume level threshold
バージョン 10.9 2022.08.19
Modifications to entry criteria
Modifications to market info calculations
Modifications to volume info calculations
Modification of volume level threshold from 15 to 100
バージョン 10.8 2022.08.09
Removed trend stripes
Modifications to entry criteria
Modifications to market info calculations
Modifications to volume info calculations
Added volume level 15 threshold
バージョン 10.7 2022.08.03
Removed average tag
Added trend stripes to market info to highlight overall market focus
Modifications to analysis period
Modifications to market info calculations
Modifications to structure calculations
Modifications to entry criteria
バージョン 10.6 2022.08.01
Added the average tag
Modifications to market info calculations
Modifications to volume pressure calculations
Modifications to entry criteria
バージョン 10.5 2022.07.30
Modifications to volume pressure calculations
Removed threshold level
Removed maximum volume level
バージョン 10.4 2022.07.27
Modifications to volume pressure calculations
Changed the volume pressure threshold from 25 to 30
Set the fixed maximum volume pressure to 60
バージョン 10.3 2022.07.26
Modifications to market info calculations
Added 25 level volume pressure threshold
バージョン 10.2 2022.07.24
Modifications to volume pressure calculations
バージョン 10.1 2022.07.22
Removed psychological structure
Removed moving average tag
Modifications to entry criteria
バージョン 10.0 2022.07.18
Changed from dynamic structure to fixed psychological structure levels
Removed bullish, bearish & neutral color change option
Default percent risk set to 1.0
バージョン 9.9 2022.06.21
Modifications to market info calculations
Changes in entry criteria
バージョン 9.8 2022.05.17
Changed banner to highlight trade risk relative to structure range
バージョン 9.7 2022.05.17
Added more structure levels
Added a banner to highlight no trading with narrow structure range
バージョン 9.6 2022.05.13
Added structure level to the entry criteria
Removed "pending" market info
バージョン 9.5 2022.05.06
Added a 200 MA close level tag on the chart
Added the MA to the entry criteria
バージョン 9.4 2022.05.05
Reduced the number of structure levels
Renamed the structure levels
Removed "pending" market info condition
Changes to entry criteria
バージョン 9.3 2022.05.04
Changed labels on levels to include overall structure focus
Changed structure level period as well as period visibility
Changed market info calculations
Included "pending" market condition to market info meaning "no trade zone"
Changed risk management period
Changed entry criteria parameters
バージョン 9.2 2022.04.28
Changed structure period
Included structure labels
バージョン 9.1 2022.04.27
Changed dynamic structure period
Changed structure zones to structure levels
バージョン 9.0 2022.04.26
Fixed structure code label issue
Fixed entry criteria errors
バージョン 8.9 2022.04.26
Removed some dynamic structure levels
Changed from structure level to structure zone
Change structure period
Changed market info calculations
Changed volume info period
Changed risk management period
バージョン 8.8 2022.04.21
Changed structure levels to structure zones
Changed analysis period, volume info & structure periods
Changed entry criteria
バージョン 8.7 2022.04.20
Changed structure from static to dynamic
Changed volume info calculations
バージョン 8.6 2022.04.14
Changed from dynamic structure to fixed structure
バージョン 8.5 2022.04.13
Renamed structure levels
Changed volume period
バージョン 8.4 2022.04.08
Added structure labels to know where price is on the chart
Modified entry criteria
Changed trade range to structure range
バージョン 8.3 2022.04.06
Changed period to volume info calculations
Added a filter to entry criteria
バージョン 8.2 2022.04.04
Complete structure overhaul from static to dynamic
Improvements to market info calculations
Minor adjustment to the entry criteria
Removed redundant code
バージョン 8.1 2022.03.30
Cleaned up the overall code by removing outdated code
Improvements to structure calculations for a slightly more high probability structure zones
バージョン 8.0 2022.03.30
Modified period to market info calculations
Adjustments to risk management tool
Modified period to volume info calculations
Modified period to structure calculations
バージョン 7.9 2022.03.25
Improvements to market info & volume info calculations
バージョン 7.8 2022.03.22
Improvements to volume info calculations
バージョン 7.7 2022.03.21
Improvements to market info calculations
バージョン 7.6 2022.03.16
Removed probability factor to buy & sell contract
Modifications to volume info
バージョン 7.5 2022.03.16
Modifications to volume info
Added a probability factor to buy & sell contracts
バージョン 7.4 2022.03.15
Improvements to market info calculations & risk management tool
バージョン 7.3 2022.03.14
Modifications to risk management tool
バージョン 7.2 2022.03.12
Modifications to risk management & volume info
バージョン 7.1 2022.03.11
Improvements to market info calculations
バージョン 7.0 2022.03.04
Fixed entry alert criteria
Improvements to market info calculations
バージョン 6.9 2022.03.04
Restructured the risk management tool for high probability trade setups
バージョン 6.8 2022.03.01
Improvements to volume info calculations
バージョン 6.7 2022.02.26
Revert from dynamic structure to fixed structure
バージョン 6.6 2022.02.23
Changes to structure naming
Extended structure period
バージョン 6.5 2022.02.22
Complete structure overhaul from static to dynamic
Improvements to market info & volume info calculations
Minor adjustment to the entry criteria
バージョン 6.4 2022.02.18
Improvements to market info calculations
バージョン 6.3 2022.02.18
Added a filter on the entry criteria
バージョン 6.2 2022.02.11
Improvements to structure calculations
バージョン 6.1 2022.02.10
Improvements to volume calculations
Modifications to entry criteria
バージョン 6.0 2022.01.31
Modified structure calculations
Changed volume pressure chart presentation
バージョン 5.9 2022.01.17
Minor adjustments to volume info calculations
バージョン 5.8 2022.01.17
Modifications to volume info calculations
バージョン 5.7 2022.01.04
Modification to market info calculations
バージョン 5.6 2021.12.23
Adjustments to analysis period
Modifications to market info
バージョン 5.5 2021.12.17
Modified time delay between alerts
Improvements to market info calculations
バージョン 5.4 2021.12.14
Modifications to market info calculations
バージョン 5.3 2021.12.13
Improvements to structure code
Modified trade entry criteria
バージョン 5.2 2021.12.11
Improvements to structure calculations
Modified entry criteria
Bug fixes
バージョン 5.1 2021.12.06
Improvements to structure calculations
Modifications to volume calculations
バージョン 5.0 2021.12.01
Improvements to market info calculations
Modifications to structure code
Added levels to volume info
バージョン 4.9 2021.11.26
Removed adjustable analysis period
バージョン 4.8 2021.11.26
Complete change to volume pressure calculations
Improvements to market info calculations
バージョン 4.7 2021.11.02
Modified entry criteria
Changed default color theme
Volume bar width set to 3
バージョン 4.6 2021.10.26
Fixed minor bug
バージョン 4.5 2021.10.22
Improvements to market info calculations
Stretched the volume info mapping to twice the analysis range
バージョン 4.4 2021.10.18
Modified market info, volume info & entry alert criteria
バージョン 4.3 2021.10.15
Modifications to market info calculations
Maximum analysis period allowed set to 200
バージョン 4.2 2021.10.14
Slight modification to structure calculations
バージョン 4.1 2021.10.13
Modified volume info calculations
Modified structure calculations
Maximum analysis period allowed in 300
バージョン 4.0 2021.09.29
Low severity bug fixed
Default analysis period set is 100
Minimum analysis period allowed is 20
Maximum analysis period allowed is 500
バージョン 3.9 2021.09.17
Removed average tag on chart
Modified entry criteria to include average tag as an additional filter
バージョン 3.8 2021.09.16
Set default analysis period to 180
Set the volume bars width to 2
バージョン 3.7 2021.09.13
Added a tag to show the moving average on your chart
バージョン 3.6 2021.08.18
Changes to volume calculations
Default analysis period set to 100
バージョン 3.5 2021.08.06
Adjustable analysis period
Analysis period default set to 200
バージョン 3.4 2021.08.06
Analysis period set to 50
バージョン 3.3 2021.06.25
Restored static structure
Removed dynamic structure
Removed long & short trading zones
バージョン 3.2 2021.06.24
Replaced dynamic structure with dynamic long & short trading zones
Changed line style on both the chart & the left hand panel
バージョン 3.1 2021.06.15
Volume info modifications
バージョン 3.0 2021.06.07
Modified volume calculations
バージョン 2.9 2021.06.04
Changed structure labels
バージョン 2.8 2021.05.27
Changes to line style for better visuals
バージョン 2.7 2021.05.26
Changed market info response from static to dynamic
バージョン 2.6 2021.05.25
Modification to market info calculations
Modification to entry criteria
Modification to structure period & levels
バージョン 2.5 2021.05.21
Complete overhaul of the entire structure system from static to dynamic
Removed analysis & volume period parameter changes - all are now pre-coded
Improvements of volume calculations
Changes to chart labels
バージョン 2.4 2021.05.07
Rectified volume info calculations
バージョン 2.3 2021.05.06
Modified volume info calculations
バージョン 2.2 2021.05.06
Modified entry criteria
バージョン 2.1 2021.05.04
Improvements to structure calculations
バージョン 2.0 2021.04.27
Improvements to volume info calculations
Added labels to risk management levels [take profit, entry zone & stop loss]
バージョン 1.9 2021.04.20
Adjustable volume period
バージョン 1.8 2021.04.20
Corrections to structure analysis
Adjustable analysis period with default set to 50 bars
バージョン 1.7 2021.04.17
Modified structure calculations
バージョン 1.6 2021.04.16
Analysis period & trade signal is set to non-adjustable
バージョン 1.5 2021.04.15
Adjustments to volume info calculations
Analysis period default set to 100 bars
バージョン 1.4 2021.04.14
Analysis period default set to 200 bars
バージョン 1.3 2021.04.07
Added volume info bars
Structure is now set to always show on chart
バージョン 1.2 2021.03.27
Modified Alert Parameters
バージョン 1.1 2021.03.24
Adjusted Market Info Calculations