Bullish CD LTB Osc
- ユーティリティ
- Igor Semyonov
- バージョン: 1.22
- アップデート済み: 5 4月 2020
- アクティベーション: 8
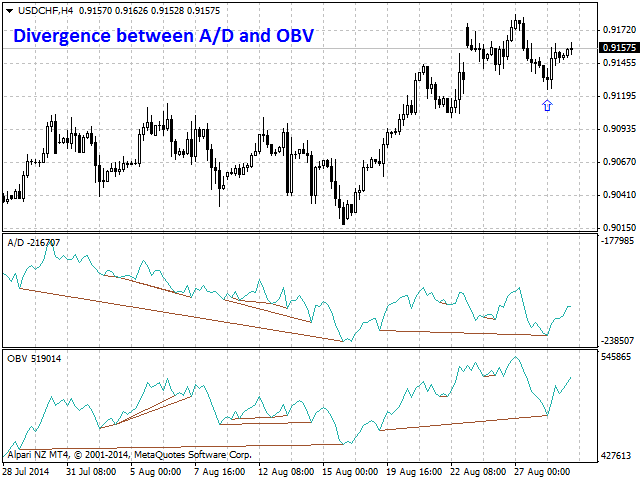
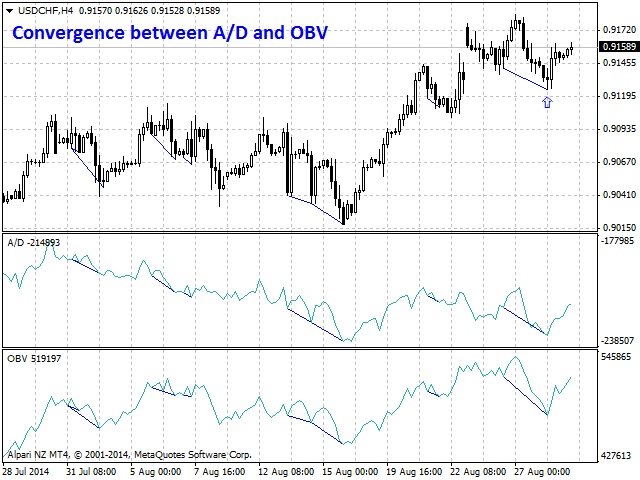
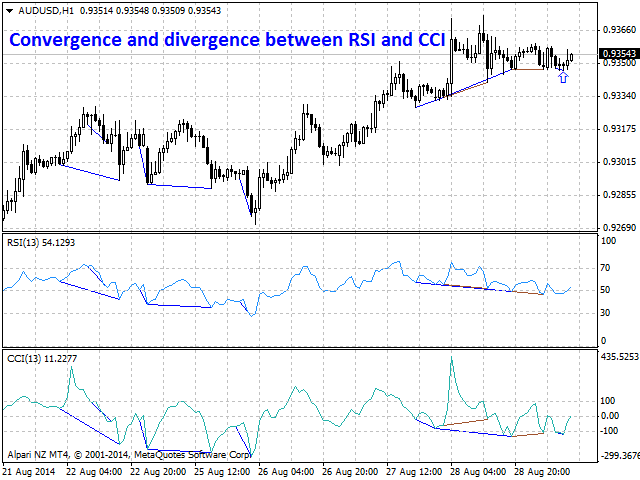
Information is a subject of the market mood. Information is objective when it comes from different sources. If information is identical then we may speak about its convergence. Otherwise, we may speak about its conflict (divergence). Indicators and oscillators are the sources of information for technical analysis.
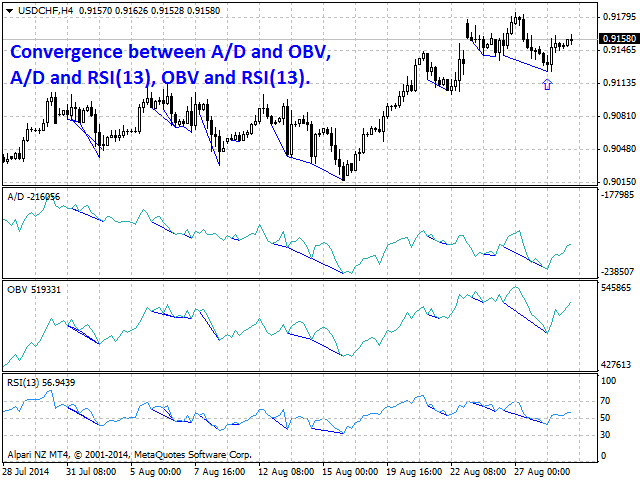
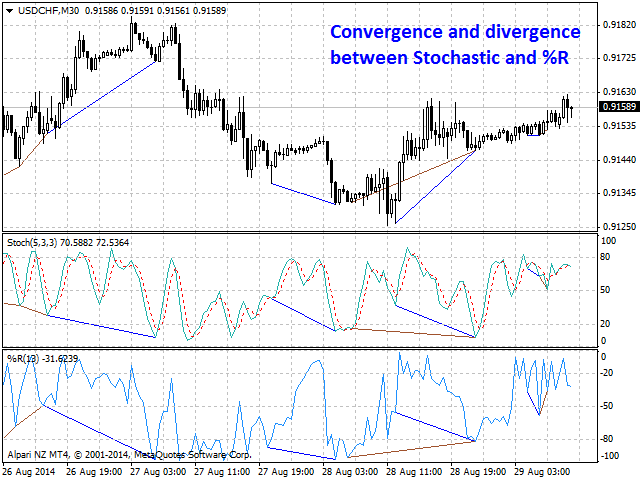
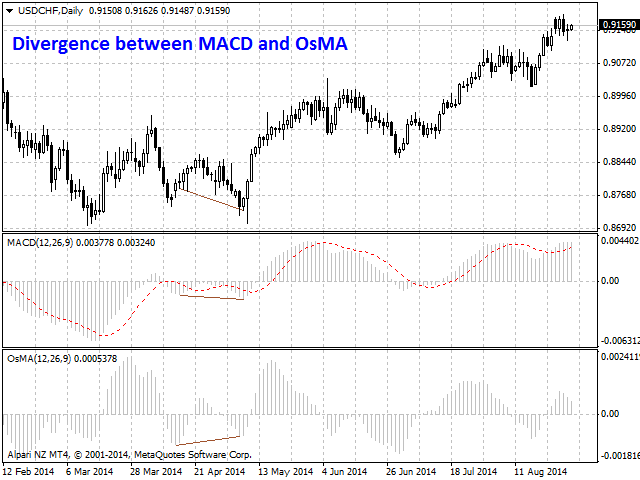
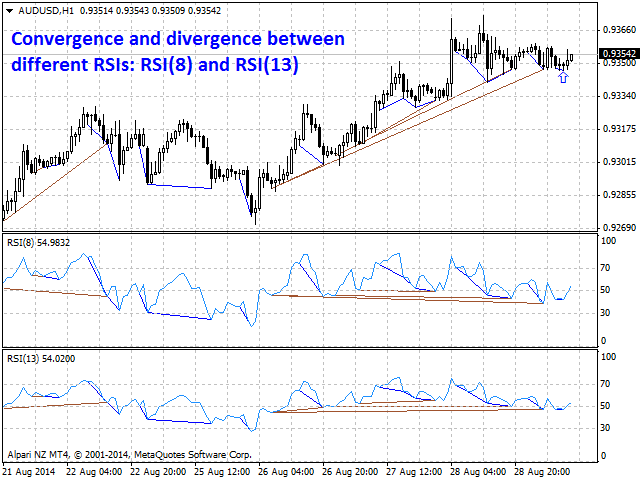
Bullish CD LTB Osc (Bullish Convergence/Divergence Low Top Bottom Oscillator) is a universal analytical bulls convergence/divergence indicator between any of the twenty three standard indicators included in МT4 package. The indicator is the second out of the two possible versions (LBT and LTB) of the bullish convergence/divergence origins.
Due to its multiple use feature, the indicator allows you to find convergences/divergences between various standard indicators simultaneously.
Users can select the sell graphical symbol and its width, as well as the color of convergence/divergence lines.
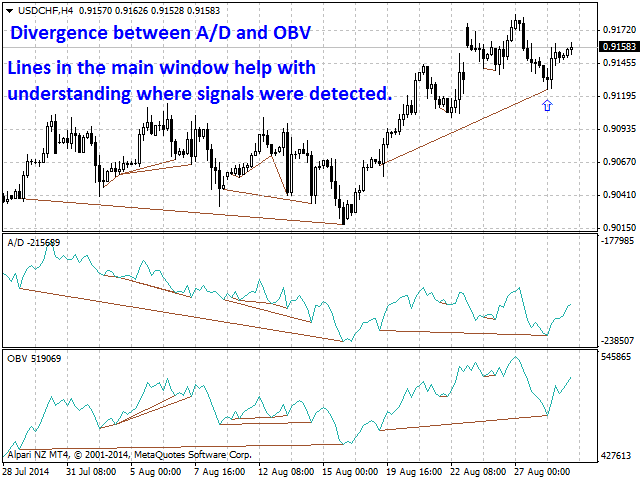
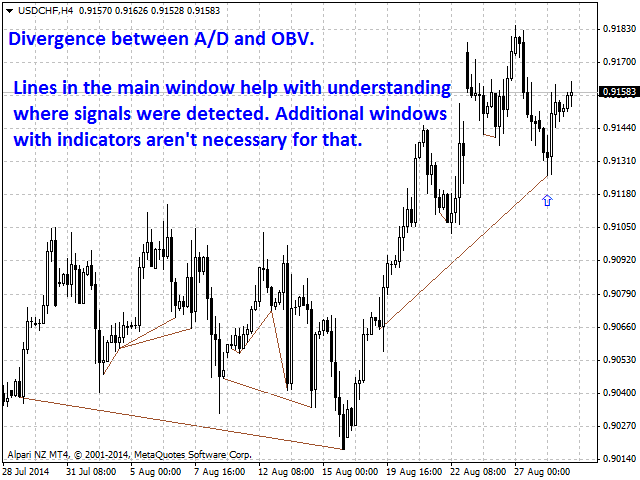
The indicator is not a lagging one. It works by ticks and is able to show convergence/divergence in the symbol's window even if there is no a separate window with a conventional indicator used for search. This allows you to open additional windows with any other indicators for a joint analysis.
As an option, the indicator can notify of a new signal using the graphical buy symbol instead of convergence/divergence lines.
In most cases, convergence/divergence is considered to be confirmed if it takes the form of a line with a graphical symbol remaining on the chart.
Attention: Since the indicator is downloaded, graphical symbols are displayed in the main window only after a new convergence/divergence signal appears (unlike convergence/divergence lines). Graphical symbols are not displayed for the past periods (before the indicator was downloaded).
If convergence/divergence lines are absent in the main window after launching the indicator, keep switching timeframes, till they are detected. Absence of lines indicates the absence of convergence/divergence on the current timeframe. If the lines are present only in the main window, but not in the additional one, you should recheck the type and the specified parameters of the basic indicator, for which you want to find convergence/divergence.
The indicator's operation is displayed in the attached video.
The indicator can notify of the appearance of a formed signal by playing an audio signal, as well as display the time remaining until the end of the formation of the current bar in the format of <d:h:m:s, where:
- < - the current bar.
- d - days.
- h - hours.
- m - minutes.
- s - seconds.
Sample e-mail notification:
- Subject: Bullish CD LTB Signal
- Message: Signal,M30 - Bullish Convergence between EURUSD and A/D - 2014.08.06 10:18:00
Purpose
The indicator can be used for manual or automated trading within an Expert Advisor. For automated trading, use the indicator buffer of the double type:
- Buy signal - buffer 0, must not be zero.
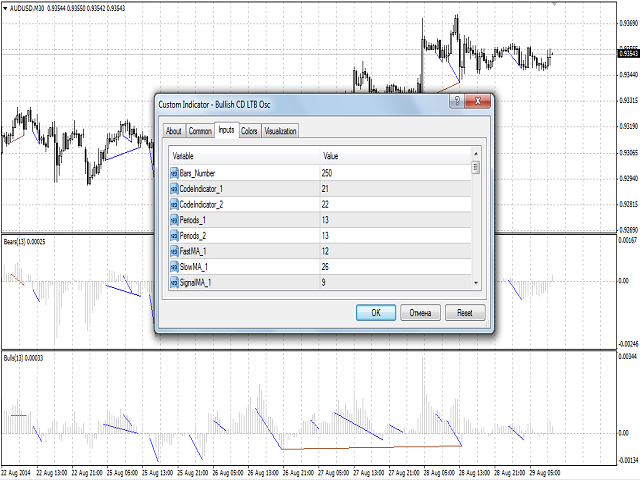
Input Parameters
- Bars_Number - number of bars for calculation.
- CodeIndicator_1 - code of the first basic indicator:
- 0 - AD (an indicator of accumulation and distribution of volume) - (default).
- 1 - OBV (On Balance Volume).
- 2 - Volume (tick volume indicator).
- 3 - Force (Force Index indicator).
- 4 - %R (Bill Williams oscillator).
- 5 - ATR (Average True Range).
- 6 - CCI (Commodity Channel Index).
- 7 - DeMarker (DeMarker indicator).
- 8 - BW MFI (Market Facilitation Index).
- 9 - MFI (Money Flow Index).
- 10 - Momentum (Momentum indicator).
- 11 - RSI (Relative Strength Index).
- 12 - RVI (Relative Vigor Index).
- 13 - Standard Deviation.
- 14 - Stochastic.
- 15 - ADX (Average Directional Movement indicator).
- 16 - AC (indicator of acceleration).
- 17 - AO (Williams' oscillator).
- 18 - Gator (Bill Williams' Alligator).
- 19 - MACD (moving average convergence/divergence).
- 20 - OsMA (moving average of oscillator).
- 21 - BearsPower.
- 22 - BullsPower.
- CodeIndicator_2 - code of the second basic indicator:
- 0 - AD (an indicator of accumulation and distribution of volume) - (default).
- 1 - OBV (On Balance Volume).
- 2 - Volume (tick volume indicator).
- 3 - Force (Force Index indicator).
- 4 - %R (Bill Williams oscillator).
- 5 - ATR (Average True Range).
- 6 - CCI (Commodity Channel Index).
- 7 - DeMarker (DeMarker indicator).
- 8 - BW MFI (Market Facilitation Index).
- 9 - MFI (Money Flow Index).
- 10 - Momentum (Momentum indicator).
- 11 - RSI (Relative Strength Index).
- 12 - RVI (Relative Vigor Index).
- 13 - Standard Deviation.
- 14 - Stochastic.
- 15 - ADX (Average Directional Movement indicator).
- 16 - AC (indicator of acceleration).
- 17 - AO (Williams' oscillator).
- 18 - Gator (Bill Williams' Alligator).
- 19 - MACD (moving average convergence/divergence).
- 20 - OsMA (moving average of oscillator).
- 21 - BearsPower.
- 22 - BullsPower.
- Periods_1 - calculation period of the first basic indicator.
- Periods_2 - calculation period of the second basic indicator.
- FastMA_1 - fast Moving Average calculation period for the first basic MACD or OsMA.
- SlowMA_1 - slow Moving Average calculation period for the first basic MACD or OsMA.
- SignalMA_1 - calculation period of the first basic MACD or OsMA indicator's signal line.
- FastMA_2 - fast Moving Average calculation period for the second basic MACD or OsMA.
- SlowMA_2 - slow Moving Average calculation period for the second basic MACD or OsMA.
- SignalMA_2 - calculation period of the second basic MACD or OsMA indicator's signal line.
- KPeriod_1 - К period of the first basic Stochastic.
- DPeriod_1 - D period of the first basic Stochastic.
- Slowing_1 - Slowing period of the fist basic Stochastic.
- Stoch_Price_1 - basic Stochastic's price type of the first indicator:
- Low/High (by default).
- Close/Close.
- Price_Field_1 - Stochastic averaging type of the first indicator:
- Simple.
- Exponential (by default).
- Smoothed.
- Linear weighted.
- KPeriod_2 - К period of the second basic Stochastic.
- DPeriod_2 - D period of the second basic Stochastic.
- Slowing_2 - Slowing period of the second basic Stochastic.
- Stoch_Price_2 - basic Stochastic's price type of the second indicator:
- Low/High (by default).
- Close/Close.
- Price_Field_2 - Stochastic averaging type of the second indicator:
- Simple.
- Exponential (by default).
- Smoothed.
- Linear weighted.
- Jaw_Period_1 - blue line (Alligator's Jaws) averaging period of the the first basic indicator.
- Jaw_Shift_1 - the first basic indicator's blue line shift relative to the price chart.
- Teeth_Period_1 - red line (Alligator's Teeth) averaging period of the first basic indicator.
- Teeth_Shift_1 - the first basic indicator's red line shift relative to the price chart.
- Lips_Period_1 - green line (Alligator's Lips) averaging period of the first basic indicator.
- Lips_Shift_1 - the first basic indicator's green line shift relative to the price chart.
- Jaw_Period_2 - blue line (Alligator's Jaws) averaging period of the the second basic indicator.
- Jaw_Shift_2 - the second basic indicator's blue line shift relative to the price chart.
- Teeth_Period_2 - red line (Alligator's Teeth) averaging period of the second basic indicator.
- Teeth_Shift_2 - the second basic indicator's red line shift relative to the price chart.
- Lips_Period_2 - green line (Alligator's Lips) averaging period of the second basic indicator.
- Lips_Shift_2 - the second basic indicator's green line shift relative to the price chart.
- Applied_Price_1 - the price of the first indicator used:
- Close price (by default).
- Open price.
- High price.
- Low price.
- Median price.
- Typical price.
- Weighted price.
- MA_Method_1 - method of averaging for the first indicator:
- Simple.
- Exponential (by default).
- Smoothed.
- Linear weighted.
- Mode_1 - the index of the line (MAIN - 0 (by default) or SIGNAL - 1) of the first basic indicator, based on which ADX, RVI, Stochastic, Gator or MACD are calculated.
- Applied_Price_2 - the price of the second indicator used:
- Close price (by default).
- Open price.
- High price.
- Low price.
- Median price.
- Typical price.
- Weighted price.
- MA_Method_2 - method of averaging for the second indicator:
- Simple.
- Exponential (by default).
- Smoothed.
- Linear weighted.
- Mode_2 - the index of the line (MAIN - 0 (by default) or SIGNAL - 1) of the second basic indicator, based on which ADX, RVI, Stochastic, Gator or MACD are calculated.
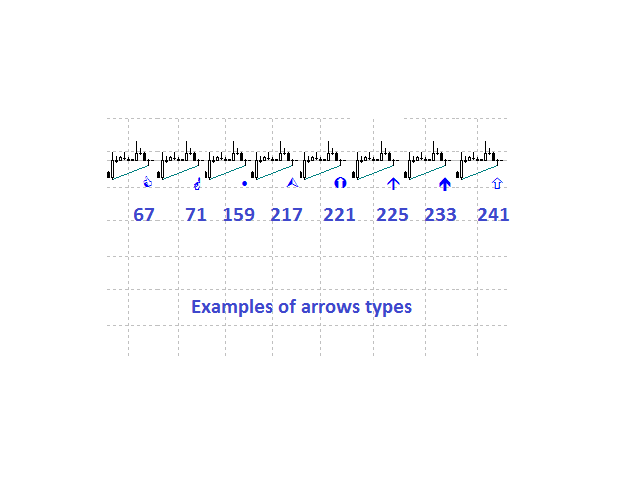
- Arrow_Symbol - graphical sell symbol type (recognizes one of the eight user-defined symbols, see the screenshot):
- 67
- 71
- 159
- 217
- 221
- 225 (by default)
- 233
- 241
- Arrow_Width - graphical symbol width (allowable values - 1, 2, 3, 4 and 5).
- Sound_Mail_Numbers - number of audio and e-mail notifications on the last two bars.
- DrawLineChart - display of convergence/divergence line in the main window.
- true - draw the lines (by default).
- false - do not draw the lines.
- DrawLineInd - display of convergence/divergence line in separate windows.
- true - draw the lines (by default).
- false - do not draw the lines.
- Convergence - calculating convergence or divergence:
- true - convergence (by default).
- false - divergence.
- Ideal_Searching - searching onvergence/divergence in non-ideal conditions:
- true - ideal search conditions (by default).
- false - non-ideal search conditions.
- Play_Sound - enable/disable sound notification.
- Show_Time - displaying time remaining until the formation of the current bar.
- Send_Mail - send an e-mail notification.
- ConvMainLevelColor - color of the convergence line in the main window.
- DivMainLevelColor - color of the divergence line in the main window.
- ConvLevelColor_1 - color of the convergence line in the first indicator window.
- ConvLevelColor_2 - color of the convergence line in the second indicator window.
- DivLevelColor_1 - color of the divergence line in the first indicator window.
- DivLevelColor_2 - color of the divergence line in the second indicator window.