• 概要
  • レビュー
  • コメント (1)

LevelFractal

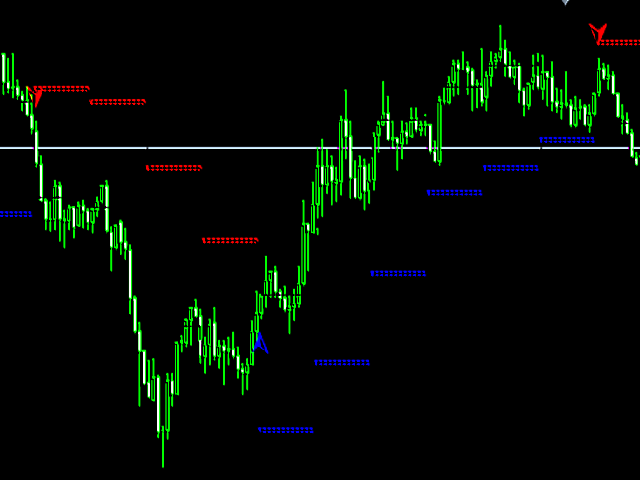
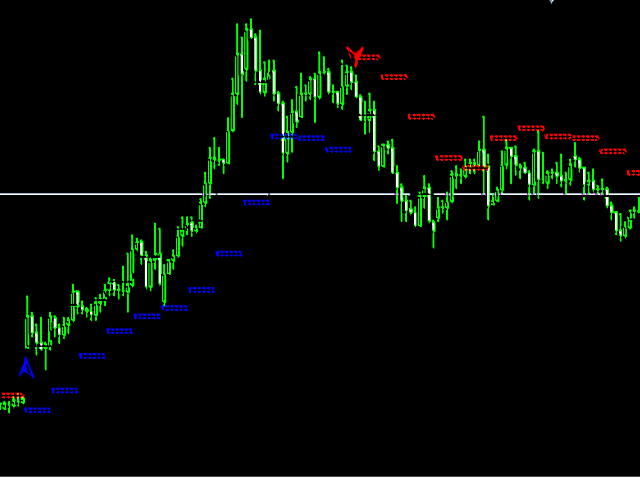
Индикатор LevelFractal - разработан на основе всем известного индикатора Fractal, он берет значения нескольких ближайших к текущей свече фракталов, вычисляет некое среднее значение и, исходя из него строит уровни поддержки и сопротивления. Когда цена пробивает один из этих уровней, появляется сигнал или на покупку или на продажу, на графике они обозначаются стрелками. Индикатор работает на любом таймфрейме и на валютной паре.

По вопросам приобретения полной версии пишите в личку.

おすすめのプロダクト
The BB Reversal Arrows technical trading system has been developed to predict reverse points for making retail decisions. The current market situation is analyzed by the indicator and structured for several criteria: the expectation of reversal moments, potential turning points, purchase and sale signals. The indicator does not contain excess information, has a visual understandable interface, allowing traders to make reasonable decisions. All arrows appear to close the candle, without redr
The   True Magic Oscillator   indicator is designed for signal trading. This indicator generates trend signals. It uses many algorithms and indicators to generate this signal. It tries to generate signals from the points with the highest trend potential. This indicator is a complete trading product. This indicator does not need any additional indicators. The indicator is never repainted. The point at which the signal is given does not change.         Features and Recommendations Wor
The perfect tool for Scalng in the Forex markets You can trade both from signal to signal and using take profit  The algorithm does not use Zigzag!  No redrawing!  This is a channel instrument that uses a moving average as a filter. Moving Average  There are 2 parameters for the settings Ma Period = 5 period Moving Average  Channel 1.0 distance of channel lines from the chart Price Signal Filter - calculation of signal opening and filter There is a complete set of Alert There is a multi-timefram
Perfect for one minutes high trading and scalping. This indicator is very effective for trading on one minutes, in the hour. A combination of moving averages and STOCHASTICS calculation to produce a very convincing signal every hour. Blue colour signals a buy opportunity. Follow the X signs for possible buy points. The Blue average line serves as possible trend direction and support. Red colour signals a sell opportunity. Follow the X signs for possible sell points. The Red average line serves a
Credible Cross System   indicator is designed for signal trading. This indicator generates trend signals. It uses many algorithms and indicators to generate this signal. It tries to generate a signal from the points with the highest trend potential. The indicator works based on instant price movements. This indicator is a complete trading product. This indicator does not need any additional indicators. The indicator certainly does not repaint. The point at which the signal is given does not
ブレイクアウトプロスカルパーソリューション このインジケーターはRPTradeProSolutionsシステムの一部です。 Breakout Pro Scalper Solutionは、プライスアクション、ダイナミックサポート、レジスタンスを使用した毎日のトレンドインジケーターです。 誰でも使用できるように設計されており、トレーディングの初心者でも使用できます。 決して塗り直さないでください。 表示は近いものから近いものへと示されます。 単独で使用するように設計されているため、他のインジケーターは必要ありません。 一日の初めにトレンドと潜在的なテイクプロフィットを提供します。 特定のグラフは、履歴データによる潜在的な利益を示しています。 どのように機能しますか Breakout Pro Scalper Solutionは、価格アクションと動的なサポートおよびレジスタンスを組み合わせたブレイクアウト戦略を使用しています。 夜のトレンドとボラティリティが分析され、翌日に使用されます。 この分析から、ブレイクアウト制限(青と濃いオレンジの線)とTakeProfitが決定されます
Renko, Heiken Ashi, Ticks Bar, Range Bar.    Easy switching, easy setup, all in one window.        Place the Custom Chart indicator and view Renko, Heiken Ashi, Tick bar, Range bar charts in real time at real chart.    Position the offline chart window so that the indicator control panel is visible.    Switch the chart mode by click of a button.    Connect to the output chart any indicator, expert advisor without any restrictions.    No, it doesn't work in the tester.    Yes, you can use an
The Hurricane Cave Indicator shows different trade areas based on price action. It looks in the past and works out patterns that can enforce support and resistance as targets. When price breaks out of a trade area you can target just inside the next trade area. If you can't see the target just go to a slower time frame, it means the price hasn't been there for a long time. The Hurricane Cave Indicator is designed to be an add on to The Hurricane Forex Indicator also available in the Meta Trader
FREE
Automated Trendlines
Georgios Kalomoiropoulos
5 (16)
トレンドラインは、外国為替取引におけるテクニカル分析の最も重要なツールです。残念ながら、ほとんどのトレーダーはそれらを正しく描画していません。自動トレンドラインインジケーターは、市場のトレンドの動きを視覚化するのに役立つ本格的なトレーダー向けのプロフェッショナルツールです。 トレンドラインには、強気トレンドラインと弱気トレンドラインの2種類があります。 上昇トレンドでは、外国為替トレンドラインは価格変動の最低スイングポイントを介して描画されます。 少なくとも2つの「最低安値」を接続すると、トレンドラインが作成されます。 下降トレンドでは、トレンドラインは価格変動の最も高いスイングポイントを介して描画されます。 少なくとも2つの「最高値」を接続すると、トレンドラインが作成されます。 トレンドラインが壊れたとき? 弱気のろうそくが強気のトレンドラインの下で閉じ、ろうそくの高さがトレンドラインの上にあるとき、強気のトレンドラインは壊れます。 強気のろうそくが弱気のトレンドラインの上で閉じ、ろうそくの安値がトレンドラインの下にあるとき、弱気のトレ
Trade with super Support and Resistance Breakout system. are you looking for the most sophisticated tools for your daily trading ? this tools are perfect for you, it has a most comprehensive breakout identification spot on all market (Forex, CFD, indice, etc) Limited offer :  10 copy for 30$ Indicator parameter: Depth: to arrange how deep to calculates the support and resistance zone Deviation Back-step the demonstration result you can see on the media file below.
Добрый День уважаемые трейдеры!  Вашему вниманию индикатор созданный и работающий на базе трендовика ADX,  для торговли на смене направления движения который учитывает коррекцию и даёт возможность на ней заработать.  Применяю этот индикатор для скальпинга. Рекомендую таймфреймы от 15 ти минутного(М15) до часового (Н1) периодов.  Красный кружок сигнал на продажу- Sell) Зелёный кружок  сигнал на покупку Buy) Чем меньше ваш таймфрейм тем меньше пунктов вы зарабатываете.   Важно выставлять стопы! !В
Owl smart levels
Sergey Ermolov
4.63 (54)
MT5版  |   FAQ Owl Smart Levels Indicator   は、 Bill Williams   の高度なフラクタル、市場の正しい波構造を構築する Valable ZigZag、エントリの正確なレベルをマークする Fibonacci レベルなどの一般的な市場分析ツールを含む 1 つのインジケーター内の完全な取引システムです。 利益を得るために市場と場所に。 戦略の詳細な説明 インジケータを操作するための指示 顧問-取引助手 プライベートユーザーチャット ->購入後に私に書いて、私はプライベートチャットにあなたを追加し、あなたはそこにすべてのボーナスをダウンロードすることができます 力はシンプルさにあります! Owl Smart Levels   取引システムは非常に使いやすいので、専門家にも、市場を勉強し始めて自分で取引戦略を選択し始めたばかりの人にも適しています。 戦略と指標に秘密の数式や計算方法が隠されているわけではなく、すべての戦略指標は公開されています。 Owl Smart Levels を使用すると、取引を開始するためのシグナルをすばやく確認し、
まず第一に、この取引インジケーターは再描画されず、再描画されず、遅延しないことを強調する価値があります。これにより、手動取引とロボット取引の両方に理想的なものになります。 アトミックアナリストは、価格の強さとモメンタムを利用して市場でより良いエッジを見つけるためのPA価格アクションインジケーターです。ノイズや誤ったシグナルを除去し、取引ポテンシャルを高めるための高度なフィルターを備えています。複雑なインジケーターの複数のレイヤーを使用して、アトミックアナリストはチャートをスキャンし、複雑な数学的計算をシンプルなシグナルと色に変換します。これにより、どのような初心者トレーダーでも理解して使用し、一貫した取引の決定を行うことができます。 「アトミックアナリスト」は、新規および経験豊富なトレーダー向けにカスタマイズされた包括的な取引ソリューションです。プレミアムインジケーターとトップノッチの機能を1つの取引戦略に組み合わせ、すべてのタイプのトレーダーにとって汎用性のある選択肢にします。 デイリートレーディングとスキャルピング戦略:高速で正確なデイトレーディングおよび短期トレード
The presented indicator allows you to determine potential entry points into the market and set protective orders at reasonable levels. This product can be useful for both beginners and experienced traders. The indicator is based on calculation methods proven by time and practicing traders. The indicator is calculated in two stages: At the first stage, linear regression (LR) of the selected price type is determined for a given number of chart periods. At the second stage, the obtained data is p
A scalping indicator based on mathematical patterns, which on average gives signals with relatively small SL, and also occasionally helps to catch big moves in the markets (more information in the video) This indicator has three main types of notifications: The first type warns of a possible/upcoming signal on the next bar The second type indicates the presence of a ready signal to enter the market/open a position The third type is for SL and TP levels - you will be notified every time price r
The indicator shows you buy/sell signals and does not repaint. It works well with almost all pairs, while the best ones are GBPUSD, XAUUSD and EURUSD. The product works better on H1 and H4. You can change the parameters in the inputs tab to get the best signals and the best trade results on each pair. You can enable/disable alerts when signal appears. The indicator is easy to use. Parameters barstrip & Sensitive: amount of bars to process the highest and lowest prices (relates to the internal
Embark on the pinnacle of Binary Options evolution. Our indicator isn't just adaptive—it's relentless. Picture a ninja riding a serpent, shadowing its every move; that's how this tool trails the market trend, unwavering till the end. Built upon the foundational prowess of the Ichimoku indicator and honed with an array of fine-tuned oscillators, it epitomizes accuracy and precision. Dive deep without getting lost in the Ichimoku's intricacies—our indicator simplifies the process for you. Perhaps
Binary Options Support Resistance Indicator This indicator is designed for binary options trading and effectively shows retracements from support and resistance levels. Signals appear on the current candle. A red arrow pointing downwards indicates a potential selling opportunity, while a blue arrow pointing upwards suggests buying opportunities. All that needs adjustment is the color of the signal arrows. It is recommended to use it on the M1-M5 timeframes as signals are frequent on these timef
Dark Sniper arrow indicator. complete lack of redrawing percentage of correct indicator predictions from 80 85% The arrow indicates the direction of the next candle and the possible direction of the trend in the future.  suitable for small m1 timeframes. It is recommended to open deals from 1 to 2 candles. The signal appears on the last candle advantages of the indicator: 1. leading signals. 2.complete lack of redrawing 3. high signal accuracy.
The King of Forex Trend Cloud Indicator is a trend following indicator based on moving averages. The Indicator is meant to Capture both the beginning and the end of a trend. This indicator can be used to predict both short and long terms market trends.  The king of Forex Trend Cloud if paired together with the King of Forex Trend Indicator can give a broad picture in market analysis and forecasts. I have attached images for both the  The king of Forex Trend Cloud on its own and  The king of Fore
Trend PA
Mikhail Nazarenko
5 (3)
The Trend PA indicator uses   Price Action   and its own filtering algorithm to determine the trend. This approach helps to accurately determine entry points and the current trend on any timeframe. The indicator uses its own algorithm for analyzing price changes and Price Action. Which gives you the advantage of recognizing, without delay, a new nascent trend with fewer false positives. Trend filtering conditions can be selected in the settings individually for your trading style. The indicator
矢印を再描画しない外国為替スキャルピング インジケーター。 M5、M15、M30、H1 の時間枠で最適に機能します。デフォルト設定は M5 時間枠用です。下の図は、「期間 = 0.35」パラメーター値を使用して H1 チャートで作業する例を示しています。デモ版をダウンロードして、自分でテストできます。現在、ほとんどすべてのスキャルピング戦略でこのインジケーターのシグナルを使用しています。私たちの計算によると、そのシグナルの精度は時間枠に応じて約 95% です。このインジケーターは、すべての通貨ペアで機能します。すべての主要通貨ペアと金属でテストしました。どこでも±95%のほぼ同じ精度が得られました。 インジケーターの利点: 矢印を再描画しません すべての通貨ペアで動作します 高い信号精度 スキャルピングに良い インジケーターの設定: period - 信号精度を計算するための期間。 price - インジケーターにどの価格を使用するかを指示します: CLOSE、OPEN、HIGH、LOW。デフォルトでは、インディケータは CLOSE 価格で動作します。
Trend Line Chart Pattern Signals  Is a traders Tool for Signals based on Strong  Patterns Formed By a pair of robust trend lines. They FOR WITH DIFFERENT POPULAR PATTERNS ON CHARTS LIKE – TRIANGLES, FLAGS,RANGE , ASCENDING TRIANGLES, DESCENDING PATTERNS, PENNANTS ETC. The TREND LINES  form  dynamically  on running bars. The  sensitivity  of the trend lines can be changed by custom settings. The  Buy and Sell Signals Generate upon Break Of the Trend Line + "Close" of the same bar above the previo
Trend Scanner
Vladimir Kalendzhyan
4.38 (8)
By purchasing this indicator, you have the right to receive a free copy of one of   my other indicator's or advisor’s!  (All future updates are included. No limits) . To get it , please contact me by  mql5 message ! The Trend Scanner trend line indicator displays the trend direction and its changes. The indicator works on all currency pairs and  timeframes. The indicator simultaneously displays multiple readings on the price chart: the support and resistance lines of the currency pair, the exist
Chart Patterns Detect 15 patterns (Ascending Triangle, Descending Triangle, Rising Wedge, Falling Wedge, Bullish Flag, Bearish Flag, Bullish Rectangle, Bearish Rectangle Symmetrical triangle, Head and Shoulders, Inverted Head and Shoulders, Triple top, Triple Bottom, Double Top, Double Bottom) Use historical data to calculate the probability of each pattern to succeed (possibility to filter notification according to the chance of success) gives graphic indication about the invalidation level and
This indicator monitors the market for a flat state and possible breakout. The flat state is detected as a predefined number of consecutive bars during which price fluctuates inside a small range. If one of the next bars closes outside the range, breakout is signaled. The indicator shows 3 lines: blue - upper bound of flat ranges AND consecutive breakout areas; red - lower bound of flat ranges AND consecutive breakout areas; yellow - center of flat ranges (NOT including breakout areas). When a b
The indicator is designed for binary options and short-term transactions on Forex To enter a trade when a signal appears blue up arrow buy red down arrow sell signal For Forex enter on a signal exit on the opposite signal or take profit For binary options Enter on 1 candle, if the deal goes negative, set a catch on the next candle Works on all timeframes If you apply a filter like Rsi, you will get a good reliable strategy.. The algorithm is at the stage of improvement and will be further develo
Fx Perfect Signal indicator is designed for signal trading. This indicator generates trend signals.  It uses many algorithms and indicators to generate this signal. It tries to generate a signal from the points with the highest trend potential. This indicator is a complete trading product. This indicator does not need any additional indicators.  The indicator certainly does not repaint. The point at which the signal is given does not change.  Thanks to the alert features you can get the signals
ナイト ゴースト - バイナリ オプションの矢印インジケーター。 これからのあなたの頼もしいアシスタントです! 11 - チャートの再描画なし - すべての通貨ペアで大活躍! -インジケータの精度は最大 90% (特に夜間) ・長時間の設定不要(バイナリーオプションに最適な設定) - 信号が遅れない - 現在のローソク足でのシグナルの出現 ・M1期にピッタリ(No More!) ・目に優しいキャンドルカラー(赤・青) -インストールされたアラート それを扱う: - 青い矢印は信号アップを示します -赤い下向き矢印 M1 以上のインジケーターをチャートに配置しないでください. シグナルの精度が低下します! インジケーターのスクリーンショットとビデオを見る
「Adjustable Fractals」 - フラクタルインジケーターの高度なバージョンで、非常に便利な取引ツールです。 ご存知のとおり、標準フラクタル mt4 インジケーターには設定がまったくありません - これはトレーダーにとって非常に不便です 調整可能なフラクタルはその問題を解決しました - 必要な設定がすべて含まれています。 インジケーターの期間を調整可能 (推奨値 - 7 以上) 価格の高値/安値からの距離を調整可能 フラクタル矢印に合わせてデザインを調整可能 // さらに優れたエキスパートアドバイザーとインジケーターはここから入手できます: https://www.mql5.com/en/users/def1380/seller // また、収益性が高く、安定していて信頼性の高いシグナル https://www.mql5.com/en/signals/1887493 に参加することも歓迎します。 当MQL5サイトのみでご提供しているオリジナル商品です。
このプロダクトを購入した人は以下も購入しています
驚異的なFXインジケーター「Miraculous」をご紹介します。完璧な結果を得るための1時間足を含むすべてのタイムフレームで効果的に機能する、最強の強力な特殊MT4フォレックスインジケーターです。 すべてのタイムフレームで優れた結果を提供する最高のFXインジケーターを探し続けるのに疲れましたか?これ以上探す必要はありません!「Miraculous」フォレックスインジケーターをご紹介します。このインジケーターは、トレーディングの経験を変革し、収益を新たなレベルに引き上げるために設計されました。 先進のテクノロジーと長年にわたる緻密な開発に基づいて構築された「Miraculous」フォレックスインジケーターは、FX市場における力と正確さの頂点となります。この素晴らしいツールは、すべてのレベルのトレーダーのニーズを満たすように設計されており、一貫した収益性を追求する上で比類のない優位性を提供します。 「Miraculous」フォレックスインジケーターの他との違いは、その非常に適応性にあります。デイトレーダー、スウィングトレーダーであろうと、長期ポジションを好む方であろうと、このインジケータ
TrendMaestro
Stefano Frisetti
5 (2)
note: this indicator is for METATRADER4, if you want the version for METATRADER5 this is the link: TRENDMAESTRO recognizes a new TREND in the bud, he never makes mistakes. The certainty of identifying a new TREND is priceless. DESCRIPTION TRENDMAESTRO identifies a new TREND in the bud, this indicator examines the volatility, volumes and momentum to identify the moment in which there is an explosion of one or more of these data and therefore the moment in which prices have strong probability of f
How to use Pair Trading Station Pair Trading Station is recommended for H1 time frame and you can use it for any currency pairs. To generate buy and sell signal, follow few steps below to apply Pair Trading Station to your MetaTrader terminal. When you load Pair Trading Station on your chart, Pair Trading station will assess available historical data in your MetaTrader platforms for each currency pair. On your chart, the amount of historical data available will be displayed for each currency pai
Indicator : RealValueIndicator Description : RealValueIndicator is a powerful tool designed specifically for trading on the EURUSD pair. This indicator analyzes all EUR and USD pairs, calculates their real currency strength values, and displays them as a single realistic value to give you a head start on price. This indicator will tell you moves before they happen if you use it right. RealValueIndicator allows you to get a quick and accurate overview of the EURUSD currency pair tops and bottoms,
ON Trade Waves Patterns Harmonic Elliot Wolfeをご紹介します。これは手動および自動の方法を使用して市場のさまざまなパターンを検出するために設計された高度なインジケーターです。以下はその動作方法です: ハーモニックパターン: このインジケーターは、チャートに表示されるハーモニックパターンを識別できます。これらのパターンは、Scott Carneyの「Harmonic Trading vol 1および2」で説明されているように、ハーモニックトレーディング理論を実践するトレーダーにとって重要です。手動で描画するか、自動検出に頼るかにかかわらず、ON Trade Waves Patternsがお手伝いします。 コントロールパネル: このインジケーターはユーザーフレンドリーなコントロールパネルを備えています。チャートと時間枠の設定を保存し、異なる構成間をスムーズに切り替えることができます。チャートスペースを最大限に活用するために最小化することもできます。他の分析ツールで作業することを好む場合、閉じるボタンをクリックするだけで、すべてのインジケーターデ
もちろんです。以下は、提供いただいたテキストの日本語への翻訳です: MT4用の天文学指標をご紹介します:究極の天体トレーディングコンパニオン トレーディング体験を天空の高みに高める準備はできていますか?私たちの革命的なMT4用の天文学指標をご紹介します。この革新的なツールは、複雑なアルゴリズムの力を借りて、類まれなる天文学的洞察と精密な計算を提供します。 あなたの指先で宇宙の情報を: 宝のような天文学的データが明らかになる包括的なパネルをご覧ください。惑星の地理的/太陽中心座標、太陽と地球の距離、星の大きさ、伸び、星座、黄道座標および赤道座標、さらには水平座標まで、それぞれが綿密に計算され美しく表示されています。指標によって生成される垂直線は時間値に対応し、トレーディングの旅に宇宙の視点を提供します。 惑星のラインと関係: グラフを飾る惑星のラインの魔法を体験し、スケールと角度をカスタマイズできます。直感的なコントロールパネルを介して各惑星のラインの表示を簡単に切り替えることができます。指定された時刻範囲内での合会、六分会、四分会、三分会、対会、逆行の指標で天体の関係の芸術を発見してく
このインジケータは、手動および自動的な方法でチャートに描かれたハーモニックパターンを検出します。ユーザーマニュアルは、このリンクから参照できます: あなたのレビューを追加し、入手するために私たちに連絡してください。 この製品をmt4で試すための無料版があります。 GartleyおよびNenstarパターンを検出するために使用できます。 https://www.mql5.com/en/market/product/30181 完全なMT4バージョンを購入するには、次の場所から購入できます。 https://www.mql5.com/en/market/product/15212 注 インジケータにはコントロールパネルがあり、すべての(チャート&時間枠)設定が保存されます。チャート上でスペースをより多く確保するために、最小化することができ、他の分析ツールで作業する場合は、すべてのインジケータデータを非表示にするために閉じるボタンを押すことができます。 このインジケータを使用して設定を変更し、移動平均やボリンジャーバンドなどのインジケータを追加すると、編集のテンプレートが自動的に保存され、必
PZ Day Trading
PZ TRADING SLU
3.67 (3)
このインディケータは、価格アクション分析とドンチャンチャネルのみを使用して、ジグザグ方式で価格の反転を検出します。再描画やバックペインティングを一切行わずに、短期取引向けに特別に設計されています。それは彼らの操作のタイミングを増やすことを目指している賢明なトレーダーにとって素晴らしいツールです。 [ インストールガイド | 更新ガイド | トラブルシューティング | よくある質問 | すべての製品 ] 驚くほど簡単に取引できます すべての時間枠で価値を提供します 自己分析統計を実装します 電子メール/音声/視覚アラートを実装します 可変長のブレイクアウトと混雑ゾーンに基づいて、インディケータは価格アクションのみを使用して取引を選択し、市場が非常に高速に行っていることに反応します。 過去のシグナルの潜在的な利益が表示されます この指標は、独自の品質とパフォーマンスを分析します 負けブレイクアウトは強調表示され、説明されます インジケータは、非バックペインティングおよび非再ペイントです この指標は、日中のトレーダーが単一の価格反転を見逃さないようにするのに役立ちます。ただし、す
Please send me Direct message on MQL5 CHAT after purchasing the Indicator for Training and Installation Support There are some additional files that is important to use with the Indicator . So be sure to contact me after purchasing the Indicator So that I can add you for training and support . If you find any difficulty with installation then send me Direct message here So that I can connect with you via Anydesk or Teamview for the product installation. " Smart Order Block Indicator " to find
Gann Signal is a very simple indicator at first glance, but hidden inside is many years of experience in studying W.D.Ganna methods. The indicator gives accurate BUY/SELL signals, without redrawing. The indicator is very easy to use. All you need to do is attach it to your chart and follow its recommendations. The indicator constantly analyzes the market for entry opportunities. When such an opportunity appears, the indicator gives a signal in the form of an arrow. I repeat, all signals are NOT
[ MT5 Version ] Order Block Indicator MT4 Order Block Indicator MT4  is currently the most accurate and customizable indicator in the market. It has been developed to facilitate the analysis of operations based on Order Blocks and Supply and Demand Zones. These zones are possible reversal points of a movement. Order Blocks indicate a possible accumulation of orders in one area. The price usually gets to reach and react strongly to those areas. The most relevant levels for this reaction are the c
Candle Power Pro
Thushara Dissanayake
4.33 (6)
Candle Power Pro インジケーターを使用して、実際のボリューム情報の力を解き放ちます。この動的ツールは、各ローソク足の実際の体積データを取得し、それを総体積のパーセンテージとして表示します。そうすることで、市場での買い手と売り手の間で進行中の争いを識別できるようになります。 Candle Power Pro は、買い手と売り手の争いを総取引高に対する割合として表示し、市場のダイナミクスに関する貴重な洞察を提供します。買い手と売り手のボリュームを分析することでブレイクアウトを簡単に確認でき、より正確なエントリーポイントとエグジットポイントを確保できます。さらに、買い手と売り手のボリュームを利用して傾向を確認することができ、取引戦略の信頼性が高まります。さらに、買い手と売り手の量の変化を分析することでトレンドの反転を特定できるため、市場の変化に先んじることができます。 このインジケーターは、取引体験を向上させるためのさまざまな機能を提供します。簡単に視覚化できるようにボリューム平均を線として描画したり、ボリュームのパーセンテージを他の 19 個のシンボルと比較してさらに分析し
Features for software Main functions: Accurate entry signals WITHOUT REPAINTING! Once a signal appears, it remains valid! This is a significant distinction from repainting indicators that might provide a signal and then alter it, potentially leading to deposit losses. Now, you can enter the market with higher probability and precision. There's also a function to colour candles after an arrow appears until the target (take profit) is reached or a reversal signal appears . Display of STOP LOSS
Weis Wave with Alert
Trade The Volume Waves Single Member P.C.
4.79 (19)
Rental/Lifetime Package Options and Privileges' * For optimum results the yearly or lifetime package is suggested due to live training and Discord  channel trading with the  creator! Rent Monthly Six Months   Yearly/Lifetime Weis Wave with Speed with Alert+Speed Index x x x Manual  x x x Quick Set up Video x x x Blog x x x Lifetime Updates x x x Setup and Training Material x x Free Rectangle Break Alert Tool      x Discord Access Channel "The SI traders" x 2-hour live methodology traini
マーチンゲールアローは、マーチンゲールバイナリーオプション取引用に設計された矢印タイプのMT4インジケーターで、この矢印はバーオープン/バー内に印刷され、アラートを与えます。 使用方法: 矢印が表示された瞬間に取引を開始し、取引が勝った場合は次のシグナルを待って同じロットを取引します。次のシグナルでトレードがダブルロットを失い、シグナルが勝つまでそれを続けた場合、リセットして最初のトレードロットでトレードします。 推奨される期間 : 任意 最低入金額: 200 ユニット。 このインジケーターはライブでは再ペイント/バックペイントを行いません。 -------------------------------------------------- ------------- パラメーター : インジケーター期間: これを変更すると、異なるシグナルが表示されます。 インジケーターの価格/種類 買われすぎ/売られすぎレベル アラート入力 矢印スタイル ========================================
System Trend Pro - This is the best trend trading indicator!!! The indicator no repaint!!!   The indicator has   MTF   mode, which adds confidence to trading on the trend (   no repaint   ). How to trade? Everything is very simple, we wait for the first signal (big arrow), then wait for the second signal (small arrow) and enter the market in the direction of the arrow. (See screens 1 and 2.) Exit on the opposite signal or take 20-30 pips, close half of it, and keep the rest until the oppo
フルSTOインジケータ(3つのSTOインジケータのすべてのバージョンを含む:プレミアム、ゴールド、シルバー) - STABLE TRADE OPTIONは、自動バイナリーオプション取引のために設計されています。 注意深くお読みください! 重要 1つのターミナルで、異なる有効期限を持つ2つのテンプレートを作成します。18:01、18:02のテンプレートは有効期限が1~15分、22:00のテンプレートは有効期限が10~20分です。 勝率:過去5年間で71 資金管理: 預金から0.3 このバージョンのインジケータは、モスクワ時間18:01、18:02、22:00の取引にのみ設定され、有効期限は銀と金が1~15分、プレミアムバージョンは10~20分です。シグナルはローソク足の内側に表示され、すぐに取引を開始します。 インジケータは完全に設定されているので、自分で何かを変更する必要はありません。インストールして取引してください! 実際の口座でstoの全バージョンをチェックし、結果を確認するのに2年以上かかりました。長年のテストの結果、最適なパラメータが選択さ
Connect Indicator is a tool used for connecting indicators between the MQL market and MT4. The connected indicators are made by our group and can be used for other applications, such as sending messages to the Line application or Telegram application. If you have any questions, please don't hesitate to ask us to receive support. Function and indicator buffer Buffer one is the high price of the previous candle. Buffer two is the high price of the previous candle. Usage To connect indicators to fu
Idea: RSI ( Relative Strength Index) and CCI ( Commodity Channel Index ) are powerfull to solved the market.  This indicator has Smoothed Algorithmic signal of RSI and CCI. So that, it separates the market into buy and sell zones, these areas are marked with arrows, red for downtrend, green for uptrend. This algorithm has the effect of predicting the next trend based on the historical trend, so users need to be cautious when the trend has gone many candles. Please visit screenshots
DESCRIPTION The CHAOS INDICATOR has been developed to be used for the TRADING STRATEGY OF CHAOS, as described in the book. The book is in italian language only and can be obtained only on my website indicated below. DATAS COLLECTED AND SHOWN ON GRAPHS The CHAOS INDICATOR apply easily to any graph and any asset, and it is a TRADING FACILITATOR, as it identify immediately the following items on any graph: - The GP (= RIGHT PRICE) i.e. the price to which the asset should be attracted within 24
This indicator is based on the mathematics of the great trader W.D. Ganna. With its help, you can easily find strong levels by analyzing swings to find the optimal entry point. The indicator works on all instruments and all timeframes. The indicator is fully manual and has control buttons. All you need to do is press the NEW button, a segment will appear, which you can place on any movement, swing or even 1 candle that you want to analyze. By placing the segment, press the OK button. A grid (th
発見が困難で頻度が少ないため、分岐は最も信頼できる取引シナリオの1つです。このインジケーターは、お気に入りのオシレーターを使用して、通常の隠れた分岐点を自動的に見つけてスキャンします。 [ インストールガイド | 更新ガイド | トラブルシューティング | よくある質問 | すべての製品 ] 取引が簡単 通常の隠れた発散を見つけます 多くのよく知られている発振器をサポート ブレイクアウトに基づいて取引シグナルを実装します 適切なストップロスおよび利益レベルを表示します 設定可能なオシレーターパラメーター カスタマイズ可能な色とサイズ バー単位でサイズ別に分岐をフィルタリング パフォーマンス統計を実装します 電子メール/音声/視覚アラートを実装します 幅広い市場の見通しを提供するために、異なるオシレーターを使用して、干渉なしで同じチャートにインジケーターを何度もロードできます。このインジケーターは、次のオシレーターをサポートしています。 RSI CCI MACD オスマ 確率的 勢い 素晴らしい発振器 加速器発振器 ウィリアムズパーセントレンジ 相対活力指数 特に外国為替市
スイングトレーディング は、トレンドの方向のスイングと可能な反転スイングを検出するように設計された最初のインジケーターです。トレーディングの文献で広く説明されているベースラインスイングトレーディングアプローチを使用します。インディケータは、いくつかの価格と時間のベクトルを調査して、全体的なトレンドの方向を追跡し、市場が売られ過ぎまたは買われ過ぎて修正の準備ができている状況を検出します。 [ インストールガイド | 更新ガイド | トラブルシューティング | よくある質問 | すべての製品 ] むち打ちを起こさずに市場スイングの利益 インジケーターは常にトレンドの方向を表示します 色付きの価格帯は機会のベースラインを表します 色付きのダッシュは、可能な反転スイングを表します この指標は、独自の品質とパフォーマンスを分析します 複数時間枠のダッシュボードを実装します カスタマイズ可能なトレンドおよびスイング期間 電子メール/サウンド/プッシュアラートを実装します インジケータは再描画またはバックペインティングではありません Swing Tradingとは Swing Tradi
A. A2SR とは何ですか ?   * 先行テクニカル指標です (塗り直しなし、ラグなし)。 -- ガイダンス : -- https://www.mql5.com/en/blogs/post/734748/page4#comment_16532516 -- そして https://www.mql5.com/en/users/yohana/blog A2SR には、サポート (需要) とレジスタンス (供給) のレベルを決定する特別な手法があります。 ネットで見かける通常の方法とは異なり、A2SR は実際の SR レベルを決定する独自のコンセプトを持っています。 元の手法はインターネットから取得されたものではなく、インターネット上で公開されたこともありません。 A2SR は、取引スタイルに応じて SR レベルを自動選択します。 時間枠を変更しても、SR レベルはその位置にとどまります。 実際のSRは、使用する時間枠から取得されるわけではないため. A2SR には、取引のための完全な手段があります 。 実際のサポート (需要) とレジスタンス (供給) の真のコンセプト。
Gold Channel is a volatility-based indicator, developed with a specific timing algorithm for the XAUUSD pair, which consists of finding possible corrections in the market. This indicator shows two outer lines, an inner line (retracement line) and an arrow sign, where the theory of the channel is to help identify overbought and oversold conditions in the market. The market price will generally fall between the boundaries of the channel. If prices touch or move outside the channel it is a tra
ECM Elite Channel is a volatility-based indicator, developed with a specific time algorithm, which consists of finding possible corrections in the market. This indicator shows two outer lines, an inner line (retracement line) and an arrow sign, where the channel theory is to help identify overbought and oversold conditions in the market. The market price will generally fall between the boundaries of the channel. If prices touch or move outside the channel, it's a trading opportunity. The
This indicator identifies and displays zones, as it were areas of strength, where the price will unfold. The indicator can work on any chart, any instrument, at any timeframe. The indicator has two modes. The indicator is equipped with a control panel with buttons for convenience and split into two modes. Manual mode: To work with manual mode, you need to press the NEW button, a segment will appear. This segment is stretched over the movement and the LVL button is pressed. The level is displayed
Full Forex Market View Dashboard
Opengates Success International
5 (2)
FULL FOREX MARKET VIEWダッシュボードインジケーター これは、トレーダーが市場で何が起こっているかを完全に把握できるようにするために作成されたカスタム指標です。 リアルタイム データを使用して市場にアクセスし、取引を成功させるために必要なあらゆる情報を表示します。 インストール: このインジケーターをウィンドウ チャートに添付する前に、MT4 のマーケット ウォッチ パネルに移動し、不要な通貨ペアまたは取引しないすべての通貨ペアを非表示にして、残りをそこに残します。 その理由は、FFMV ダッシュボードが MT4 の気配値表示に表示されるすべての通貨ペアを表示するためです。 最大 30 通貨ペア以下を表示できます。 MT4 の気配値表示でそれ以上だと、FFMV ダッシュボードのフォントと画像がぼやけて変形します。 正しく表示されません。 使用法:      個人取引の場合      バスケット取引の場合 (方法についてはスクリーンショットを参照してください)      複数注文取引にも使用可能      独自の取引システムなどから
The indicator is designed to work on any trading platform. The program is based on proprietary algorithms and W.D.Ganna's mathematics, allowing you to calculate target levels of price movement based on three points with the highest degree of certainty. It is a great tool for stock trading. The indicator has three buttons: NEW - call up a triangle for calculation. DEL - delete the selected triangle. DELS - completely remove all constructions. The probability of achieving the goals is more than 80
EZTトレンドインジケーターは、トレンド、プルバック、エントリーの機会を示します。 オプションのフィルタリングとあらゆるタイプのアラートが利用可能です。 電子メールおよびプッシュ通知アラートが追加されます。 また、このインジケーターに基づいた EA も開発中であり、間もなく利用可能になる予定です。 2色のヒストグラムとラインで構成される多機能インジケーターです。 これはトレンドの方向と強さを視覚的に表現したもので、ラインまたはヒストグラム上で発散が何度も見つかります。 このインジケーターは自動パラメーター設定とうまく連携します。 これらは特定の時間枠に対して事前に決定されており、その設定でインジケーターを使用することをお勧めします。 手動モードでは、独自のパラメータを設定できます。 これはマルチタイムフレーム(MTF)インジケーターです。 このインジケーターは、MTF rsi、MTF cci、MACD pro などの他のインジケーターの組み合わせとうまく機能します。 取引される商品の変動が大きいほど、最適なエントリーを見つけるために使用する必要がある時間枠は短くなりま
作者のその他のプロダクト
ExtremChannel - индикатор канала движения цены. Каналы строятся на основании предыдущих максимумов и минимумов, а так же уровней поддержки и сопротивления. Есть возможность отображать канал, построенный индикатором на старшем таймфрейме. Индикатор очень прост в использовании и дает наглядные представления о примерных границах будущего движения цены. Например если цена вышла за пределы канала, это может означать скорую смену тренда. Индикатор работает на любой валютной паре и на любом таймфрейме.
MarketSentiment - индикатор рыночного настроения, выполнен в виде осциллятора. В основе индикатора лежит принцип: цена, как правило, идет против толпы. Если большинство трейдеров заключает сделки на продажу, цена часто идет вверх и наоборот. Гистограмма индикатора показывает какие сделки преобладают сейчас на рынке, если гистограмма красная, то больше совершается сделок на продажу, если зеленая - то на покупку.  Индикатор очень прост в использовании и не требует дополнительных настроек. Лучше вс
OscillatorMotion - индикатор выполнен в виде осциллятора и показывает направление движения цены. Для удобства пользования и более точной настройки индикатора можно изменять период, количество предыдущих свечей или баров, которое индикатор берет для анализа. Так же есть функции alert и push-уведомлений. Индикатор работает на любой валютной паре и на любом таймфрейме. Входные параметры: period - количество предыдущих баров для анализа AlertSignal - включить функцию да/нет PushSignal - включить фун
MostTransactions - индикатор анализирует какие транзакции преобладают на рынке в данный момент покупки или продажи. Как правило если большинство трейдеров продает, то цена идет вверх, если преобладают покупки, то цена идет вниз. Таким образом крупные игроки заставляют обычных трейдеров терпеть убытки. Этот индикатор призван решить данную проблему. Если количество сделок на покупку превышает определенное среднее значение, то на графике появляется зеленая точка и следует ожидать движения вниз, есл
StepOscillator - необычный осциллятор, выполнен в виде ступенчатой линии в отдельном окне индикатора. Кроме того, что линия меняет цвет при смене направления движения цены, что является сигналом к покупке или продаже, так же о силе тренда можно судить по размеру ступеньки, чем она выше, тем сильнее тренд. Кода ситуация на рынке близка к смене направления движения, линия индикатора становится практически плоской. Входные параметры: Price - цена по которой ведет расчет индикатор AlertsMessage - вк
FutureWave - индикатор строит предполагаемое будущее движение цены. В своих расчетах индикатор опирается на уровни поддержки и сопротивления, максимумы и минимумы, уровни Фибоначчи и волновой анализ. Индикатор прост в использовании, не требует дополнительных настроек и оптимизации. Работает на любой валютной паре и на любом таймфрейме. Входные параметры: Wave Color -   цвет волны
VertexFilter - это индикатор соединивший в себе классический zig zag и осциллятор. Принцип действия следующий: когда регистрируется новый максимум или минимум, это делается с помощью индикатора zig zag, индикатор ждет смены направления движения цены, это делается с помощью осциллятора, в такие моменты появляются сигналы на покупку и продажу. Таким образом индикатор подает сигналы когда цена меняет направление движения вблизи экстремумов. Это позволяет отфильтровать ложные сигналы. Индикатор имее
フィルタ:
レビューなし
レビューに返信