Action Points
- インディケータ
- Ivan Simonika
- バージョン: 1.0
- アクティベーション: 5
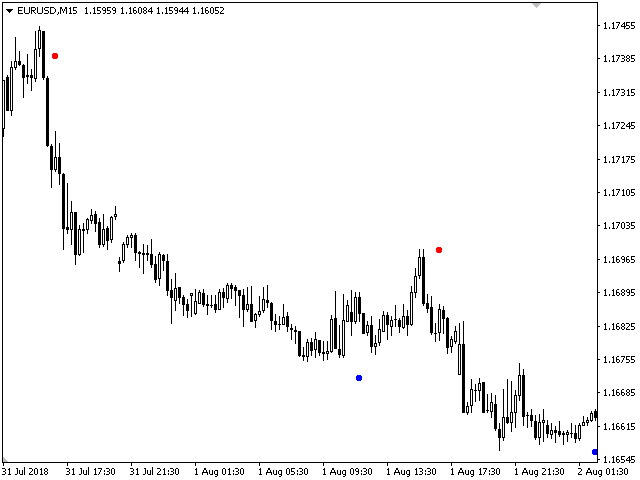
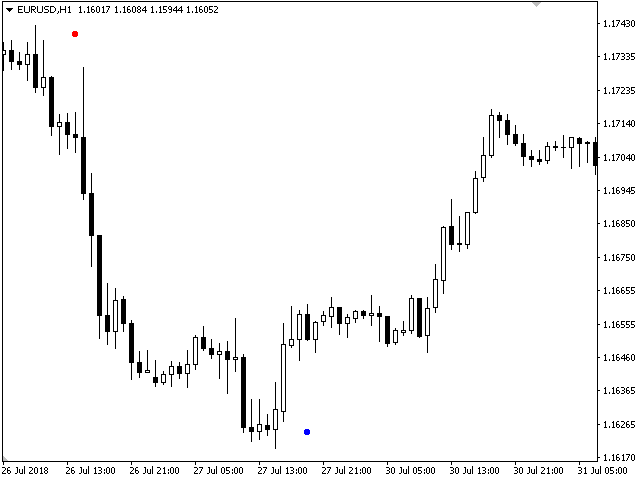
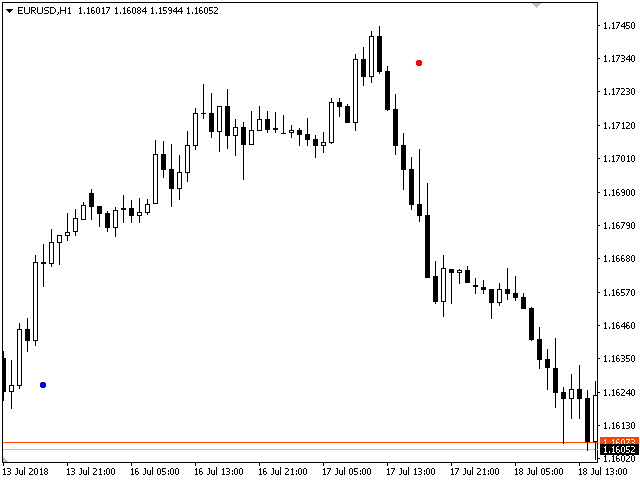
This indicator gives signals about a trend change, shows successful signals. High probability of a successful trend, it can be used with an
optimal risk to profit ratio. The indicator does not redraw and does not lag, it can be used both for pipsing in small periods and for long-term
trading. The indicator algorithm works using open prices, and you can work with a zero bar. It works on all currency pairs and on all
timeframes.