Wicky level x2
- インディケータ
- Andrii Malakhov
- バージョン: 1.3
- アクティベーション: 5
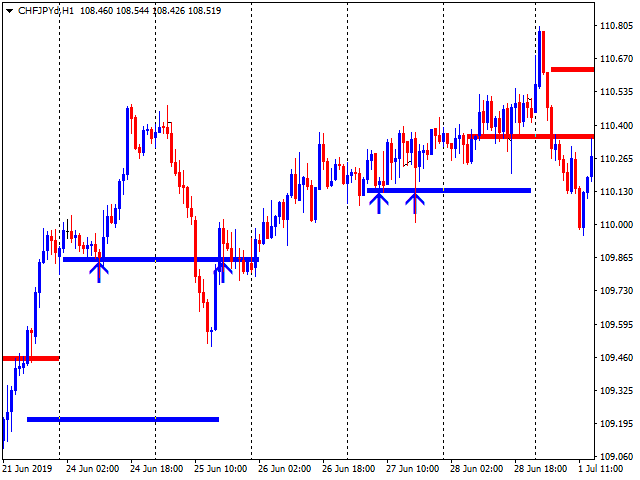
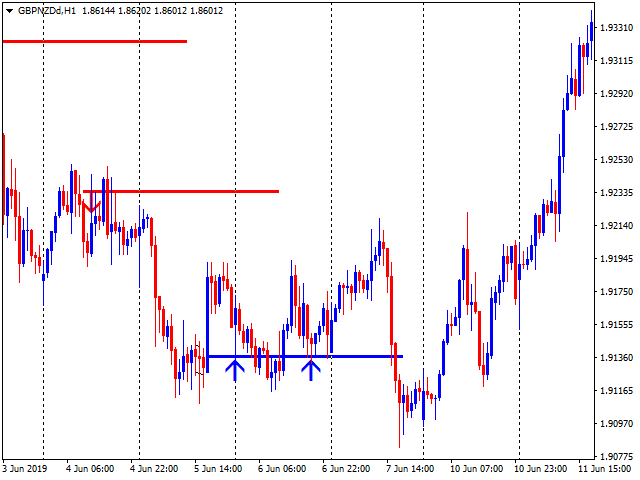
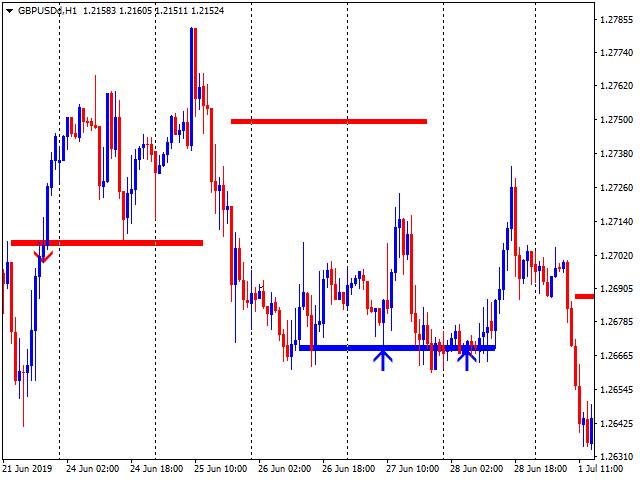
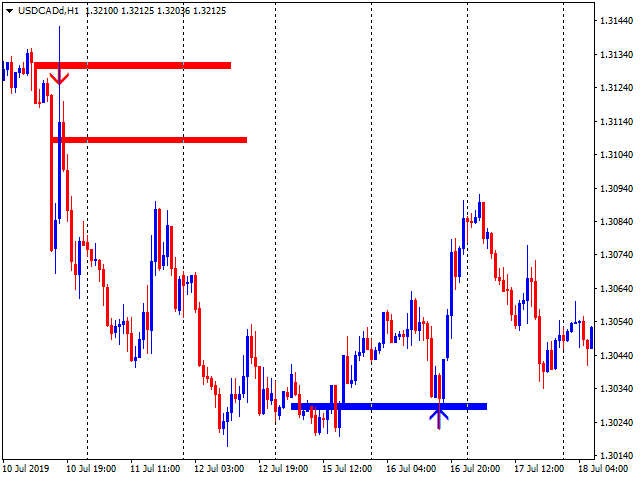
Индикатор, который ищет качественные точки входа в рынок и отображает их в виде стрелок. Действует по сложному алгоритму. Сначала ищет на графике специальные уровни, которые обязательно должны быть пробиты импульсом. Если цена возвращается к этому уровню в виде свечи с длинной тенью и маленьким телом и касается уровня только тенью - возникает точка входа.
Не перерисовывается!
Лучше всего выглядит и отрабатывает на Н1.
Может использоваться как:
- Индикатор уровней, где цена будет останавливаться и разворачиваться или пробивать уровень без ретеста
- Точка входа при среднесрочной торговле (входим только после стрелки на специальном уровне)
Стопы - лучше всего ставить за тень сигнальной свечи. Тейки - тралим или используем RRR 2:1 - 4:1
Полная версия. Бесплатную версию, которая работает только на USDCAD, вы можете скачать здесь https://www.mql5.com/ru/market/product/40962
Настройки:
History - На каком количестве баров истории искать специальные уровни
Pattern_History - Какая продолжительность специальных уровней должна быть
Width_level - Толщина (в пипсах) специального уровня
Min_pips_breakout - Минимальный пробой уровня (оптимально 100пипсов)
show_arrows - Показывать точки входа - свечи с длинными тенями, которые касаются специальных уровней
SendToEmailAndPush - Отправлять ли Email и PUSH сообщения?
Alerting - совершать алерты при возникновении точек входа - свечей с длинными тенями, которые касаются специальных уровней