• 概要
  • レビュー
  • コメント (7)

King Ai Box Breakout Push

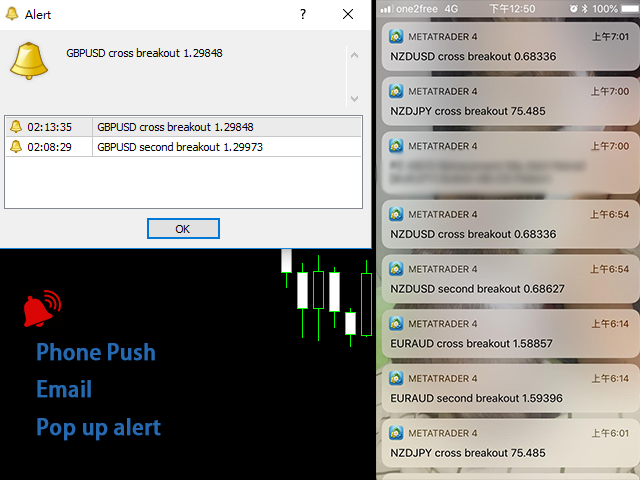
The brand new trading indicator using the box breakout strategy is presented by KING.Ai. This indicator with four-mode alerts is developed by KING.Ai ONLY. It is probably impossible that you could find a box breakout indicator like this one. It is very difficult for you to trade with the box breakout strategy as there is limited time for traders to monitor every currency. However, the box breakout strategy is very profitable. It is because when the price breaks the box, the trend will go further down/up, even can reach a total of 300 to 1000 pips profit. Due to the profit attractiveness, forex traders are very likely to include the box breakout as one of their strategies for technical analysis in FX trading. However, as mentioned above, the monitoring of every currency charts had become the largest constraint. Here, KING.Ai is presenting the solution for that. A "Push Notification" will alert you whenever the price breaks the box in your selected currencies. You can monitor all the currency charts and set the price to trade. You will never miss a box breakout under the currency you want to monitor. There are four alert modes of this indicator. 

You could switch on/off the mobile notification separately for the following Four modes according to your own needs. 

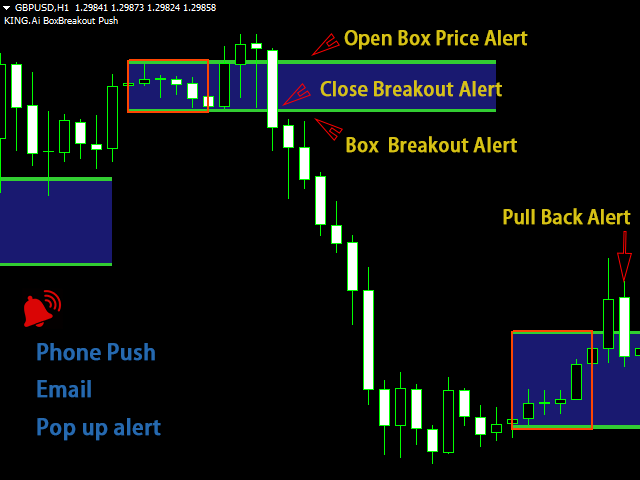
  1. First mode- open box mode: Every time when the box is formed, push notification will be sent to alert traders automatically. The message will show the box up and box bottom prices. Traders can set the entry price accordingly.
  2. Second mode – cross mode: When a candle crosses the top or bottom green line, a push notification will be sent. The message will show the breakout price. In this situation, you can start opening order immediately after your own analysis.
  3. Third mode –close mode: If the candle moves close to the top or bottom line, a push notification will be sent. You can even set how many pips above/below the hitting price the notification to be sent, eg 50 pips.
  4. Fourth mode – pull back mode: when the price breaks though the box more than 100 pips and less than 250 pips, plus it touches the green line again, a notification will be sent with the pull back price. It is a strategy for trading the second pull back among the box breaking strategies, with a high chance that it will make a breakthrough again. 

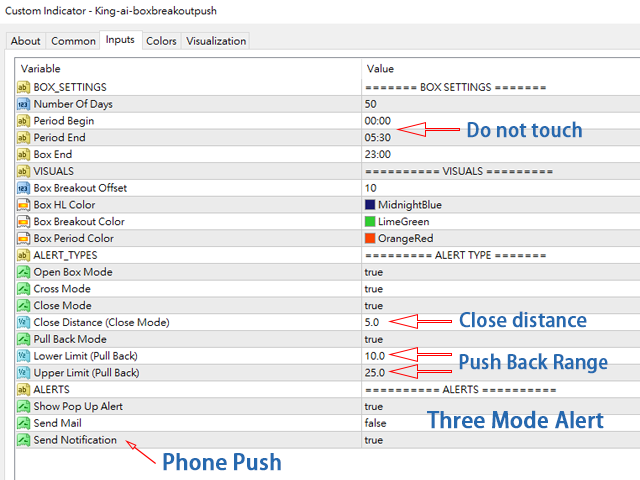
For the Setting, you are reminded two important points:
  1. Close Distance field means the distance to alert you before breakout. You can put 5.0 (50 pips) or any distance you want.
  2. Lower limit and upper limit field mean the range of pull back. For example, the setting of lower limit 10.0 and upper limit 25.0 represent the price will go out of the box at least 100 pips after breaking out but not more than 250 pips before it pulling back and touching the breakout line again.

Teaching material for box breakout could be found online. You may also refer to the graphic illustration below. 

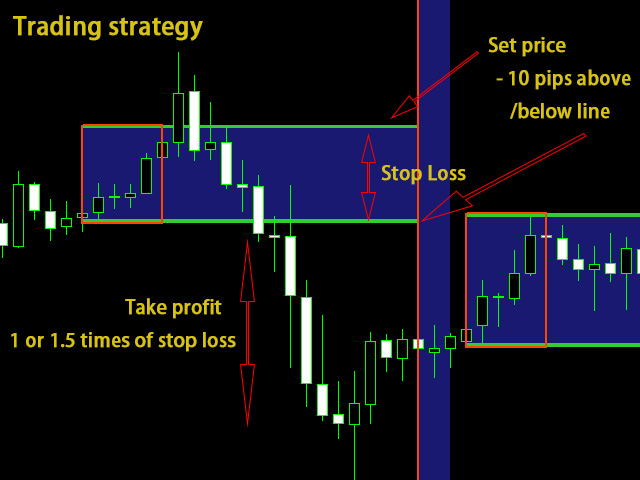
  1. Stop loss value is recommended to be the vertical distance of the box.
  2. Take Profit target is suggested to set 1 or 1.5 times of the Stop loss value.
  3. You can set any buy/sell + limit/stop values to obtain the following results: 1. wait for breakout (open box mode) 2. Instant trade (cross mode) 3. wait for breakout (close mode) 4. wait for pull-back (pull back mode).

Please do not use this indicator solely. You are recommended to integrate all your technical skills to determine the side of breakout, upward or downward, with trend analysis.
A Forex trader must not miss this indicator. The four-mode alerts with push notifications of this indicator is developed by KING.Ai. You can only find it here. Don’t miss the chance! 

If you need other indicators to complement your strategy, please visit our store. The combined use of multiple indicators, which can be found in our store, is highly recommended for risk diversification and profit maximization.

Each indicator does not promise success or winning in every single trade. Customer needs to bear their own risk. Our store is not responsible for any customers’ loss in trade.


おすすめのプロダクト
Chart Local Time
Rider Capital Group
4.67 (18)
Display your Local Time on your charts Display your local time   instead of (or along with) MT4 server time. Display crosshair   which highlights current candle time. Automatically adjusts based on chart zoom (zooming in or out). Displays on every timeframe (M1 – Month), and auto-adjusts as chart timeframe is changed. Handles special ½ hour time zones , such as India.  Renders   fast   (no lag) as you scroll charts. Customize the font family, font size, background color, and crossh
Indicator for binary options arrow is easy to use and does not require configuration works on all currency pairs, cryptocurrencies buy signal blue up arrow sell signal red down arrow tips do not trade during news and 15-30 minutes before their release, as the market is too volatile and there is a lot of noise it is worth entering trades one or two candles from the current period (recommended for 1 candle) timeframe up to m 15 recommended money management fixed lot or fixed percentage of the depo
The Limiter
Haitham Hussein Fathy Moawad
The Limiter One of the helpful tool to identify the limits of HH, HL, LH and LL easily, The Limiter is only a auxiliary tool and not a complete trading system,  The market changes his psychology every week, day and sometimes every hour, for that there's no fixed default values and you must use the tuners settings and change the values, and use the limiter as you need, it's very simple customized tool, you can use it with any kind of indicators to have the best entry  Recommend to use it on H1 bu
Check My Other Products Contact me to discover all my services  This indicator is very useful to have a better understanding of the current trend. With the integration of a trend color cloud it makes it easy to see the price trend immediately on the eye and this allows the trader to make more accurate assessments. I have been using this indicator for years and I must say that it greatly limits chart errors and trades against the trend
スキャルピングアロー通知電話は、ユニークなスキャルピングトレーディングインジケーターです。インジケーターは、注文を開く必要があるときにチャート上に矢印を描画し、注文を開く必要がある方向を示し、携帯電話にシグナルに関する通知を送信します。いつでも、あなたがコンピュータの前にいないときでさえ、あなたは信号を受け取り、市場と取引をコントロールすることができます。インジケーターは、いつ注文を開くかを矢印で示し、矢印の方向は、注文を開く方向を示します。 インジケーターの設定は非常に簡単です。パラメータは2つだけです。 short_period-インジケータ短波周期。 long_period-インジケーターの長波周期。 Signal -ここでは、携帯電話への通知の送信を有効または無効にします。
A technical indicator that calculates its readings on trading volumes. In the form of a histogram, it shows the accumulation of the strength of the movement of the trading instrument. It has independent calculation systems for bullish and bearish directions. Works on any trading instruments and time frames. Can complement any trading system. The indicator does not redraw its values, the signals appear on the current candle. It is easy to use and does not load the chart, does not require additi
この指標は、市場の強気と弱気の圧力を分析する価格反転を予想しています。購入圧力は、特定の日数にわたるすべての累積バーの合計にボリュームを掛けたものです。販売圧力は、同じ数のバーにわたるすべての分布の合計に、ボリュームを掛けたものです。 [ インストールガイド | 更新ガイド | トラブルシューティング | よくある質問 | すべての製品 ] インディケーター比率は、合計アクティビティに対する購買圧力の割合を示します。この値は、0から100まで変動します。2つの移動平均、高速および低速を実装して、圧力トレンドの変化を識別し、それに応じて取引を探します。 50の比率は、市場が均衡していることを意味します 70を超える比率は、市場が買われ過ぎであることを意味します 30未満の比率は、市場が売られ過ぎていることを意味します 赤い点線は現在の比率です 青い線は信号線です オレンジ色の線がメインラインです それは簡単な取引の含意を持っています。 市場が売られ過ぎているときに購入の機会を探す 市場が買われすぎている場合に販売機会を探す 信号線が本線の上にある場合、圧力は強気です 信号線が本線よ
The   VWAP indicator   is our version of the popular Volume-Weighted Average Price indicator. The VWAP is the ratio between the value traded (price multiplied by the number of volume traded) and the total volume traded over a specific time period. As a result, it measures the average price of the instrument much better than the simple moving average. Although there are many ways to use the VWAP, most investors use it to calculate the daily average.  The indicator works in five modes: Moving  
TrendCompass is a powerful indicator for trading in the currency and cryptocurrency markets on the MetaTrader 4 platform. This innovative tool is designed to simplify analysis and decision-making in trading. The indicator combines various technical indicators and algorithms to provide accurate and timely trading signals. Key Features: Multilevel Strategy: TrendCompass is based on a comprehensive strategy that includes analyzing major trends, support and resistance levels, and various technical
Advanced Stochastic Scalper - is a professional indicator based on the popular Stochastic Oscillator. Advanced Stochastic Scalper is an oscillator with dynamic overbought and oversold levels, while in the standard Stochastic Oscillator, these levels are static and do not change. This allows Advanced Stochastic Scalper to adapt to the ever-changing market. When a buy or a sell signal appears, an arrow is drawn on the chart and an alert is triggered allowing you to open a position in a timely mann
This indicator displays the histogram and arrows on chart. When Simple The Best Pro are placed on a chart, they identify the trend.  The color of may be blue or red. The blue color stands for upside moves and the red color stands for downside trends. The indicator offers to set Stop Loss (SL) and  Take Profit (TP)  setting. The default value is ATR. Indicator has automatic optimization. The STB is a unique indicator that shows the tendency (button Bars) of a particular signals. The STB tells us
Forex Blow Up Manager The Spacial Forex Blow up Manager is help you account order on  insufficient margin. Start the program when it reaches the margin level you entered,the system find out maximum profit order & cut off. Avoid the largest loss order closed by the broker due to insufficient margin. The Para Lower Margin Level Start Close Order - if margin level below value, start cut off order Lower Margin Level End Close Order -if margin level greater then value ,stop cut off order Use Open
The Trap Play MT4
Carl Gustav Johan Ekstrom
5 (3)
Scalping strategy   here   <--- Trap Play  refers to a market situation where price initially makes a new high or low, luring traders into believing a strong trend is forming. However, the price quickly reverses and invalidates the breakout, trapping those traders who entered positions based on the initial move. This sudden reversal often results in a rapid exit of positions, leading to significant price movement in the opposite direction.  Trap plays  can occur in various financial markets an
TPA True Price Action indicator reveals the true price action of the market makers through 100% non-repainting signals (except early signals mode) strictly at the close of a candle! TPA shows entries and re-entries, every time the bulls are definitely stronger than the bears and vice versa. Not to confuse with red/green candles. The shift of power gets confirmed at the earliest stage and is ONE exit strategy of several. There are available now two free parts of the TPA User Guide for our custo
OPGTS Currency Strength Meter
Opengates Success International
3 (1)
OPGTS Currency Strength Meter is an indicator created to measure and analyze the currency strength and pass the information to the trader through a graphical display of each currency group's strength rates by percentage. Each bar it shows represents the currency's strength or weakness. USAGE: It is useful in two ways for trading: 1. Solo Trading 2. Basket Trading (Currency Group Trading) HOW TO USE IT EFFECTIVELY Solo trading: It can be used for solo trading by analyzing the
Time Bubble ***Specialized for GBPJPY 1H time frame*** (tested for two years with success rates about 82%) Time Circle's smart algorithm detects the price circles with time . give strong signals at the right time as result of combine the price and time. our team spent months to develop this indicator specially for GBPJPY ..with high success rates about 82% win trades over two years .tested from December 2016 to November 2018. *** in last two years total signals 1012 with 829 Wins and
Was: $249  Now: $99   Market Profile defines a number of day types that can help the trader to determine market behaviour. A key feature is the Value Area, representing the range of price action where 70% of trading took place. Understanding the Value Area can give traders valuable insight into market direction and establish the higher odds trade. It is an excellent addition to any system you may be using. Blahtech Limited presents their Market Profile indicator for the MetaTrader community. Ins
この指標の独自性は、ボリュームアカウンティングアルゴリズムにあります。累積は、1日の始まりを参照せずに、選択した期間に直接発生します。最後のバーは計算から除外できます。そうすると、現在のデータが以前に形成された重要なレベル(ボリューム)に与える影響が少なくなります。 より正確な計算のために、M1グラフのデータがデフォルトで使用されます。価格ボリュームの分配のステップは規制されています。デフォルトでは、ディスプレイの右の境界線は、分析に使用されるデータの先頭に対応するバーに設定されていますが、必要に応じて、必要なバーに設定できます。表示されているボリュームバンドの長さ(右の境界線)は係数によって調整され、0(現在の)バーに左または右にシフトしたり、現在のバーを参照してミラーリングしたりすることもできます。 パラメーター: Accumulation period - ボリューム累積の計算期間 Number of excluded last bars - 計算から除外された最後のバーの数 Accumulation price step - 価格パラメータによるボリューム合計のステップ Gra
Indicator captures the trend reversals with no-repaint Buy and Sell Arrow signals. CyberZingFx Trend Reversal Indicator - your go-to solution for accurate and reliable trend reversal signals. With its  advanced trading strategy , the indicator offers you Buy and Sell Arrow signals that do not repaint, making it a reliable tool for catching Swing Highs and Swing Lows in any market and any time frame. Indicator works on  any market  and  any time frames . __________________________________________
Fibo Engulfing Changer Trading System Fibo Engulfing Changer Trading System is a great indicator created to locate an engulfing candle on the Chart with the aid of an Arrow and Popup alerts system. For accurate working of an engulfing candle based on market structure, it must be used with an Moving Average but we discovered that Moving average is subjected to individual trader's preferences, therefore it has been coded in a way that the Trader can choose MA he/she desires with a preferred PER
Bull Bear Easy MTF
Naththapach Thanakulchayanan
This indicator, Bull Bear Easy MTF, summarise the strength color graphic and percentage of power for both  Bull and Bear in current market emotion stage which will show you in multi time frames and sum of the total Bull and Bear power strength which is an important information for traders especially you can see all Bull and Bear power in visualized graphic easily, Hope it will be helpful tool for you for making a good decision in trading.
Reverse side scalper is the manual trading system, that works on choppy(anti-trend) market. As a rule markets are on 80% choppy and only 20% is trend phase. System is based on custom step Moving and RSI and reverse pattern. System defines up movement, down movement, trend / choppy phases. Indicator plots Buy signal arrow when current direction is down and phase is trend, Sell signal arrow is plotted when currently is up movement and phase is trend. As a rule it allows to "catch" local maximum/mi
Horizontal tick volumes (HTV) Horizontal tick volumes - an easy and convenient indicator of a horizontal market profile in a user-selected time. Produces a visual image of strong trading levels by maximum peaks past volumes and trading direction by color (sell or buy), and also allows you to detect smaller trading levels by differentiating past volumes. In the "Optimal" mode, when displayed on chart periods up to and including "M30", the data of one-minute bars are used, on H1 and H4 - five-minu
This   Real Magic Trend   indicator is designed for signal trading. This indicator generates trend signals. It uses many algorithms and indicators to generate this signal. It tries to generate signals from the points with the highest trend potential. This indicator is a complete trading product. This indicator does not need any additional indicators. The indicator is never repainted. The point at which the signal is given does not change.      Features and Recommendations Time Frame
The Magneto Volume Trigger indicator is designed for determining the volume confirmed by the candlestick pattern and predicting the trend tendency. Indicator setup and use The calculation of values is affected by two parameters - Period and Gate . The lower the value of Gate , the higher the sensitivity of the indicator. Period allows making a sample of data for the specified number of candles. The lower the value of Period , the more the indicator is adapted to the current market conditions.
In the age of speed, everyone wants to gets what he/she wants quickly. Trading is all about gaining money, and scalping is a way of doing it in a short time. The "Scorpion Scalper Pro" has been named on the scorpion because of its speed. The indicator serves to provide signals for the M15 timeframe. It also sends Alerts (window alert, email alert, push notification alert) whenever a buy/sell signal occurs, and the alerts are customizable (they can be turned ON or OFF). Indicator inputs : - Buy
"BUYUK SAVDOGAR" TM has developed this strategy to support anyone who trades binary options. The "monoBAR" trading system is based on mathematical probability and consists of algorithms that can analyze the market situation with high accuracy. This trading system consists of mathematical probability, which helps to determine the most accurate state of the price movement. The strategy algorithm helps to detect small impulse movements in a timely manner. You can simultaneously analyze and r
設定した時差で時間ラインを表示します。(30分単位の時差には対応していません。) また、100.000、.100、.200のようにキリの良い価格で価格ラインを表示します。 標準ではMT4による時間と価格でグリッドラインが表示されていますが、ブローカーの時間となり価格とともに中途半端な位置で表示されるので、非常に分かりにくいものとなっています。 それを非表示にし ユーザーが設定した時差と価格の分かりやすい位置でグリッドラインを表示します 。他のEAや裁量取引に負荷をかけないよう、軽快に動作するよう実装しております。 時間ラインは未来の時間も表示 します。事前に節目となる時間の把握ができます。(土日の時間軸は表示されません。) アジア、EU、USの時間帯を色付きで表示できます。 マーケットの開始時刻や、イベントの時間など特定の時間をSpecial Timeとしてラインを表示することができます。 パラメーター説明 ・Time offset:  MT4上の時間に対する時差を設定します。 ・Bars time range:  時間ラインを表示する範囲をバーの本数で設定します。 ・P
Session Volume Profile  is an advanced graphical representation that displays trading activity during Forex trading sessions at specified price levels. The Forex market can be divided into four main trading sessions: the Australian session, the Asian session, the European session and the favorite trading time - the American (US) session. POC  - profile can be used as a support and resistance level for intraday trading. VWAP  - Volume Weighted Average Price. ATTENTION! For the indicator to
Supply and Demand Monster MT4
Tsog Erdene Borjigon Enkhkhudulmur
Supply and demand zones are at the heart of   supply and demand trading . These zones are areas that show  liquidity at a specific price.  The supply zone is also called the distribution zone, while the demand zone is called the accumulation zone.   Our indicator automatically draw supply and demand zones in Metatrader 5. It give opportunity to understand trading zone and avoiding risk.
このプロダクトを購入した人は以下も購入しています
現在26%オフ 初心者やエキスパートトレーダーに最適なソリューション! このインジケーターは、独自の機能と新しい計算式を取り入れた、ユニークで高品質、かつ手頃な価格のトレーディングツールです。たった1枚のチャートで28の為替ペアの通貨強度を読み取ることができます。新しいトレンドやスキャルピングチャンスの引き金となるポイントを正確に特定することができるので、あなたのトレードがどのように改善されるか想像してみてください。 ユーザーマニュアルはこちら  https://www.mql5.com/en/blogs/post/697384 これが最初の1本、オリジナルだ! 価値のないクローンを買わないでください。 特別な サブウィンドウの矢印で強い通貨の勢いを表示 GAPがあなたのトレードを導く! 基準通貨や気配値が売られすぎ・買われすぎのゾーン(外相フィボナッチレベル)にあるとき、個別チャートのメインウィンドウに警告表示。 通貨がレンジの外側から反落した場合、プルバック/リバーサルのアラート。 クロスパターンの特別なアラート 複数の時間枠を選択可能で、トレンドを素早く
Reversal First Impulse levels (RFI)    INSTRUCTIONS        RUS       -       ENG              R ecommended to use with an indicator   -   TREND PRO -  Version MT5 A key element in trading is zones or levels from which decisions to buy or sell a trading instrument are made. Despite attempts by major players to conceal their presence in the market, they inevitably leave traces. Our task was to learn how to identify these traces and interpret them correctly. Main functions: Displaying active zones
An exclusive indicator that utilizes an innovative algorithm to swiftly and accurately determine the market trend. The indicator automatically calculates opening, closing, and profit levels, providing detailed trading statistics. With these features, you can choose the most appropriate trading instrument for the current market conditions. Additionally, you can easily integrate your own arrow indicators into Scalper Inside Pro to quickly evaluate their statistics and profitability. Scalper Inside
Advanced Supply Demand
Bernhard Schweigert
4.92 (311)
現在33%オフ 初心者にもエキスパートトレーダーにも最適なソリューション このインジケーターは独自の機能と新しい公式を多数内蔵しており、ユニークで高品質かつ手頃な取引ツールです。このアップデートでは、2つの時間枠ゾーンを表示できるようになります。より長いTFだけでなく、チャートTFとより長いTF(ネストゾーンを表示)の両方を表示できます。すべてのSupply Demandトレーダーの皆さんのお気に召すはずです。:) 重要情報の公開 Advanced Supply Demandの可能性を最大化するには、 https://www.mql5.com/ja/blogs/post/720245 にアクセスしてください。   エントリーまたはターゲットの正確なトリガーポイントを正確に特定できれば取引がどのように改善されるか想像してみてください。新しい基盤となるアルゴリズムに基づいて構築されているため、買い手と売り手の間の潜在的な不均衡をさらに簡単に特定できます。これは、最も強い需要と供給のゾーンと、過去のパフォーマンス(古いゾーンを表示)がグラフィカルに表現されるためです。これらの機能は、最適
TPSpro TRENDPRO  - is a trend indicator that automatically analyzes the market and provides information about the trend and each of its changes, as well as giving signals for entering trades without redrawing! The indicator uses each candle, analyzing them separately. referring to different impulses - up or down impulse. Exact entry points into transactions for currencies, crypto, metals, stocks, indices!  -  Version MT5               DETAILED DESCRIPTION                R ecommended to use with
まず第一に、この取引インジケーターは再描画されず、再描画されず、遅延しないことを強調する価値があります。これにより、手動取引とロボット取引の両方に理想的なものになります。 ユーザーマニュアル:設定、入力、戦略。 アトミックアナリストは、価格の強さとモメンタムを利用して市場でより良いエッジを見つけるためのPA価格アクションインジケーターです。ノイズや誤ったシグナルを除去し、取引ポテンシャルを高めるための高度なフィルターを備えています。複雑なインジケーターの複数のレイヤーを使用して、アトミックアナリストはチャートをスキャンし、複雑な数学的計算をシンプルなシグナルと色に変換します。これにより、どのような初心者トレーダーでも理解して使用し、一貫した取引の決定を行うことができます。 「アトミックアナリスト」は、新規および経験豊富なトレーダー向けにカスタマイズされた包括的な取引ソリューションです。プレミアムインジケーターとトップノッチの機能を1つの取引戦略に組み合わせ、すべてのタイプのトレーダーにとって汎用性のある選択肢にします。 デイリートレーディングとスキャルピング戦略:高
TrendMaestro
Stefano Frisetti
5 (2)
note: this indicator is for METATRADER4, if you want the version for METATRADER5 this is the link:  https://www.mql5.com/it/market/product/108106 TRENDMAESTRO ver 2.4 TRENDMAESTRO recognizes a new TREND in the bud, he never makes mistakes. The certainty of identifying a new TREND is priceless. DESCRIPTION TRENDMAESTRO identifies a new TREND in the bud, this indicator examines the volatility, volumes and momentum to identify the moment in which there is an explosion of one or more of these data a
現在20%OFF! 初心者やエキスパートトレーダーのためのベストソリューション! このダッシュボードソフトウェアは、28の通貨ペアで動作しています。それは私達の主要な指標(高度な通貨の強さ28と高度な通貨インパルス)の2に基づいています。それは全体の外国為替市場の大きい概観を与えます。それは、すべての(9)時間枠で28の外国為替ペアのための高度な通貨の強さの値、通貨の動きの速度と信号を示しています。チャート上で1つのインディケータを使用して市場全体を観察し、トレンドやスキャルピングの機会をピンポイントで見つけることができたら、あなたのトレードがどのように改善されるか想像してみてください。 このインディケータには、強い通貨と弱い通貨の識別、潜在的な取引の識別と確認がより簡単になるような機能が搭載されています。このインディケータは、通貨の強さや弱さが増加しているか減少しているか、また、すべての時間枠でどのように機能しているかをグラフィカルに表示します。 新機能として、現在の市場環境の変化に適応するダイナミックなマーケットフィボナッチレベルが追加され、すでに当社のAdvan
74% discount for the next 10 buyers (original price $605): 1 left Get a 50% bonus by buying (or even renting) any of our products. After buying (or renting), send a message for more information. 3 Indicators in 1 indicator Strategy based on price action Made specifically for the best forex currency pairs Can be used in the best time frame of the market at a very reasonable price This indicator is basically 3 different indicatos . But we have combined these 3 indicators in 1 indicator so th
ご紹介   クォンタム トレンド スナイパー インジケーターは 、トレンド反転を特定して取引する方法を変革する画期的な MQL5 インジケーターです。 13年以上の取引経験を持つ経験豊富なトレーダーのチームによって開発されました。     クォンタムトレンドスナイパーインジケーター   は、非常に高い精度でトレンドの反転を識別する革新的な方法で、あなたのトレーディングの旅を新たな高みに押し上げるように設計されています。 ***Quantum Trend Sniper Indicatorを購入すると、Quantum Breakout Indicatorを無料で入手できます!*** クォンタム ブレイクアウト インジケーターは、トレンドの反転を特定するとアラートを発し、矢印を示し、3 つのテイクプロフィットレベルを提案します。 初心者トレーダーにもプロのトレーダーにも適しています。 量子EAチャネル:       ここをクリック MT5のバージョン:       ここをクリック 推奨事項: 期間: すべての時間枠。最良の結果を得るには、
The indicator of a Professional Trader is an arrow indicator for predicting the direction of price movement. I have been working on this indicator since 2014. You can use this indicator as your main indicator, use its entry signals, and use it as your only indicator to find entry points. About the product: Recommended TF [H4-D1-W1]   . The indicator predicts the direction of the next candle. Fits a variety of tools; Flexibility in settings for different instruments and intervals through the
ご紹介     Quantum Breakout PRO は 、ブレイクアウト ゾーンの取引方法を変革する画期的な MQL5 インジケーターです。 13年以上の取引経験を持つ経験豊富なトレーダーのチームによって開発された Quantum Breakout PROは 、革新的でダイナミックなブレイクアウトゾーン戦略により、あなたの取引の旅を新たな高みに押し上げるように設計されています。 クォンタム ブレイクアウト インジケーターは、5 つの利益ターゲット ゾーンを備えたブレイクアウト ゾーン上のシグナル矢印と、ブレイクアウト ボックスに基づいたストップロスの提案を提供します。 初心者トレーダーにもプロのトレーダーにも適しています。 量子EAチャネル:       ここをクリック MT5バージョン:   ここをクリック 重要!購入後、インストールマニュアルを受け取るためにプライベートメッセージを送ってください。 推奨事項: 時間枠: M15 通貨ペア: GBPJPY、EURJPY、USDJPY、NZDUSD、XAUUSD アカウントの種類: ECN、Raw、また
FX Volume
Daniel Stein
4.6 (35)
mql5と Telegramの モーニング・ブリーフィングで、詳細とスクリーンショットを含む毎日のマーケット・アップデートをご覧 ください! FX Volumeは、ブローカーの視点から市場のセンチメントをリアルに洞察する、最初で唯一の出来高インジケーターです。 ブローカーのような機関投資家が外国為替市場でどのようなポジションをとっているか、COTレポートよりもはるかに速く、素晴らしい洞察を提供します。 この情報をチャート上で直接見ることは、あなたの取引にとって真のゲームチェンジャーであり、画期的なソリューションです。 以下のようなユニークなマーケットデータ洞察から利益を得てください。 比率は 、通貨のロングポジションとショートポジションの比率をパーセントで表示します。 比率の変化は 、選択した期間内のロング比率とその変化率を表示します。 Volumes Totalは 、通貨の取引量(ロングとショート)の合計をロット単位で表示します。 Volumes Long :全通貨のロングポジションの取引量を表示します。 Volumes(ショート )は、全通貨のショートポジションの取引量を表示
mql5と Telegramの モーニング・ブリーフィングで、詳細とスクリーンショットを含む毎日のマーケット・アップデートをご覧 ください! FX Power MT4 NGは 、長年の人気を誇る通貨強度計FX Powerの次世代モデルです。 この次世代ストレングスメーターは何を提供するのでしょうか?初代FXパワーの魅力すべて プラス GOLD/XAUの強さ分析 より正確な計算結果 個別に設定可能な分析期間 カスタマイズ可能な計算上限値により、さらに優れたパフォーマンスを実現 もっと見たい人のための特別なマルチインスタンス設定 すべてのチャートでお好みの色を無限に設定可能 数え切れないほどの通知オプションにより、重要なことを見逃すことはありません。 Windows 11とmacOSのスタイルで角を丸くした新しいデザイン 魔法のように動くインジケーターパネル FXパワーの主な機能 すべての主要通貨の強さの完全な履歴 すべての時間枠における通貨の強さの履歴 すべてのブローカーとチャートで同一の計算結果 100%信頼できるリアルタイム計算 -> リペイントなし ドロップダウン・リストから
このインジケータは、手動および自動的な方法でチャートに描かれたハーモニックパターンを検出します。ユーザーマニュアルは、このリンクから参照できます: あなたのレビューを追加し、入手するために私たちに連絡してください。 この製品をmt4で試すための無料版があります。 GartleyおよびNenstarパターンを検出するために使用できます。 https://www.mql5.com/en/market/product/30181 完全なMT4バージョンを購入するには、次の場所から購入できます。 https://www.mql5.com/en/market/product/15212 注 インジケータにはコントロールパネルがあり、すべての(チャート&時間枠)設定が保存されます。チャート上でスペースをより多く確保するために、最小化することができ、他の分析ツールで作業する場合は、すべてのインジケータデータを非表示にするために閉じるボタンを押すことができます。 このインジケータを使用して設定を変更し、移動平均やボリンジャーバンドなどのインジケータを追加すると、編集のテンプレートが自動的に保存され、必
PRO Renko Systemは、特別にRENKOチャートを取引するために設計された高精度の取引システムです。 これは、様々な取引商品に適用することができる普遍的なシステムです。 システムは効果的に正確な逆転信号へのアクセスを与えるいわゆる市場の騒音を中和する。 表示器は非常に使いやすく、信号の生成に責任がある1つの変数だけがあります。 あなたは簡単にお好みの任意の取引ツールとレンコバーのサイズにツールを適応させることができます。 私はいつもあなたが私のソフトウェアで収益性の高い取引を支援するために余分なサポートを提供する準備ができています! 私はあなたに幸せで収益性の高い取引をしたいです! ご購入後にご連絡ください! 私はあなたに私のレンコチャートジェネレータを送信します。 私はまた、私の個人的な推奨事項やシステムの他のモジュールを無料で共有します!
現在31%オフ! 初心者やエキスパートトレーダーに最適なソリューション! このインジケータは、独自の機能と秘密の数式を組み込んだ、ユニークで高品質かつ手頃な価格のトレーディングツールです。たった1枚のチャートで28の通貨ペアのアラートを表示します。新しいトレンドやスキャルピングチャンスの引き金となるポイントを正確に把握することができるので、あなたのトレードがどのように改善されるか想像してみてください! 新しい基本的なアルゴリズムに基づいて構築されているため、潜在的な取引の特定と確認がより簡単になります。これは、通貨の強さや弱さが加速しているかどうかをグラフィカルに表示し、その加速のスピードを測定するためです。加速すると物事は明らかに速く進みますが、これはFX市場でも同じです。つまり、反対方向に加速している通貨をペアにすれば、利益を生む可能性のある取引を特定することができるのです。 通貨の勢いを示す縦の線と矢印は、あなたの取引の指針となるでしょう。 ダイナミックマーケットフィボナッチ23レベルはアラートトリガーとして使用され、市場の動きに適応します。もしインパルスが黄色
Wolfe Waves scanner - It scans all the Symbols and identify the movement of price and it gives confidence in trade. It automatically plots  fifth wave breaks out of the channel. According to the theory behind the pattern, a line drawn from the point at the beginning of the first wave and passing through the beginning of the fourth wave predicts a target price for the end of the fifth wave. If a trader properly identifies a Wolfe Wave as it forms, the beginning of the fifth wave represents an op
TakePropips Donchian Trend Pro
Eric John Pajarillaga Aldana
4.82 (17)
TakePropips Donchian Trend Pro   (MT4) は、ドンチャン チャネルを使用してトレンドの方向を自動的に検出し、エントリーとエグジットの取引シグナルを提供する強力で効果的なツールです! この多機能インジケーターには、トレンド スキャナー、取引シグナル、統計パネル、スクリーナー、取引セッション、およびアラート履歴ダッシュボードが含まれます。取引シグナルを提供し、チャートを分析する時間を節約するように設計されています! ユーザー マニュアルとインストール ガイドは、ブログ投稿 (   https://www.mql5.com/en/blogs/post/751368   ) からダウンロードできます。 今日は 50% オフ! 98ドルから49ドルに値下げ! このインジケーターは、ストラテジー テスターでテストできます (ビジュアル モードを有効にします)。 詳細については、説明の下にあるビデオ チュートリアルも利用できます。 ご不明な点やサポートが必要な場合は、私に連絡してください。 TakePropips Donchian Trend Pro イン
もちろんです。以下は、提供いただいたテキストの日本語への翻訳です: MT4用の天文学指標をご紹介します:究極の天体トレーディングコンパニオン トレーディング体験を天空の高みに高める準備はできていますか?私たちの革命的なMT4用の天文学指標をご紹介します。この革新的なツールは、複雑なアルゴリズムの力を借りて、類まれなる天文学的洞察と精密な計算を提供します。 あなたの指先で宇宙の情報を: 宝のような天文学的データが明らかになる包括的なパネルをご覧ください。惑星の地理的/太陽中心座標、太陽と地球の距離、星の大きさ、伸び、星座、黄道座標および赤道座標、さらには水平座標まで、それぞれが綿密に計算され美しく表示されています。指標によって生成される垂直線は時間値に対応し、トレーディングの旅に宇宙の視点を提供します。 惑星のラインと関係: グラフを飾る惑星のラインの魔法を体験し、スケールと角度をカスタマイズできます。直感的なコントロールパネルを介して各惑星のラインの表示を簡単に切り替えることができます。指定された時刻範囲内での合会、六分会、四分会、三分会、対会、逆行の指標で天体の関係の芸術を発見してく
Introduction to Fractal Pattern Scanner Fractal Indicator refers to the technical indicator that makes use of the fractal geometry found in the financial market. Fractal Pattern Scanner is the advanced Fractal Indicator that brings the latest trading technology after the extensive research and development work in the fractal geometry in the financial market. The most important feature in Fractal Pattern Scanner is the ability to measure the turning point probability as well as the trend probabi
Manual guide:   Click here Starting price of  $88  for the first 25 copies only ( 15  left)! -- Next price is  $176 .  This indicator is unstoppable when combined with our other indicator called  Support & Resistance . After purchase, send us a message and you could get  it  for  FREE as a BONUS!  Introducing Trend Punch , the revolutionary forex trend indicator that will transform the way you trade! Trend Punch is uniquely designed to provide precise buy and sell arrows during stron
このインディケータは、当社の2つの製品 Advanced Currency IMPULSE with ALERT  +   Currency Strength Exotics . のスーパーコンビネーションです。 このインジケーターは全ての時間枠で作動し、8つの主要通貨と1つのシンボルの強弱のインパルスをグラフで表示します。 このインジケータは、金、エキゾチックペア、商品、インデックス、先物など、あらゆるシンボルの通貨強度の加速度を表示することに特化されています。金、銀、原油、DAX、US30、MXN、TRY、CNHなどの通貨強度の加速度(インパルスまたは速度)を表示するために、任意のシンボルを9行目に追加できる、この種の最初のものです。 新しいアルゴリズムに基づいて構築され、潜在的な取引の特定と確認がさらに容易になりました。これは、通貨の強さや弱さが加速しているかどうかをグラフィカルに表示し、その加速の速度を測定するためです。加速すると物事は明らかに速く進みますが、これはFX市場でも同じです。つまり、反対方向に加速している通貨をペアリングすれば、潜在的に利益を生む取
ON Trade Waves Patterns Harmonic Elliot Wolfeをご紹介します。これは手動および自動の方法を使用して市場のさまざまなパターンを検出するために設計された高度なインジケーターです。以下はその動作方法です: ハーモニックパターン: このインジケーターは、チャートに表示されるハーモニックパターンを識別できます。これらのパターンは、Scott Carneyの「Harmonic Trading vol 1および2」で説明されているように、ハーモニックトレーディング理論を実践するトレーダーにとって重要です。手動で描画するか、自動検出に頼るかにかかわらず、ON Trade Waves Patternsがお手伝いします。 コントロールパネル: このインジケーターはユーザーフレンドリーなコントロールパネルを備えています。チャートと時間枠の設定を保存し、異なる構成間をスムーズに切り替えることができます。チャートスペースを最大限に活用するために最小化することもできます。他の分析ツールで作業することを好む場合、閉じるボタンをクリックするだけで、すべてのインジケーターデ
There is No use in the Testing Demo. You will understand nothing from running flashing numbers. It is a Dashboard. Just try to understand idea, get it and I will help in everything further. Symbols must be separated by commas (,) and entered into the parameters exactly as displayed by your broker to ensure they are recognized in the dashboard. These symbols will be used for analysis by the indicator. With one click open any pair any timeframe directly from dashboard The MA Speedometer Dashboar
Matrix Arrow Indicator MT4
Juvenille Emperor Limited
5 (2)
マトリックスアローインジケーターMT4は、すべてのシンボル/商品(外国為替、商品、暗号通貨、インデックス、株式)で使用できる100%再描画されていないマルチタイムフレームインジケーターに続くユニークな10in1トレンドです。マトリックスアローインジケーターMT4は、初期段階で現在のトレンドを判断し、最大10の標準インジケーターから情報とデータを収集します。 平均方向移動指数(ADX) 商品チャネルインデックス(CCI) クラシック平研アシキャンドル 移動平均 移動平均収束発散(MACD) 相対活力指数(RVI) 相対力指数(RSI) 放物線SAR ストキャスティクス ウィリアムズのパーセント範囲 すべてのインジケーターが有効な買いまたは売りシグナルを与えると、対応する矢印がチャートに印刷され、次のろうそく/バーの開始時に強い上昇トレンド/下降トレンドを示します。ユーザーは、使用するインジケーターを選択し、各インジケーターのパラメーターを個別に調整できます。マトリックスアローインジケーターMT4は選択されたインディケーターからのみ情報を収集し、それらのデータのみに基づいてアローを印
移動平均通貨強さダッシュボードは、 複数のシンボルや時間枠にわたる通貨の勢いについての深い洞察を提供する強力かつ包括的な指標です。この強力なツールは、移動平均を利用して最新のクロスオーバー ポイントを特定し、現在の価格までの通貨の強さを効果的に追跡します。このダッシュボードは、直感的なデザインとユーザーフレンドリーなインターフェイスにより、情報に基づいた意思決定を求めるトレーダーに豊富な情報を提供します。 このダッシュボードの重要な機能の 1 つは、スキャナ モードで動作する機能であり、ユーザーは市場をスキャンして潜在的な機会を見つけることができます。このインジケーターの包括的なダッシュボードにはすべてのシグナルがボタンとして表示され、必要な情報に簡単にアクセスできます。ボタンをクリックするだけで、クロスオーバー ラインを含む新しいチャートが開き、シグナルがより詳細に表示されます。さらに、グループ モード機能を使用すると、シンボルをグループに分けて表示でき、通貨の関係を構造化して表示できます。 カスタマイズ可能なパラメータを備えた移動平均通貨強さダッシュボードは、個々の取引の
Wolfe Wavesは、すべての金融市場に存在する自然に発生する取引パターンであり、均衡価格への戦いを表しています。これらのパターンは、短期および長期の時間枠で発生する可能性があり、現在の最も信頼性の高い予測反転パターンの1つであり、通常は強い長期の価格変動に先行します。 [ インストールガイド | 更新ガイド | トラブルシューティング | よくある質問 | すべての製品 ] クリアな取引シグナル 驚くほど簡単に取引できます カスタマイズ可能な色とサイズ パフォーマンス統計を実装します 適切なストップロスおよび利益レベルを表示します 電子メール/音声/視覚アラートを実装します インジケーターはパターンとブレイクアウト矢印を同時に描画し、インジケーターが展開するときにパターンが再描画されないようにします。ただし、エントリのブレイクアウトが何度も発生し、インジケータが再描画される場合、あまり頻繁にではなく控えめに再描画される可能性があります。インジケータは非バックペインティングです。 オオカミの定義 ウルフ波には、次の特性が必要です。 ( 例を見るにはここをクリック ) ウ
The indicator calculates currency strength of eight major and also can calculate strength of any other currency, metal or CFD. You don't need to look through a lot of charts to determine the strong and weak currencies, as well as their current dynamics. The picture of the whole currency market for any period can be viewed in a single indicator window. Built-in tools for monitoring and controlling the situation will help you not to miss out on profits. Main Features It is able to display only t
The  RSI Basket Currency Strenght  brings the RSI indicator to a new level.  Expanding the boundaries of TimeFrames and mono-currency analysis, the RSI Multi Time Frame Currency Strenght take the movements of each currency that composes the cross and confront them in the whole basket of 7 crosses.  The indicator works with any combination of  AUD, CAD, CHF, EUR, GBP, JPY, NZD, USD  pairs and with full automation takes in account every RSI value for the selected Time Frame.  After that, the ind
作者のその他のプロダクト
The standard KDJ indicator is presented by KING.Ai. This indicator were built base on the the theory of  KDJ . KDJ is a very effective and useful strategy to trade especially in swing trading. Method to apply (please also refer to the graphic): 80/20 rule: Price from bottom to top 20 to 80. And price from top to bottom 80 to 20. Both is enter market signal. Indicator period: The indicator is made by period 9,3,3 KING.Ai Forex trader believe that such strategy must complement with other indicato
FREE
The brand new trading indicator using TRIX strategy is exclusive presented by KING.Ai. Exclusive Functions including Mobile Push Notification . This indicator with Three-mode alerts  is  developed by KING.Ai ONLY.   It is probably impossible that you could find a TRIX indicator like this one.  It is very difficult for you to trade with the Trix strategy as there is limited time for traders to monitor every currency. However, the Trix strategy is very profitable especially using in DAY CHAT. It
すべて英語版を参照 分岐戦略を使用している真新しいエキスパートアドバイザーはKING.Aiによって提示されます。 「KING.Ai-div」という名前のKING.Aiの分岐は、あらゆる瞬間に発生する分岐を検出するように特に設計されています。それは秘密の「発散式」を使って構成されました。平均的な勝率は並外れた発散戦略のおかげで 最高80% まで上がっています。それは通常、Fx市場の営業時間の早い時間にオープン注文を出しました。その理由は、通常FX市場の繁忙期に発表されるビッグニュースやテクニカル分析を避けるためです。これは勝ちのパフォーマンスを非常に高めます。 分岐戦略は非常に高い成功率に貢献する非常に強力な方法です。この分析からの主な利点は、それが遅れていないという事実から来ています。価格行動と同様に、発散分析は現在価値に基づいて将来の価格行動を予測する上で非常に有用なサポートです。それが、このEAが非常に有益な理由です。価格が高くなるとチャートに発散が生じますが、使用している指標は低くなります。あなたの指標と価格行動が同期していないとき、それはあなたの注意を必要とする「何か」があなた
The brand new and powerful expert advisor using the breakout strategy is presented by KING.Ai. The characteristic of Tiny Drawdown making it one of the best EA in the market . When you trade with 1 lots, the drawdown is just as low as 16%. If you trade with 0.1 lots, the drawdown is even lowered to 6% . It was the breakout strategy composed by J.Granville Rules , with a “secret formula”. The average winning rate is up high to 80% , contributed by the extraordinary breakout strategy. Breakout str
The brand new trading indicator using the TD Sequential strategy is presented by KING.Ai. This indicator were built base on the the theory of TD Sequential . TD Sequential difficult can by seen by human eye.  Indicator can help to identical the pattern . KING.Ai Forex trader mainly use this strategy to  "See Through" market . We do believe that it is a  powerful method to predict reversal time of trend . Ross Hook were developed by Tom Demark, In the late 1970s he devised some indicators called
The brand new trading indicator Trendline Tunnel is presented by KING.Ai. This indicator were built base on the the theory of  Latest Up and Down Trend line . Latest Trend are difficult can by seen by human eye.  Indicator can help to identical the Trend . KING.Ai Forex trader mainly use this strategy to  "See Through" market . We do believe that it is a  powerful method to show the latest trend and do the breakout trade strategy . General speaking, Trendline Tunnel have following using: Method
フィルタ:
レビューなし
レビューに返信