AQ CurrencyExplorer
- インディケータ
- HIT HYPERTECH INNOVATIONS LTD
- バージョン: 1.0
Currency Explorer is the absolute tool for traders that want to know with quantified certainty the currency strength & weakness of each currency and to trade these by using applicable strategies.
Our machine learning models run and provide the strength/weakness of each currency based on multiple factors besides price action.
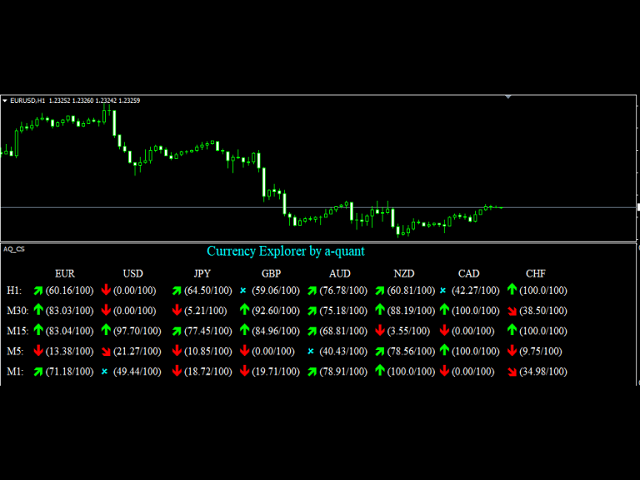
It provides the trader with a QUANTIFIED result for the strength of the 8 most popular and major currencies (EUR, USD, JPY, GBP, AUD, NZD, CAD and CHF) with a scale from 0-100, on 5 out of many timeframes which a user selects!
Users are able to customize Currency Explorer by selecting suitable timeframes and mode (FAST, MEDIUM, SLOW).
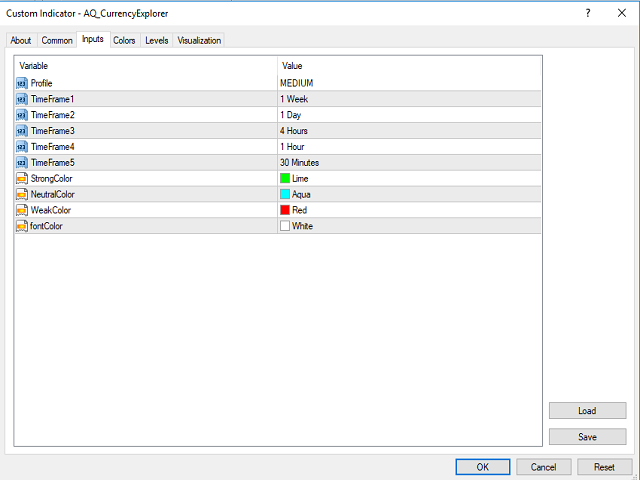
Parameters
- Profile – FAST, MEDIUM and SLOW selection effects the algorithm that calculates the strength of each currency
- TimeFrame1 – timeframe selection
- TimeFrame2 – timeframe selection
- TimeFrame3 – timeframe selection
- TimeFrame4 – timeframe selection
- TimeFrame5 – timeframe selection
- StrongColor – color for strong currencies
- NeutralColor – color for neutral currencies
- WeakColor – color for weak currencies
- fontColor – color for text
The table on the separate chart window shows the selected 5 timeframes and how strong or weak each currency is. For example, on our sample chart, EUR has a 60.16/100 on H1, 83.03/100 on M30, 83.04/100 on M15, 13.38/100 on M5 and 71.18/100 on M1. So it is obvious that:
- On H1 chart EUR is STRONG
- On M30 chart EUR is VERY STRONG
- On M15 chart EUR is VERY STRONG
- On M5 chart EUR is VERY WEAK
- On M1 chart EUR is STRONG
Suggested Strategy 1
- Select a specific timeframe
- Find the strongest currency (the one with 100.0/100) and the weakest currency (the one with 0.00/100).
- Open position in the direction of those two currencies based on which one is strong and which one is weak.
For example, on our sample H1 chart, the strongest currency is CHF and the weakest currency is USD. Suggested position is SHORT on USDCHF.
Suggested Strategy 2
- Select a specific timeframe
- Watch currency strength of each currency and monitor a couple where the first changes from below zero to over zero while the second changes from over zero to below zero. It means that the first one is getting stronger while the second one is getting weaker.
- Open position in the direction of those two currencies based on which one is getting stronger and which one is getting weaker.
For example, on our sample H1 chart, the strongest currency is CHF and the weakest currency is USD. Suggested position is SHORT on USDCHF.


I like the oportunity to see 8 currencies in different time-frames. Good idea. It gives very clear picture about the currency strength and trend. Thanks for sharing free.