KFX Pattern manual
- ユーティリティ
- Marcel Kirchhof
- バージョン: 1.20
- アクティベーション: 5
The KFX PATTERN manual Expert Advisor is a price pattern based System. Manual stands for the fact that he does not open trades independently. Only shows the individual levels with the profit target. The individual strategies are based on those of Thomas Bulkowski's books.
The following Patterns have been integrated:
- Three Falling Peaks.
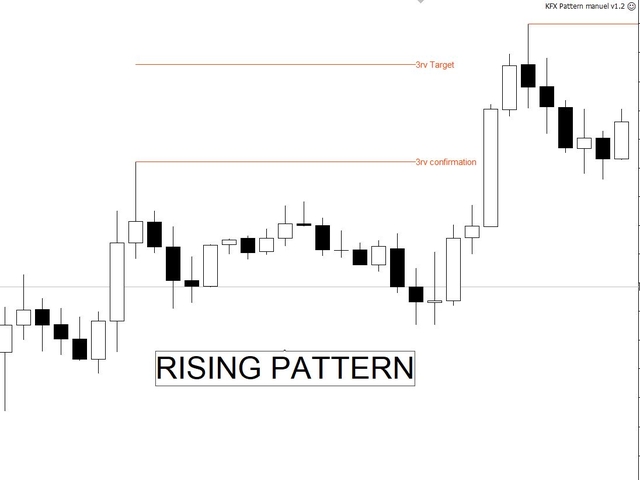
- Three Rising Valleys.
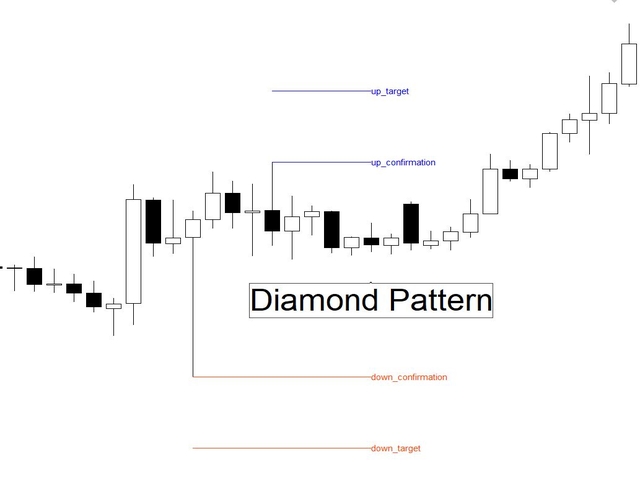
- Diamond Pattern.
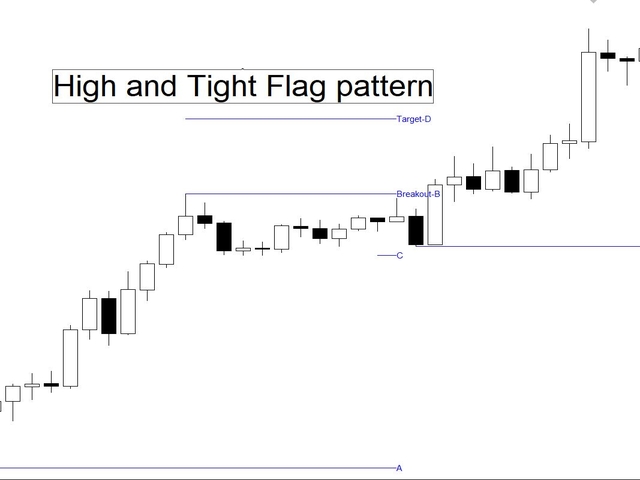
- High and Tight Flags.
- Cup with Handle Pattern.
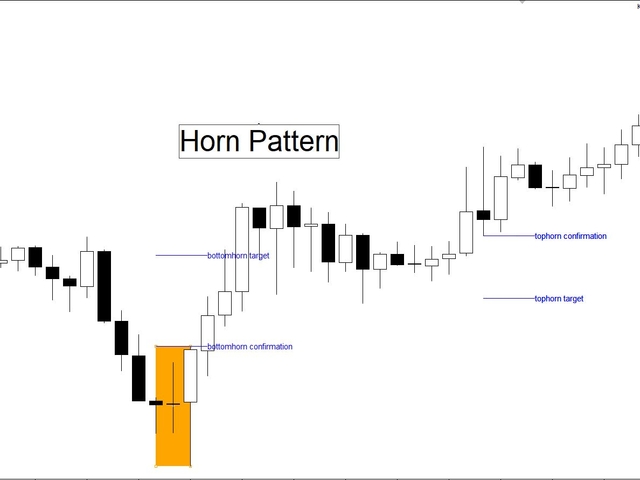
- Horn Top.
- Horn Bottom.
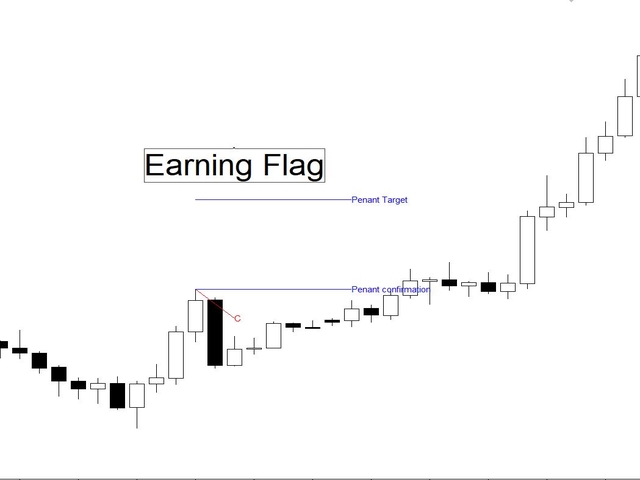
- Earnings Flag.
- Three Line Strike.
- Falling Three Methods.
Short description
- Three Rising Valley - The Chart Pattern is a decent performer in a bull market. It confirms as a valid chart pattern when price closes above the highest peak in the pattern.
- Three Falling Peaks - When price closes below the lowest valley between the three peaks, it confirms the three falling peaks chart pattern as valid.
- Diamond Pattern - You will find Diamond Pattern in a Bull market with an upward breakout, but those in a bear market rank second for overall performance in part with an downward breakout.
- High and Tight Flags - High and tight Flags are the best performing Chart Pattern in both Bull and Bear markets. They are perfect pattern for trend following.
- Cup with Handle - This pattern follows the price curve in a U-shape followed by a handle pattern which breakout up.
- Horn Pattern - Horn Pattern are H-shaped chart patterns. They tend to hide in overbought/oversold markets and pullbacks.
- Earnings Flag - The earnings flag is an event pattern that occurs after a company announces earnings. Price makes a large move, consolidates, and then resumes the trend.
- Three Line Strike - This bullish three line strike acts as a bearish reversal of the upward price trend.
- Falling Three Methods - This falling three methods pattern acts as a reversal of the brief downtrend. Price closes above the top of the five candlesticks, scoring an upward breakout.
Parameters
- Diamond Pattern - turn on, to see this pattern.
- Diamond Percentage meeting target - The measure rule is usually the chart pattern height added to (upward breakouts) or subtracted from (downward breakouts) the chart pattern.
- Min Candles in Diamond - Number of candles on which the pattern is based.
- Three Rising Valley - turn on, to see this pattern.
- 3rv Percentage meeting target - Price target measured between the low from the lowest peak to the highest valley.
- Min Candles between Valleys - Number of candles on which the pattern is based.
- Three Falling Valley - turn on, if you want this pattern in the chart.
- 3fv Percentage meeting target - Price target measured between the height from the highest peak to the lowest valley.
- High Tight Flag pattern - turn on, to see this pattern.
- Retracement Bars - Bars in the retracement before breakout.
- High and Tight Flag Candles - Number of candles on which the pattern is based from the start of the price swing to the end of the price swing.
- Cup_pattern - turn on, to see this pattern.
- 7 to 65 candles duration - Number of candles on which the pattern is based.
- 1 or 2 candles - Point when price rises above the handle.
- Percentage meeting target - Price target of the height from the right Cup lip to the lowest valley.
- Cup rectangle color - Adjustable color for the frame around the cup pattern.
- Top_Horn_Pattern - turn on, to see this pattern.
- %70 percentage meeting target for top horn - Target Level.
- top_horn_rec color - Adjustable.
- Bottom_Horn_Pattern - turn on, to see this pattern.
- %76 percentage meeting target for bottom horn - Target Level.
- bottom_horn_rec color - Adjustable color.
- Earning_Flag_Pattern - turn on, to see this pattern.
- Earning Flag candles - Number of candles.
- Candles in Pennant Flag Pole - Number of Candles in the Flag.
- pennant percentage meeting target - Target Level.
- Three_Line_Strike_Pattern - turn on, to see this pattern.
- Three Line Strike Candles - Number of candles.
- %50 percentage meeting target for 3ls - Target Level.
- three_ls_rect_color - Adjustable color.
- Three_Falling_Method_Pattern - turn on, to see this pattern.
- Three_Falling_Method_Candles - Number of candles.
- %40 percentage meeting target for 3fm - Target Level.
- f3m_rect_color - Adjustable color.
- Drawings - shows the lines and peaks in the chart.
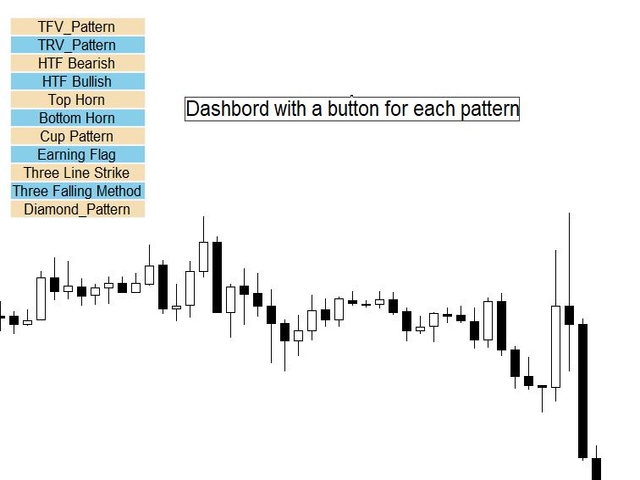
Nice clean UI and EA implementation