• 概要
  • レビュー (2)
  • コメント
  • 最新情報

PS Volume MT4

5

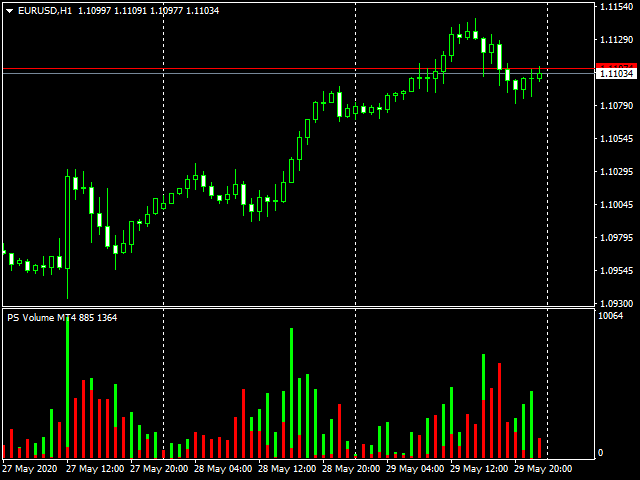
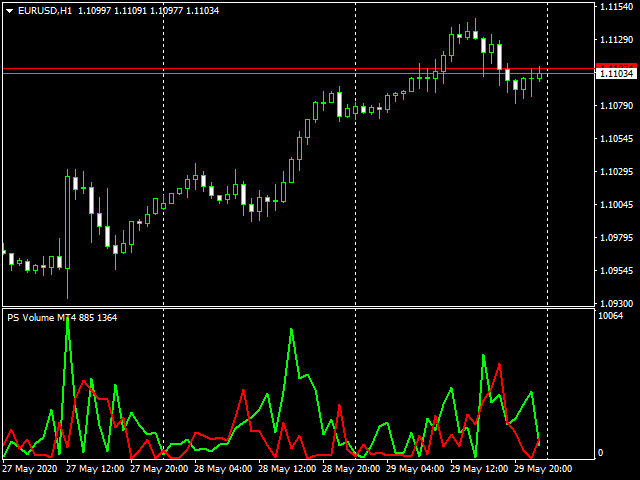
それは、より親しみやすく理解しやすい方法で買い手と売り手の量を示しています。このようにして、クマとブルのどちらが勝つかをより正確に判断できます。

私たちが事前に研究する行動のパターンがありますが、本質的に私たちは意思決定を行う際に自分自身をサポートします。さらに、すでに市場に参入している場合は、トレンドの変化が近づいているかどうかを確認できるため、トレンドの変化の前に終了します。
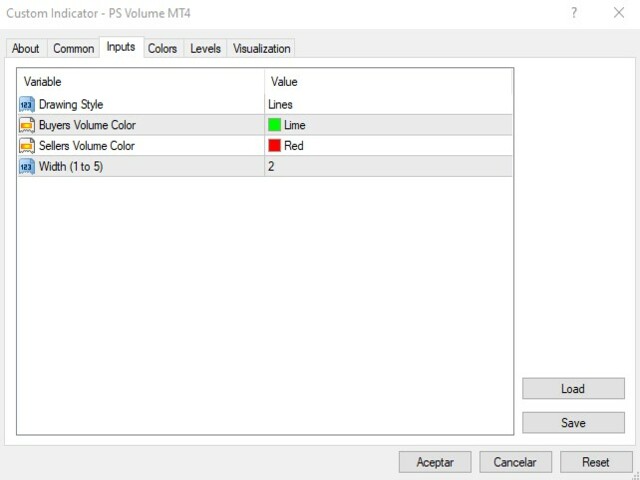
パラメーター

  • 描画スタイル
  • バイヤーボリュームカラー
  • 売り手のボリュームカラー
  • 幅(1〜5)

この製品はMQL5.comでのみ販売されています。他のサイトでの販売は違法です。

私のすべての製品/サイン:   https://www.mql5.com/en/users/mike_explosion/seller#products


レビュー 2
jmhuang
3127
jmhuang 2020.12.12 00:39 
 

excellent volume indicator - responsive and non-lagging

Malcolm David Parker
470
Malcolm David Parker 2020.05.31 12:55 
 

very good indicator for spotting false or real breakouts. good communication from author

おすすめのプロダクト
Mr Beast Trend Reverse
Luis Mariano Vazquez Marcos
MR BEAST TREND REVERSE RECOMENDED H1 EUR USD La estrategia "Trend Reverse" en el mercado de divisas (Forex) es un enfoque utilizado para identificar puntos de reversión de tendencias y capturar cambios de dirección en los precios de los pares de divisas. Esta estrategia se basa en la premisa de que las tendencias del mercado no duran para siempre y que se producirán puntos de inflexión. Este robot de trading de Forex ha sido desarrollado por MRBEAST como una herramienta para facilitar el trading
MT5 version -  https://www.mql5.com/ru/market/product/70171 Unlike other indicators of this type, this version has: The ability to display data from smaller timeframes on the current chart. For example, displaying data from the M1 period on the H1 chart. Calculation of values ​​using the Gaussian formula (normal distribution formula). Flexible system of settings. Settings: basePeriod   - base period. indicatorMode  - display mode. Sets the value of each interval: by4h (4 hours), by6h (6 hours),
Introduction In the fast-paced world of financial market trading, success often hinges on the ability to spot and leverage trends. Among the various strategies available, momentum trading stands out as a powerful tool for traders seeking to capitalize on market movements. In this article, we will delve into the concept of momentum, its significance in trading, and the numerous benefits it offers to traders. What is Momentum? Momentum in trading refers to the tendency of assets to continue movin
Características principales: Estrategia de scalping : El Crow Candles Scalping EA se enfoca en aprovechar movimientos rápidos en el mercado . La estrategia se basa en la identificación de patrones de velas y análisis técnico para tomar decisiones de entrada y salida. 2.Gestión de riesgos avanzada: El EA incorpora una gestión de riesgos sólida para proteger tu cuenta de operaciones. Puedes ajustar los parámetros de stop-loss y take-profit para adaptar el nivel de riesgo a tus preferencias. 3.Co
Индикатор рисует уровни Фибоначчи с выделенными Ценовыми метками.При установке индикатора на график необходимо создать трендовую линию с именем указанным в поле" Unique name of trend line to place fib on ". По умолчанию имя=" Unique name of trend line to place fib on"  =     "+"    .В индикаторе можно заменить уровни фибоначчи по своему усмотрению.Также меняются цвет,стиль,толщина линий и т. д.
FREE
Quatre is a trend indicator, it indicates well the points of the beginning of the trend and its completion or reversal. This indicator is characterized by the following behavior: After a trend movement appears on the market, the indicator sends a signal of its beginning in the form of arrows. Quatre is a mathematical averaging of prices, and based on this, one can assume the direction of price movement (trend) in the future. Against the background of insignificant fluctuations, it is possible t
Colored indicator of the linear channel based on the Fibonacci sequence. It is used for making trading decisions and analyzing market sentiment. The channel boundaries represent strong support/resistance levels, as they are the Fibonacci proportion levels. Users can select the number of displayed lines of channel boundaries on the chart by means of the input parameters. Attaching multiple instances of the indicator to the chart with different calculation periods leads to displaying a system of c
Simply drop the indicator to the graph and support and resistance levels will be shown automatically! The indicator for automatic drawing of support and resistance levels based on THREE points. Identified points are marked on the chart Indicator shows break through price for both bullish and bearish trends (if found) You can specify on how many bars the indicator shall look in order to identify supporting points. In addition, you can select on which time frame the indicator will work. That means
Global Trend Indicator, shows the signals for entry. Displays both entry points and the trend itself. Shows statistically calculated moments for entering the market with arrows. When using the indicator, the risk factor can be optimally distributed. Settings: Uses all one parameter for settings. Choosing a parameter, it is necessary to visually resemble it so that the appropriate graph has a projection of extremes. Parameters: Length - the number of bars for calculating the indicator.
Mr Beast MACD
Luis Mariano Vazquez Marcos
MR BEAST MACD Momentum Signals BUY SELL   es una poderosa herramienta diseñada para optimizar las decisiones de trading al identificar oportunidades clave de compra y venta en los mercados financieros. Basado en el popular indicador MACD (Moving Average Convergence Divergence), este sistema utiliza algoritmos avanzados para generar señales precisas que reflejan cambios significativos en la dinámica del mercado. Características Destacadas: Señales de Compra y Venta Precisas: El Indicador MACD Mo
Dynamic SR Trend Channel Dynamic SR Trend Channel is a simple indicator for trend detection as well as resistance/support levels on the current timeframe. It shows you areas where to expect possible change in trend direction and trend continuation. It works with any trading system (both price action and other trading system that use indicators) and is also very good for renko charting system as well. In an uptrend, the red line (main line) serves as the support and the blue line serves as the
Mini FFMV Dashboard and CSM
Opengates Success International
1 (1)
Mini Forex Market-View Dashboard and Mini-CSM Mini Full Forex Market View Dashboard is a miniature creation of FULL FOREX MARKET_VIEW Custom indicator created to give the Traders a full view of what is going on in the market but in a partial matter to make it conscise. It is useful most especially for those who don't like bogus indicators or those who have a PC with limited screen size. It uses a real time data to access the market and display every bit of information needed to make a successful
Femade Indie
Opengates Success International
Femade Indie Vs 1.0 is a simple but multi-currency monitoring Indicator created to instantly notify the trader when an attached currency pair is ready to buy, sell or give signal when such currency pair is getting ready for a big move either up or down. It does this by visual aids on the screen charts, sound and pop-up alerts. If it shows " Medium ", this means that the so called currency signal is almost gone but can still be traded provided the trader will not need a lot of pips which can be b
このインジケーターは、エリオット波動理論と組み合わせて作動し、2つの方法で使用されます: 自動モード: このモードでは、インジケーターがチャート上の全ての5つのモーティブ波を自動的に検出し、予測とポテンシャルな逆転ゾーンを提供します。また、アラートやプッシュメッセージを生成する能力も備えています。この自動機能により、エリオット波動パターンの識別と分析のプロセスが効率化されます。 手動モード: このオプションは、エリオット波動理論を手動で扱いたいトレーダー向けです。9つの段階を使用して波を描画することができます。各段階は、表示された後に描画されたラインを調整して個別に定義できます。この機能により、手動で波を描画するプロセスがより効率的になります。重要な点として、すべての描画データが将来の参照のためにプラットフォームのデータフォルダに保存されることに注意してください。 パラメータ: Name: インジケーターの名前。 Use_System_Visuals: インジケーターのテーマを有効または無効にして、取引プラットフォーム全体の外観に合わせます。 Explain_Comment: 波の番号
Description ABC Trend Levels is an indicator that identifies market trends and important trend support and resistance levels. Recommendations You can use this indicator to determine the trend and, accordingly, to determine the direction of opening a position or closing an opposite position. Parameters ===== _INDICATOR_SETTINGS_ ===== - indicator settings Maximum History Bars - maximum number of history bars for calculating the indicator. Average True Range Period - ATR indicator perio
This is a fully automatic Expert Advisor. It can trade any market, any timeframe and any currency pair. The EA uses simple indicators like SMA, RSI and CCI, and a smart martingale system, that does not open systematical new positions, but waits for a new signal for each new order, wich is limiting drawdown compared to other martingale systems. It uses a combination of seven strategies you can select in the parameters to fit your needs. The strategy tester in MetaTrader 4 can give you the setup y
Parabolic SAR plus is a simple indicator that lets you know when the Parabolic-Sar might turn its direction. For long-term-trends activate an moving average and set a trend-value in these indicator Notice comes via screen-alert, email and notification Filter MA, MA-Channel (high / low) Alerts alert, push-notification, arrows, send email Advantages Signal after close, no repaint, no cross-over signal best Timeframes: H1 all Major-Forex-Pairs Send custom email header Important rule Look for an ins
Introducing our innovative trading indicator, designed to transform the way you analyze price movements. The [Indicator Name] goes beyond traditional methods by dynamically drawing two distinct trends on the chart. The space between these trends acts as a unique reflection surface, providing valuable insights into potential market reversals and trend continuations. Key Features: Dual Trend Drawing: Automatically draws two trends on the chart, creating a visually distinctive analysis of price mov
Optimized for Asia- London- US- Open-Session  the best Features from MOMENTUM-SOLO true Momentum - time-based Indicator it's based on a self-developed candle Pattern, in relation to the ATR Filter Daytime Weekdays Moving Averages Keltner-Channel Advantages Optimized for Asia- London- US- Open-Session choose your personal times to trade - select Daytime and Weekdays Keltner-Channel => to reduce market noise - sideways movement will be hidden 3x Moving Averages => for the Trend Sig
The Spurts trend indicator is used to determine the strength and direction of a trend and to find price reversal points. The trend can be ascending (bullish) and decreasing (bearish). In most cases, the trend grows for a long time and falls sharply, but there are exceptions in everything. The price movement can be influenced by economic and political news. A trend is a stable direction of price movement. To find it, the indicator uses calculations designed to smooth out sharp fluctuations tha
Jerk Trend is a new product that allows you to identify the current market phase (uptrend, downtrend or flat). Represents a typical investor strategy that usually indicates a trend change from bearish to bullish. A tool that allows you to determine the direction and strength of a trend. Unlike most indicators, Jerk Trend finds longer-term trends and gives fewer false signals. This indicator displays arrows of different colors depending on the current state of the market and thus signals the u
矢印インジケーター「クールボリューム」は、Mt4のティックボリュームに基づいています。 インジケータ自体は、一定期間(時間枠の選択)で購入または売却するボリュームの数を追跡します。 そして、売り手または買い手の量が異常に過剰になると、それは売るか買うためのシグナルを与えます。 色付きのヒストグラムは下のウィンドウに描かれており、緑色は現時点での買い手の優位性を示しています。これは、この価格帯で増加する可能性のある即時の逆転を意味します。 逆に、赤い色は売り手の優位性を示しており、これは潜在的な即時の下向きの逆転を意味します。 また、視覚的な利便性のために、矢印がメインチャートウィンドウに直接追加されました。 ユーザーの便宜のために、外部変数には、信号の周波数と履歴(HistoryBars)上のそれらの数の設定変数が含まれています。 ただし、値を1000を超えるように設定することはお勧めしません。 これの多くはあなたの端末のパフォーマンスを遅くします。 また、"===<<矢印設定>>>==="セクションでは、任意の矢印とヒストグラムパラメータを自分で設定することがで
Arbitrage MACD: Your Key to Analyzing Market Trends The Arbitrage MACD is a cutting-edge indicator designed to assist traders and investors in analyzing market trends with greater precision and confidence. MACD, which stands for Moving Average Convergence Divergence, is a well-known and widely used tool in the financial world, and the "Arbitrage MACD" takes its functionality to the next level. This innovative indicator offers a comprehensive analysis of the relationship between two moving a
The Flying Volume indicator is a specialized volume indicator. It deciphers the volume data after heavy proprietary number crunching. When a main signal is found Flying Volume will look for possible continuation points. The main signal is shown by arrows, the continuation points by dots. Volume indicators are most often used on higher timeframes. Features Main Buy or Sell signals Continuation signals No repainting One signal per bar Settings Flying Volume default settings are good enough mos
Top Gun Oscillators
Safwan Rushdi Khalil Arekat
5 (3)
Note : New in 1.6: the indicator now exports the trade signal (but not displayed). Go long with light blue. Go short with red. Exit otherwise. Signal to be imported to your EA using iCustom. This indicator provides Best of the Best linear filter momentum oscillators that I am aware of (Low Pass Differentiators, LPD's) . All of them are  recent developments by this developer, or other researchers. The oscillator line is the first buffer of the indicator, and can be called  in other indicators or
FREE
NAM Divergences
NAM TECH GROUP, CORP.
5 (1)
MT4マルチタイムフレームの発散と売られ過ぎ/売られ過ぎの検出インジケーター。 特徴 -チャートコントロールパネルで完全にカスタマイズ可能で、完全な相互作用を提供します。 -必要な場所でコントロールパネルを表示および非表示にします。 -資本化されていない発散に関するリアルタイムの情報。 -売られ過ぎ/売られ過ぎの状況に関するリアルタイム情報。 -定期的な発散に関するリアルタイムの情報。 -隠れた発散に関するリアルタイム情報。 -発散検出に使用できる発振器:AO、RSI、CCI、MACD、STOCH、RMI、TDI、RSIOMA。 -通知サービス(画面アラート|プッシュ通知)。 概要 発散取引を使用すると、弱体化傾向や勢いの逆転を見つけるのに役立ちます。トレンドが続くためのシグナルとして使用できる場合もあります。私たちのツールは、チャートを可能な限りクリーンに保つために、表示と非表示の可能性を備えた驚くほど快適で直感的なコントロールパネルで、すべての時間枠で同時に発散検出を提供します。 選択した履歴期間に、買われ過ぎと売られ過ぎの
シグナルトレーディングインジケーター Sea Candles MT4は、CCIオシレーターを使用して価格の動きの方向を決定し、ポジションを開くための信号を生成します。 商品チャネル指数[CCI]-移動平均からの価格の偏差を測定します。 価格が新しい高値に達し、CCIが以前の高値を上回ることができないときに発散が表示されます。 この古典的な相違の後には、通常、価格修正が続きます。 CCIは通常±100の内で及びます。 ±100の上/下の値は、買われ過ぎ/売られ過ぎの状態と是正的な増加の確率について知らせます。 指標に関する情報 指標はローソク足の形で提示され、市場の状態に応じて4色で塗られます。 また、便宜上、インジケータに存在するすべての色はメインメニューで作成されます。 インジケータは、端末、電話、メールで通知を提供します。 色の変化に応じてトリガーされます。 指標の使い方  指標の色に応じて、私たちは売買します。 通知はすべてのケースに対して提供されます。 あなたは色と彼らがスクリーンショットで何を意味するのかを詳しく見ることができます。 また、す
This Indicator will notified you when market going to trend reversal, build with candlestick pattern strategy  --> Sell Reversal Notification will flag with the Yellow arrow --> Buy Reversal Notification will flag with the Pink arrow After Flag Appear, the market usually reverse but carefully you must performs double check because weakness of this indicator when market in the middle of the trend
The HHHC-LLLC indicator uses candle by candle analysis, based on the principle of trend confirmation from Higher High, Higher Close candles (bullish) and Lower Low, Lower Close candles (bearish). There is no lag, no re-painting, and averaging is not used. HHHC-LLLC helps confirm: market structure and levels - look left to see them line up trends, pullbacks & reversals Bull moves (blue), Bear moves (red) Structure Zig Zags (black dotted lines), for summarizing market moves exhaustion and stalling
The indicator draws trend lines based on Thomas Demark algorithm. It draws lines from different timeframes on one chart. The timeframes can be higher than or equal to the timeframe of the chart, on which the indicator is used. The indicator considers breakthrough qualifiers (if the conditions are met, an additional symbol appears in the place of the breakthrough) and draws approximate targets (target line above/below the current prices) according to Demark algorithm. Recommended timeframes for t
このプロダクトを購入した人は以下も購入しています
まず第一に、この取引インジケーターは再描画されず、再描画されず、遅延しないことを強調する価値があります。これにより、手動取引とロボット取引の両方に理想的なものになります。 アトミックアナリストは、価格の強さとモメンタムを利用して市場でより良いエッジを見つけるためのPA価格アクションインジケーターです。ノイズや誤ったシグナルを除去し、取引ポテンシャルを高めるための高度なフィルターを備えています。複雑なインジケーターの複数のレイヤーを使用して、アトミックアナリストはチャートをスキャンし、複雑な数学的計算をシンプルなシグナルと色に変換します。これにより、どのような初心者トレーダーでも理解して使用し、一貫した取引の決定を行うことができます。 「アトミックアナリスト」は、新規および経験豊富なトレーダー向けにカスタマイズされた包括的な取引ソリューションです。プレミアムインジケーターとトップノッチの機能を1つの取引戦略に組み合わせ、すべてのタイプのトレーダーにとって汎用性のある選択肢にします。 デイリートレーディングとスキャルピング戦略:高速で正確なデイトレーディングおよび短期トレード
現在20%OFF! 初心者やエキスパートトレーダーのためのベストソリューション! このダッシュボードソフトウェアは、28の通貨ペアで動作しています。それは私達の主要な指標(高度な通貨の強さ28と高度な通貨インパルス)の2に基づいています。それは全体の外国為替市場の大きい概観を与えます。それは、すべての(9)時間枠で28の外国為替ペアのための高度な通貨の強さの値、通貨の動きの速度と信号を示しています。チャート上で1つのインディケータを使用して市場全体を観察し、トレンドやスキャルピングの機会をピンポイントで見つけることができたら、あなたのトレードがどのように改善されるか想像してみてください。 このインディケータには、強い通貨と弱い通貨の識別、潜在的な取引の識別と確認がより簡単になるような機能が搭載されています。このインディケータは、通貨の強さや弱さが増加しているか減少しているか、また、すべての時間枠でどのように機能しているかをグラフィカルに表示します。 新機能として、現在の市場環境の変化に適応するダイナミックなマーケットフィボナッチレベルが追加され、すでに当社のAdvan
A key element in trading is zones or levels from which decisions to buy or sell a trading instrument are made. Despite attempts by major players to conceal their presence in the market, they inevitably leave traces. Our task was to learn how to identify these traces and interpret them correctly. Reversal First Impulse levels (RFI)   -  Version MT5                INSTRUCTIONS                 RUS                 ENG                                       R ecommended to use with an indicator   -  
驚異的なFXインジケーター「Miraculous」をご紹介します。完璧な結果を得るための1時間足を含むすべてのタイムフレームで効果的に機能する、最強の強力な特殊MT4フォレックスインジケーターです。 すべてのタイムフレームで優れた結果を提供する最高のFXインジケーターを探し続けるのに疲れましたか?これ以上探す必要はありません!「Miraculous」フォレックスインジケーターをご紹介します。このインジケーターは、トレーディングの経験を変革し、収益を新たなレベルに引き上げるために設計されました。 先進のテクノロジーと長年にわたる緻密な開発に基づいて構築された「Miraculous」フォレックスインジケーターは、FX市場における力と正確さの頂点となります。この素晴らしいツールは、すべてのレベルのトレーダーのニーズを満たすように設計されており、一貫した収益性を追求する上で比類のない優位性を提供します。 「Miraculous」フォレックスインジケーターの他との違いは、その非常に適応性にあります。デイトレーダー、スウィングトレーダーであろうと、長期ポジションを好む方であろうと、このインジケータ
TrendMaestro
Stefano Frisetti
5 (2)
note: this indicator is for METATRADER4, if you want the version for METATRADER5 this is the link: TRENDMAESTRO recognizes a new TREND in the bud, he never makes mistakes. The certainty of identifying a new TREND is priceless. DESCRIPTION TRENDMAESTRO identifies a new TREND in the bud, this indicator examines the volatility, volumes and momentum to identify the moment in which there is an explosion of one or more of these data and therefore the moment in which prices have strong probability of f
FX Volume
Daniel Stein
4.6 (35)
mql5と Telegramの モーニング・ブリーフィングで、詳細とスクリーンショットを含む毎日のマーケット・アップデートをご覧 ください! FX Volumeは、ブローカーの視点から市場のセンチメントをリアルに洞察する、最初で唯一の出来高インジケーターです。 ブローカーのような機関投資家が外国為替市場でどのようなポジションをとっているか、COTレポートよりもはるかに速く、素晴らしい洞察を提供します。 この情報をチャート上で直接見ることは、あなたの取引にとって真のゲームチェンジャーであり、画期的なソリューションです。 以下のようなユニークなマーケットデータ洞察から利益を得てください。 比率は 、通貨のロングポジションとショートポジションの比率をパーセントで表示します。 比率の変化は 、選択した期間内のロング比率とその変化率を表示します。 Volumes Totalは 、通貨の取引量(ロングとショート)の合計をロット単位で表示します。 Volumes Long :全通貨のロングポジションの取引量を表示します。 Volumes(ショート )は、全通貨のショートポジションの取引量を表示
How to use Pair Trading Station Pair Trading Station is recommended for H1 time frame and you can use it for any currency pairs. To generate buy and sell signal, follow few steps below to apply Pair Trading Station to your MetaTrader terminal. When you load Pair Trading Station on your chart, Pair Trading station will assess available historical data in your MetaTrader platforms for each currency pair. On your chart, the amount of historical data available will be displayed for each currency pai
Cycle Sniper
Elmira Memish
4.4 (35)
NEW YEAR SALE PRICE FOR LIMITED TIME!!! Please contact us after your purchase and we will send you the complimentary indicators to complete the system Cycle Sniper is not a holy grail but when you use it in a system which is explained in the videos, you will feel the difference. If you are not willing to focus on the charts designed with Cycle Sniper and other free tools we provide, we recommend not buying this indicator. We recommend watching the videos about the indiactor and system before pu
TakePropips Donchian Trend Pro
Eric John Pajarillaga Aldana
4.82 (17)
TakePropips Donchian Trend Pro   (MT4) は、ドンチャン チャネルを使用してトレンドの方向を自動的に検出し、エントリーとエグジットの取引シグナルを提供する強力で効果的なツールです! この多機能インジケーターには、トレンド スキャナー、取引シグナル、統計パネル、スクリーナー、取引セッション、およびアラート履歴ダッシュボードが含まれます。取引シグナルを提供し、チャートを分析する時間を節約するように設計されています! ユーザー マニュアルとインストール ガイドは、ブログ投稿 (   https://www.mql5.com/en/blogs/post/751368   ) からダウンロードできます。 今日は 50% オフ! 98ドルから49ドルに値下げ! このインジケーターは、ストラテジー テスターでテストできます (ビジュアル モードを有効にします)。ライブ チャートでテストしたい場合は、7 日間の試用版を入手するようにメッセージを送ることもできます。 詳細については、説明の下にあるビデオ チュートリアルも利用できます。 ご不明な点やサポートが必
TPA True Price Action indicator reveals the true price action of the market makers through 100% non-repainting signals (except early signals mode) strictly at the close of a candle! TPA shows entries and re-entries, every time the bulls are definitely stronger than the bears and vice versa. Not to confuse with red/green candles. The shift of power gets confirmed at the earliest stage and is ONE exit strategy of several. There are available now two free parts of the TPA User Guide for our custo
Indicator : RealValueIndicator Description : RealValueIndicator is a powerful tool designed specifically for trading on the EURUSD pair. This indicator analyzes all EUR and USD pairs, calculates their real currency strength values, and displays them as a single realistic value to give you a head start on price. This indicator will tell you moves before they happen if you use it right. RealValueIndicator allows you to get a quick and accurate overview of the EURUSD currency pair tops and bottoms,
Step into the realm of Forex trading with confidence and precision using XQ, a cutting-edge Forex indicator designed to elevate your trading game to unprecedented heights. Whether you're a seasoned trader or just stepping into the world of currency exchange,   XQ Forex Indicator   empowers you with the insights and signals needed to make informed trading decisions. The signal conditions are a combination of three indicators, and XQ Forex Indicator only display  medium and long-term trends . The
ON Trade Waves Patterns Harmonic Elliot Wolfeをご紹介します。これは手動および自動の方法を使用して市場のさまざまなパターンを検出するために設計された高度なインジケーターです。以下はその動作方法です: ハーモニックパターン: このインジケーターは、チャートに表示されるハーモニックパターンを識別できます。これらのパターンは、Scott Carneyの「Harmonic Trading vol 1および2」で説明されているように、ハーモニックトレーディング理論を実践するトレーダーにとって重要です。手動で描画するか、自動検出に頼るかにかかわらず、ON Trade Waves Patternsがお手伝いします。 コントロールパネル: このインジケーターはユーザーフレンドリーなコントロールパネルを備えています。チャートと時間枠の設定を保存し、異なる構成間をスムーズに切り替えることができます。チャートスペースを最大限に活用するために最小化することもできます。他の分析ツールで作業することを好む場合、閉じるボタンをクリックするだけで、すべてのインジケーターデ
現在20%OFF! このダッシュボードは、複数のシンボルと最大9つのタイムフレームで動作するソフトウェアの非常に強力な部分です。 このソフトは、弊社のメインインジケーター(ベストレビュー:Advanced Supply Demand)をベースにしています。    Advanced Supply Demand ダッシュボードは、素晴らしい概要を提供します。それは示しています。  ゾーン強度評価を含むフィルタリングされた需給値。 ゾーン内/ゾーンへのPips距離。 ネストされたゾーンがハイライトされます。 選択されたシンボルの4種類のアラートを全ての(9)時間枠で提供します。 それはあなたの個人的なニーズに合わせて高度に設定可能です。 あなたの利益! すべてのトレーダーにとって最も重要な質問です。 市場に参入するのに最適なレベルはどこか? 成功のチャンスとリスク/リターンを得るために、強力な供給/需要ゾーン内またはその近くで取引を開始します。 損切りの最適な位置はどこですか? 最も安全なのは、強力な供給/需要ゾーンの下/上にストップを置くことで
このインジケータは、手動および自動的な方法でチャートに描かれたハーモニックパターンを検出します。ユーザーマニュアルは、このリンクから参照できます: あなたのレビューを追加し、入手するために私たちに連絡してください。 この製品をmt4で試すための無料版があります。 GartleyおよびNenstarパターンを検出するために使用できます。 https://www.mql5.com/en/market/product/30181 完全なMT4バージョンを購入するには、次の場所から購入できます。 https://www.mql5.com/en/market/product/15212 注 インジケータにはコントロールパネルがあり、すべての(チャート&時間枠)設定が保存されます。チャート上でスペースをより多く確保するために、最小化することができ、他の分析ツールで作業する場合は、すべてのインジケータデータを非表示にするために閉じるボタンを押すことができます。 このインジケータを使用して設定を変更し、移動平均やボリンジャーバンドなどのインジケータを追加すると、編集のテンプレートが自動的に保存され、必
Ultimate Sniper Dashboard
Hispraise Chinedum Abraham
4.84 (25)
299ドルで割引中! 今後値上げの可能性あり! 下の説明を読んでください! 究極のスナイパーダッシュボードのための最高のエントリーシステム。究極のダイナミックレベル。(私の製品をチェックしてください) 究極のスナイパーダッシュボードはMT4多通貨テスト制限のため、ライブマーケットでのみ作動します。 究極のスナイパーダッシュボードをご紹介します。HA-Sniper、MA-Sniper、その他多くの特別なモードが含まれる最高の製品です。究極のスナイパーダッシュボードは絶対的な獣です! 初心者やエキスパートトレーダーにとって最高のソリューションです。もう二度と動きを見逃さない! シンプルさとピップを愛するトレーダーのために、特別な製品をご用意しました。シンプルでありながら、ダッシュボードは複数のカスタムアルゴリズムに基づき28の通貨ペアを監視し、すべての作業を行います。たった一つのチャートで、プロのように市場を読み解くことができます。もし、為替ペアが動き出したときに、その方向性を正確に特定することができれば、あなたの取引はどれほど改善されることでしょう。   当社のシ
PZ Day Trading
PZ TRADING SLU
3.67 (3)
このインディケータは、価格アクション分析とドンチャンチャネルのみを使用して、ジグザグ方式で価格の反転を検出します。再描画やバックペインティングを一切行わずに、短期取引向けに特別に設計されています。それは彼らの操作のタイミングを増やすことを目指している賢明なトレーダーにとって素晴らしいツールです。 [ インストールガイド | 更新ガイド | トラブルシューティング | よくある質問 | すべての製品 ] 驚くほど簡単に取引できます すべての時間枠で価値を提供します 自己分析統計を実装します 電子メール/音声/視覚アラートを実装します 可変長のブレイクアウトと混雑ゾーンに基づいて、インディケータは価格アクションのみを使用して取引を選択し、市場が非常に高速に行っていることに反応します。 過去のシグナルの潜在的な利益が表示されます この指標は、独自の品質とパフォーマンスを分析します 負けブレイクアウトは強調表示され、説明されます インジケータは、非バックペインティングおよび非再ペイントです この指標は、日中のトレーダーが単一の価格反転を見逃さないようにするのに役立ちます。ただし、す
Please send me Direct message on MQL5 CHAT after purchasing the Indicator for Training and Installation Support There are some additional files that is important to use with the Indicator . So be sure to contact me after purchasing the Indicator So that I can add you for training and support . If you find any difficulty with installation then send me Direct message here So that I can connect with you via Anydesk or Teamview for the product installation. " Smart Order Block Indicator " to find
Gann Signal is a very simple indicator at first glance, but hidden inside is many years of experience in studying W.D.Ganna methods. The indicator gives accurate BUY/SELL signals, without redrawing. The indicator is very easy to use. All you need to do is attach it to your chart and follow its recommendations. The indicator constantly analyzes the market for entry opportunities. When such an opportunity appears, the indicator gives a signal in the form of an arrow. I repeat, all signals are NOT
StalkeR Arrow
Abdulkarim Karazon
5 (4)
StalkeR Arrow は、バーオープン/バー内で売買シグナルを与える矢印インジケーターです。このインジケーターは価格行動パターンとフラクタルに基づいています。 このインジケーターは、各買いシグナルと売りシグナルの tp と sl を与えます。tp と sl は各シグナルの上下の線の形式であり、新しいシグナルが形成されるまで延長されます。 このインジケーターには、履歴シグナルの勝敗統計を提供するバックテスト パネル/ダッシュボードがありますが、このインジケーターは再ペイントやバックペイントを行いません。 パラメーター : StalkeR 周期 : 矢印周期、数値が大きいほど信号が少なくなります スプレッド: ポイント単位のスプレッド値を使用して、パネル上の勝敗を計算します。 ストップロス ATR x : atr 乗算における SL 値 Takeprofit ATR x : atr乗算のTP値 ATR 期間 : に基づいて tp と sl を計算するために使用する atr 期間 TP/SL ラインの色と幅 矢印の色と幅 パネル/ダ
もちろんです。以下は、提供いただいたテキストの日本語への翻訳です: MT4用の天文学指標をご紹介します:究極の天体トレーディングコンパニオン トレーディング体験を天空の高みに高める準備はできていますか?私たちの革命的なMT4用の天文学指標をご紹介します。この革新的なツールは、複雑なアルゴリズムの力を借りて、類まれなる天文学的洞察と精密な計算を提供します。 あなたの指先で宇宙の情報を: 宝のような天文学的データが明らかになる包括的なパネルをご覧ください。惑星の地理的/太陽中心座標、太陽と地球の距離、星の大きさ、伸び、星座、黄道座標および赤道座標、さらには水平座標まで、それぞれが綿密に計算され美しく表示されています。指標によって生成される垂直線は時間値に対応し、トレーディングの旅に宇宙の視点を提供します。 惑星のラインと関係: グラフを飾る惑星のラインの魔法を体験し、スケールと角度をカスタマイズできます。直感的なコントロールパネルを介して各惑星のラインの表示を簡単に切り替えることができます。指定された時刻範囲内での合会、六分会、四分会、三分会、対会、逆行の指標で天体の関係の芸術を発見してく
[ MT5 Version ] Order Block Indicator MT4 Order Block Indicator MT4  is currently the most accurate and customizable indicator in the market. It has been developed to facilitate the analysis of operations based on Order Blocks and Supply and Demand Zones. These zones are possible reversal points of a movement. Order Blocks indicate a possible accumulation of orders in one area. The price usually gets to reach and react strongly to those areas. The most relevant levels for this reaction are the c
Reversal Sniper is designed to find the extreme reversals of the price. Indicator collects data of Cycle Sniper Indicator. NOTE: REVERSAL SNIPER Indicator is made for Cycle Sniper Users as an additional tool.  However, it can be used by the traders who look for finding out strong reversal levels. Indicator works on all timeframes and all instruments. Reversal  Sniper  Checks: Harmonic Patterns RSI Zig Zag and Harmonic Swings Cycle Sniper Indicator's Buy / Sell Signals The complex algo i
Th3Eng PipFinite PRO Indicator This product is distinct from the Th3Eng PipFinite Original, utilizing a different logic and algorithms. The Th3Eng PipFinite Pro indicator offers analysis of trend directions using custom algorithms. It provides indications of trend direction, entry points, a stop loss point, and three take profit points. The indicator also displays pivot points, dynamic support and resistance channels, and a side-box with detailed current signal information. How to Trade with
This Indicator does not repaint itself at all, it's identifies a new TREND in the bud, this indicator examines the volatility, volumes and momentum to identify the moment in which there is an explosion of one or more of these data and therefore the moment in which prices have strong probability of following a new TREND. CandleBarColorate never misses a beat, he always identifies a new TREND in the bud without error. This indicator facilitates the reading of charts on METATRADER; on a single wi
Candle Power Pro
Thushara Dissanayake
4.33 (6)
Candle Power Pro インジケーターを使用して、実際のボリューム情報の力を解き放ちます。この動的ツールは、各ローソク足の実際の体積データを取得し、それを総体積のパーセンテージとして表示します。そうすることで、市場での買い手と売り手の間で進行中の争いを識別できるようになります。 Candle Power Pro は、買い手と売り手の争いを総取引高に対する割合として表示し、市場のダイナミクスに関する貴重な洞察を提供します。買い手と売り手のボリュームを分析することでブレイクアウトを簡単に確認でき、より正確なエントリーポイントとエグジットポイントを確保できます。さらに、買い手と売り手のボリュームを利用して傾向を確認することができ、取引戦略の信頼性が高まります。さらに、買い手と売り手の量の変化を分析することでトレンドの反転を特定できるため、市場の変化に先んじることができます。 このインジケーターは、取引体験を向上させるためのさまざまな機能を提供します。簡単に視覚化できるようにボリューム平均を線として描画したり、ボリュームのパーセンテージを他の 19 個のシンボルと比較してさらに分析し
Features for software Main functions: Accurate entry signals WITHOUT REPAINTING! Once a signal appears, it remains valid! This is a significant distinction from repainting indicators that might provide a signal and then alter it, potentially leading to deposit losses. Now, you can enter the market with higher probability and precision. There's also a function to colour candles after an arrow appears until the target (take profit) is reached or a reversal signal appears . Display of STOP LOSS
Weis Wave with Alert
Trade The Volume Waves Single Member P.C.
4.79 (19)
Rental/Lifetime Package Options and Privileges' * For optimum results the yearly or lifetime package is suggested due to live training and Discord  channel trading with the  creator! Rent Monthly Six Months   Yearly/Lifetime Weis Wave with Speed with Alert+Speed Index x x x Manual  x x x Quick Set up Video x x x Blog x x x Lifetime Updates x x x Setup and Training Material x x Free Rectangle Break Alert Tool      x Discord Access Channel "The SI traders" x 2-hour live methodology traini
マーチンゲールアローは、マーチンゲールバイナリーオプション取引用に設計された矢印タイプのMT4インジケーターで、この矢印はバーオープン/バー内に印刷され、アラートを与えます。 使用方法: 矢印が表示された瞬間に取引を開始し、取引が勝った場合は次のシグナルを待って同じロットを取引します。次のシグナルでトレードがダブルロットを失い、シグナルが勝つまでそれを続けた場合、リセットして最初のトレードロットでトレードします。 推奨される期間 : 任意 最低入金額: 200 ユニット。 このインジケーターはライブでは再ペイント/バックペイントを行いません。 -------------------------------------------------- ------------- パラメーター : インジケーター期間: これを変更すると、異なるシグナルが表示されます。 インジケーターの価格/種類 買われすぎ/売られすぎレベル アラート入力 矢印スタイル ========================================
System Trend Pro - This is the best trend trading indicator!!! The indicator no repaint!!!   The indicator has   MTF   mode, which adds confidence to trading on the trend (   no repaint   ). How to trade? Everything is very simple, we wait for the first signal (big arrow), then wait for the second signal (small arrow) and enter the market in the direction of the arrow. (See screens 1 and 2.) Exit on the opposite signal or take 20-30 pips, close half of it, and keep the rest until the oppo
作者のその他のプロダクト
PS Apollo EA MT5
Miguel Angel Vico Alba
5 (1)
EA は、単一のチャートとウィンドウ上で 4 つの通貨ペア (EURAUD、EURGBP、EURUSD、GBPUSD) と同時に機能します。 EA を複数のウィンドウに配置すると、EA によって取引が複製されるため、これを理解することが重要です。 「マーケットウォッチ」リストに EURAUD、EURGBP、EURUSD、GBPUSD があることも重要です。 MQL5 市場で販売されている他のシステムや製品とは異なり、これは過度に最適化されておらず、リスクやドローダウンがほとんどなく、100% 勝ちのトレードを示すわけではありません。それは単純に存在しません。これらの製品の取り扱いには注意し、常識を持って使用してください。 このシステムはマーチンゲールを使用せず、オプションの 1 つとして、DD が一定のレベルに達したときにすべての操作を終了するシステムがあります。すべての取引は仮想 SL を使用します (ブローカーには送信されません)。 すべてのセットは EA に組み込まれているため、作成者が *.set ファイルを共有する必要はありません。 EA がストラテジー テスターや実際の取
PS Tsunami EA MT5
Miguel Angel Vico Alba
5 (10)
この EA の開発における主な焦点は、市場のほとんどのネットワーク システムに通常伴う大規模なクラッシュのリスクを排除することによるセキュリティでした。 その結果、他の同様のシステムよりもはるかに優れたパフォーマンスが得られます。 ライブモニタリング(信号) 私のシグナルは、スプレッドが通常高い標準口座 (ECN ではない) で高リスクに設定されています。 これが私のEAのテスト方法です。私があなたに推奨するのは、常にデフォルトのリスク設定です。 作者の他の商品 市場で販売されている他のシステムや製品とは異なり、これは過度に最適化されておらず、100% 勝ち、リスクなし、損失なしの運用を示すわけではありません。それは単純に存在しません。バックテストとそれらの製品の実際のシグナルを比較すれば、私が何を言っているのか理解していただけるでしょう。この EA の動作は 100% 本物です (私のシグナルを参照してください)。 このシステムはマーチンゲールを使用しません。マーチンゲールとは、グリッドの各ステップまたは損失の場合にロットを 2 倍にすることを意味しますが、これはこの EA の機能
PS GoldenEye EA MT5
Miguel Angel Vico Alba
5 (6)
この EA の開発における主な焦点は、市場のほとんどのグリッド システムに一般的に関連する大きなドローダウンのリスクを排除することによる安全性でした。最終結果は、類似のシステムよりもはるかに優れたパフォーマンスです。 信号およびその他の製品:       https://www.mql5.com/en/users/mike_explosion/seller シグナルに関する注意: 私のシグナルは、通常スプレッドが高いスタンダード口座 (ECN ではない) でのハイリスクテストです。これは、EA が長期的には収益性があることを示すための私なりの方法です。私があなたに推奨するのは、常にデフォルトのリスク設定です。 市場で販売されている他のシステムや製品とは異なり、これは過度に最適化されておらず、リスクがなくドローダウンがほとんどない 100% の勝利取引を示しません。それは単に存在しません。バックテストをこれらの製品のライブ シグナルと比較すると、私が話していることが理解できます。この EA の動作は 100% 本物です。利益はリスクと対称であるため、リスクのない利益はあり得ません。分かり
PS Wave Crossing MT4
Miguel Angel Vico Alba
5 (4)
効率係数とCCI + RSI + MAを考慮に入れると、結果は高い確率でのクロスになります。 上記の要因に基づいて、各交差点を「デルタ」と見なすことができます。 お好みに合わせてお気軽にどうぞ。これは「魔法の」指標ではなく、信号を確認するのに役立つもう1つのツールです。 パラメーター CCI期間 RSI期間 MA期間 係数(0から8) 描画スタイル カラーメインライン カラー信号線 線幅(1から5) メイン/信号を横切る矢印を表示 メイン/レベルを横切る矢印を表示 強気の矢印の色 弱気の矢印の色 矢印の幅(1〜5) [クロッシングライン]アラート 【クロッシングライン】メール [クロッシングライン] MQIDPush [メインラインがレベルを超えています]アラート 【本線がレベルを超える】メール [メインラインがレベルを超えています] MQIDPush この製品はMQL5.comでのみ販売されています。他のサイトでの販売は違法です。 私のすべての製品/シグナル:   https://www.mql5.com/en/users/mike_explosion/seller#prod
フィルタ:
jmhuang
3127
jmhuang 2020.12.12 00:39 
 

excellent volume indicator - responsive and non-lagging

Malcolm David Parker
470
Malcolm David Parker 2020.05.31 12:55 
 

very good indicator for spotting false or real breakouts. good communication from author

レビューに返信
バージョン 1.2 2020.07.10
- Default histogram
バージョン 1.1 2020.05.31
-Now the version number is shown on the chart.