StrongCurrency
- インディケータ
- Daying Cao
- バージョン: 1.3
- アップデート済み: 14 1月 2019
- アクティベーション: 5
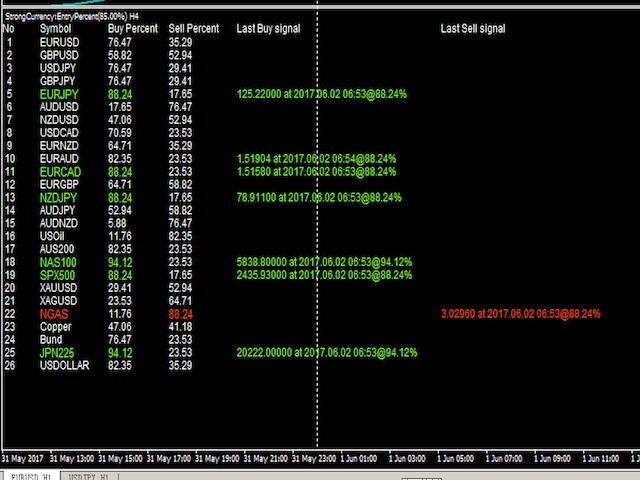
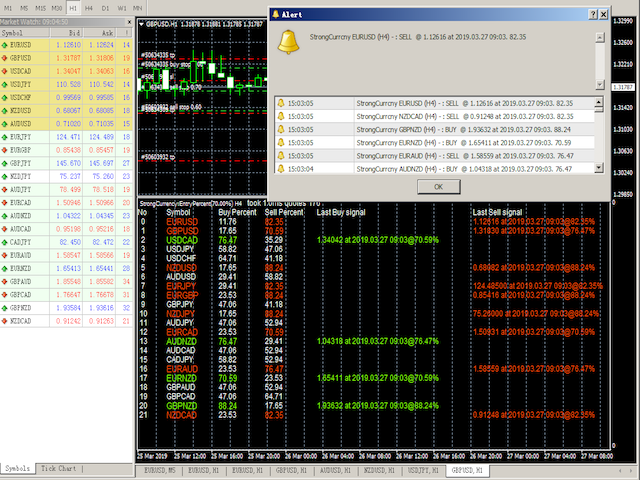
This StrongCurrency is a complete trading system based on a variety of technical indicators, moving averages and pivots. Each of those elements can be assessed in defined rules and coefficients (depending on the indicator) providing limitless optimization scenarios for the StrongCurrency. In order to work the StrongCurrency creates a trend strength and entry point signal list display by evaluating these data, that takes data from all symbols. It extrapolates all the information in order to get the trend strength or weakness to take a decision on market. List data includes Symbol, BuyPercent, SellPercent, LastBuySignal, LastSellSignal. The LastBuySignal and LastSellSignal show entry points (price, time, currency pair to trend percent). When the trend intensity is greater than 70%, it is considered to be a strong currency pair. This tool works on the Forex Market and processing data on indices, metals, etc.
This tool works in any timeframe. It is useful for multi-currency trader, and its simplified information could give excellent input signals. It helps you to quickly and clearly find the strong and weak currency pairs. Please see screenshot.
The limitation of MT4 multi-currency test is explained in the comments.
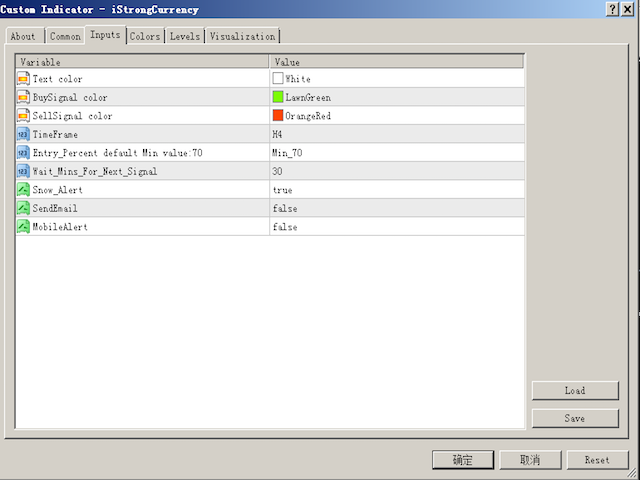
Inputs Value
- Text color = White - Normal text color.
- Buy Signal color = LawnGreen - Long signal color.
- Sell signal color = OrangeRed - Short signal color.
- TimeFrame = H4 - This period covers all currencies. It is recommended to use H4-MN.
- Entry_Percent = Min_70 - Trend percentage requirements 70% or more.
- Select trend = WeakTrend - Select trend level.
- Wait_Mins_For_Next_Signal = 30 - Wait for the next time of signal.
- ISALARM = false - Select true to display, select false not to display.

expensive and exclusive, super like