Price Action Strength Indicator
- インディケータ
- Robert Maidla
- バージョン: 3.2
- アップデート済み: 10 10月 2018
- アクティベーション: 5
Price Action Strength indicator uses the purest form of data available in the market (price action) to indicate the strength of the market move. Reading price action and measuring its strength is a subjective matter and it is a technique that takes years to master. The purpose of the indicator is to make the reading of the price action strength as objective as possible.
The indicator is far more advanced then default oscillators, because in addition to the price movement and its direction, the Price Action Strength indicator looks at the characteristics of the movement. This enables you to see the market through the eyes of an experienced price action trader.
The new version uses the same Price Action Strength values the 1.0 version did, but the 2.0 version determines the market sentiment for you. There are 2 possible sentiments:
- Predicting/reversal sentiment, which is calculated using the recent peaks/bottoms of the price compared to the Price Action Strength value;
- Continuation/momentum sentiment, which is calculated using the Price Action Strength momentum and value.
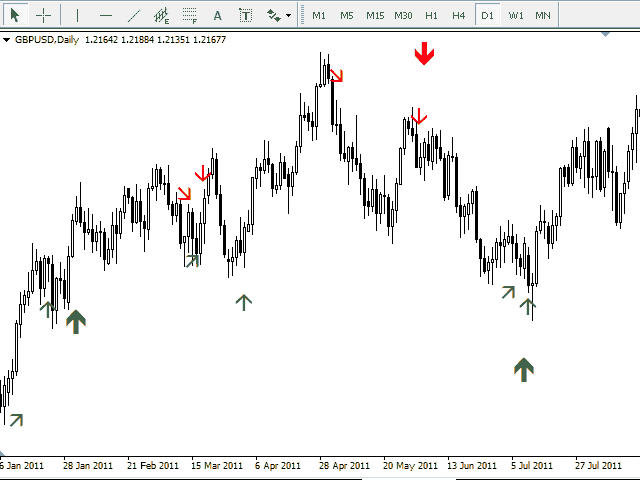
The new version uses these sentiment detections to produce arrows on the chart which show where the market is likely to move next using pure price action analysis.
There are 3 types of arrows/buffers with the new version (one for each direction) in addition to the 2 buffers that were included in the 1.0 version:
- Strength buffer will calculate the relative strength of the price action compared to the inputted 'Period' amount of past candles. The information is visualized using a line in the separate window. An upward movement of this line indicates a bullish price action strength while a downward movement of this line indicates a bearish price action strength. The higher this line is, the more bullish the price action strength is, the lower the line, the more bearish the price action strength;
- Overlap buffer will calculate the relative overlapping of the current bars compared to the inputted 'Period' amount of past candles. The information is visualized using a histogram. The higher the histogram, the stronger the price action strength considering the overlapping of the bars. In other words, the higher the histogram gets, the less overlapping exists between the bars, meaning the price has a concrete direction and it doesn't range, which indicates a strong move;
- Reversal buffer is indicated with a thin upwards/downwards arrow. The reversal arrow indicates that the reversal of the price is likely. Reversal signals are the ones that produce the most false signals, but if correct, they predict the biggest moves. It is recommended to use a risk/reward of at least 2 or bigger when taking these signals;
- Continuation buffer is indicated with a slanted arrow. The continuation arrow indicates that the market is gaining momentum in the corresponding direction. These signals often appear during an ongoing trend and are meant as a supportive indication that the market will more likely continue on the current course. Continuation signals provide more accurate predictions, but the market moves following are often not huge. It is recommended to use these signals for adding on to trend trades or scalps;
- Confirmation buffer is indicated with a thick upwards/downwards arrow. The confirmation arrow shows up when both the reversal and continuation signals appears during the same candle. This indicates a highly probable move.
NB! All The Arrows Appear At The Start Of The Candle They Locate On And Will Not Repaint!
The arrows shown by the indicator can be a stand-alone trading system, meaning you can take the trades as the arrows appear. You can also simply use the arrows to determine the market sentiment since price action analysis gives a pretty accurate prediction where the market is likely headed.
Price Action Strength 2.0 works on all the symbols and timeframes, but it is recommended to use it on bigger timeframes (H4 and up) since price action analysis principles work better the bigger the timeframe.
The inputs
- 'Period' - the amount of candles the indicator uses to compare the current data to.
- '0-line threshold' - the threshold for the 'Strength' buffer which is used to determine the confirming/momentum sentiment.
- 'Momentum sentiment candles span' - the candles span for detecting the confirming/momentum sentiment. If during these candles the 'Strength' buffer has made at least a certain % of positive/negative changes, the market is considered having a momentum in that direction.
- 'Momentum sentiment %' - the % of positive/negative changes in the 'Strength' buffer during the candles span set with the previous input required to confirm a momentum in that direction.
- 'Fractal size' - the fractal size in one direction. This is used to determine the predicting/reversal sentiment.
- 'ZigZag confirmation bars' - the amount of closes required for the ZigZag level to be respected to cope with the repainting. ZigZag indicator principles are used to determine the predicting/reversal sentiment.
- 'Depth' - the depth for the ZigZag indicator.
- 'Deviation' - the deviation for the ZigZag indicator.
- 'Backstep' - the backstep for the ZigZag indicator.
- 'Show once' - if true, the arrows need to alternate. For example after a bullish confirmation arrow appears, there has to be a bearish confirmation arrow present until a new bullish confirmation arrow can appear. If false, the indicator shows all the sentiment signals it can detect.
- 'Show predicting sentiment change' - if true, the predicting sentiment arrows appear on the chart.
- 'Show continuation sentiment change' - if true, the continuing sentiment arrows appear on the chart.
- 'Show confirming sentiment change' - if true, the confirming sentiment arrows appear on the chart.
- 'Alerts' - if true, the indicator sends an alert notification to the MT4 terminal when any of the arrows appear along with the symbol name the event happened on.
- 'Push notifications' - if true, the indicator sends a push notification when any of the arrows appear along with the symbol name the event happened on.
- 'Emails' - if true, the indicator sends an email when any of the arrows appear along with the symbol name the event happened on.


Your trading metrics are great!