• 概要
  • レビュー
  • コメント (11)
  • 最新情報

CCI FIBO

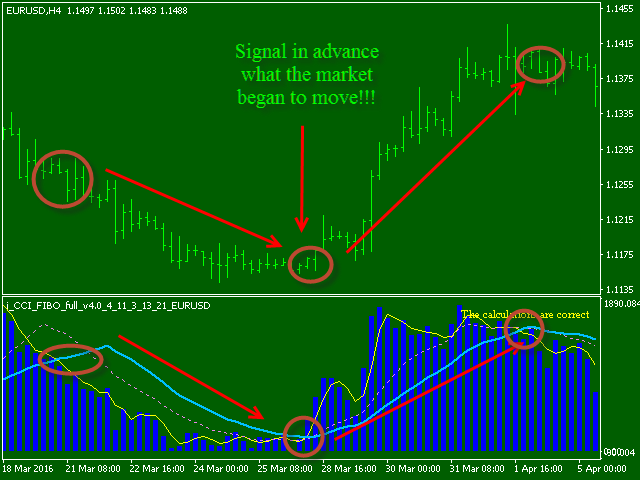
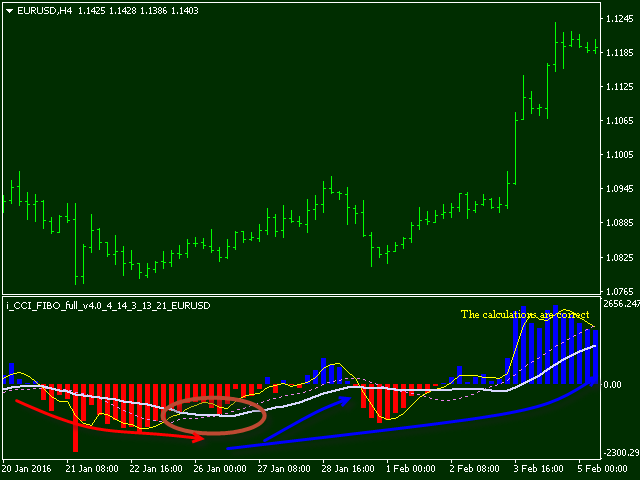
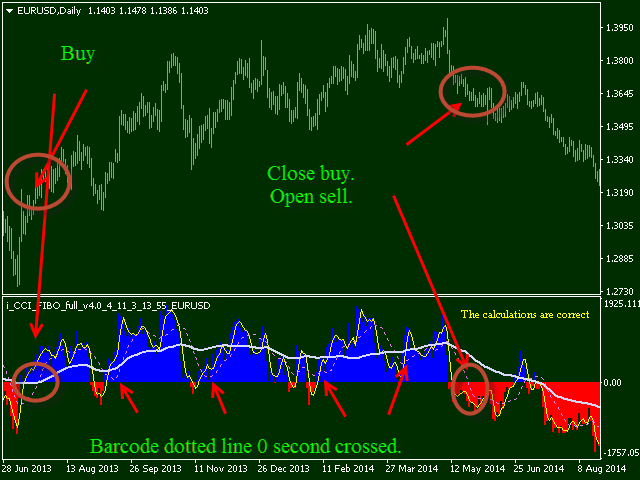
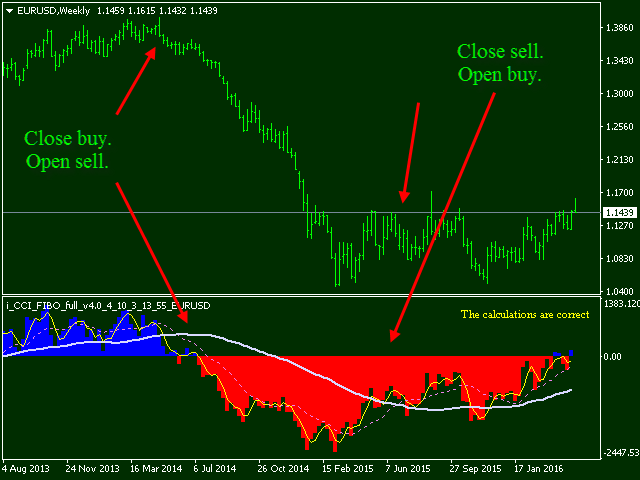
The CCI FIBO trend indicator displays the real sentiment of the market. Does not redraw.

The CCI FIBO indicator is based on the processed values of the standard CCI indicator. The indicator is able to display the slowing\reversal of the price during the trend movement (for exiting the position, and with some experience to display the opening in the opposite direction, for example, to use in scalping). It shows spikes in a flat. The idea of the indicator was that there are indicators that are good for showing the trend, but are bad during flats. And conversely, there are indicators, that are good for showing flats, but generate false signals during trends. This indicator was created specifically to be good at displaying the trend and to quickly readjust during flats.


Indicator parameters

  • The number of bars to display indicator - the number of bars to display. Implemented more for increasing the calculation speed.
  • Calculating the sensitivity (1 to 15) - Calculation sensitivity. 15 shows the exact market sentiment. below 10 - it is necessary to consult the values for the specific market behavior. It can be reduced, if there are insufficient bars for calculation.
  • Calculating the depth (1 to 4) - Calculation depth. 4 is the best. When lower (3, 2, 1) the accuracy of the calculation decreases.
  • Enable moving average 1 - Enable the first moving average
  • Enable moving average 2 - Enable the second moving average
  • Enable moving average 3 - Enable the third moving average
  • Period moving average 1 - The number of bars for smoothing the first moving average
  • Period moving average 2 - The number of bars for smoothing the second moving average
  • Period moving average 3 - The number of bars for smoothing the third moving average
  • Enable signal at the intersection of the middle-level number 1 - Enable the signal when the first moving average intersects a certain specified level
  • At what level signals - The level to generate the signal
  • What kind of music will play at signal - The audio file to play when the first moving average crosses the level


Trading features

It is possible to smooth the values with three moving averages. Three moving averages are displayed by default.

It shows good trading signals from М5 to D1. On М1 there is a lot of noise, but trading is also possible.

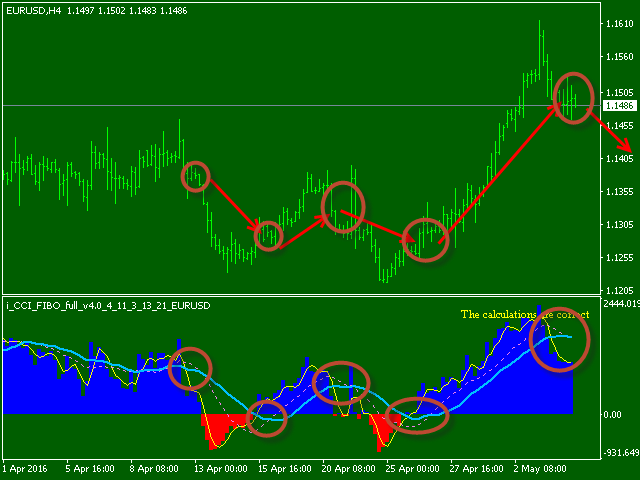
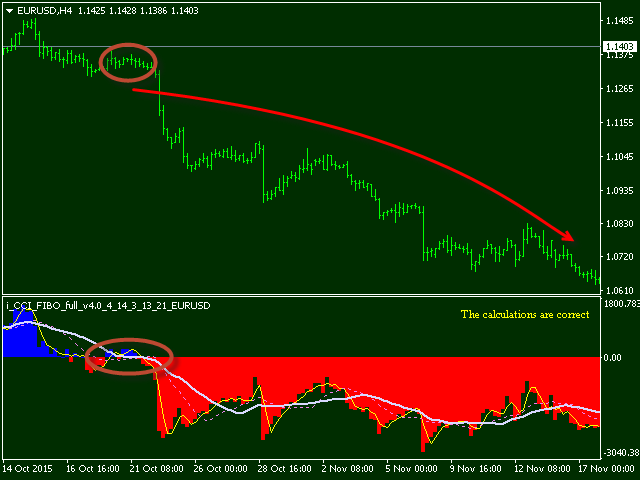
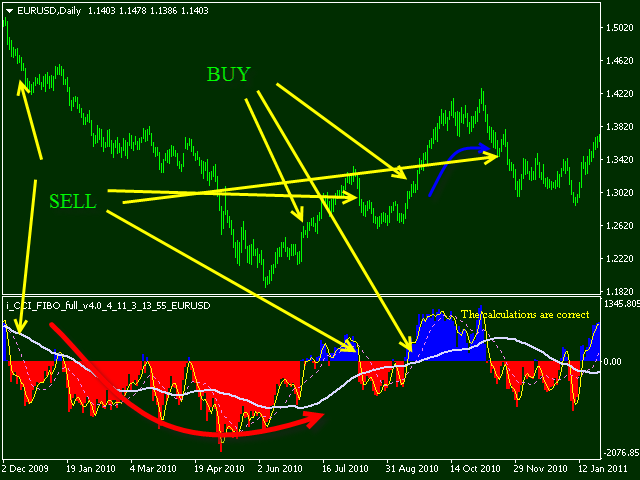
The blue color of the histogram shows that the market is in the buying phase. The red color of the histogram shows that the market is more inclined to sell. These readings are also clearly visible during flats. When the exit from the flat does not display anything but the boundaries for exiting it, the CCI FIBO indicator will stick to one direction. Rapid spikes sometimes happen in the market, but the indicator is not very susceptible to such things. This is why the averaged have been added. A moving average of 3 or 5 allows to smooth the spikes.

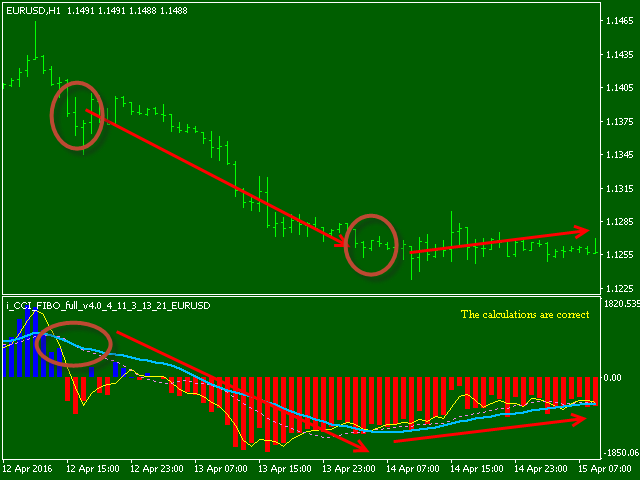
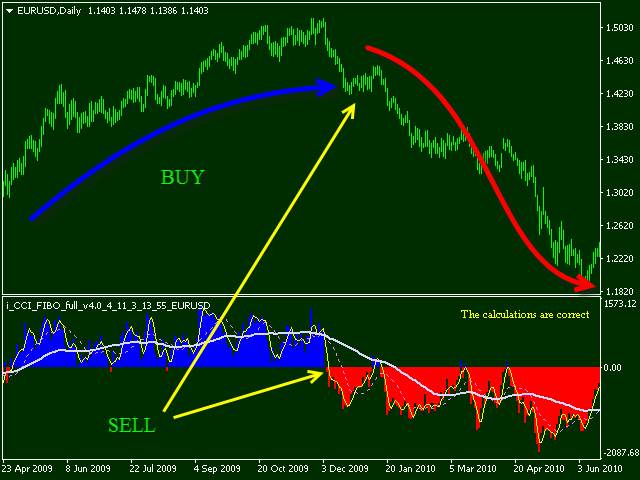
The indicator generates good signals when the moving average crosses the zero point of the indicator. The crossing of the zero point from below indicates that the market is inclined to buy. And vice-versa. From above is for selling.

The fast moving average crossing the slower (second and third moving averages) from below can also serve as a buy signal. Similarly, the fast moving average crossing the slow ones (two averages) from above for selling.

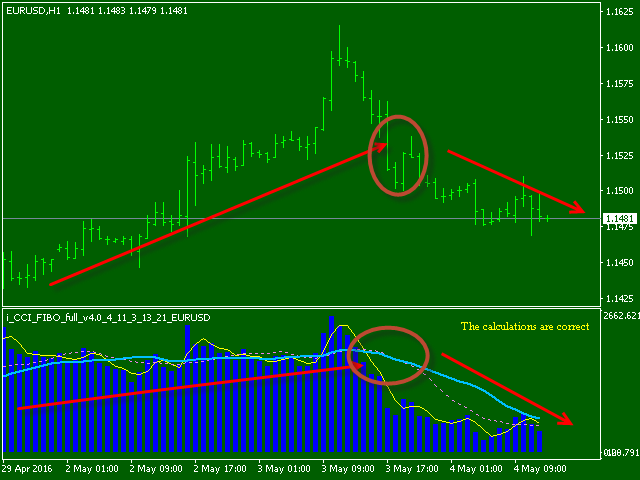
It is a good idea to monitor the slope of the slowest moving average. If it is above or below zero. If the slope of the slowest is pointed downwards and it is broken by two faster moving averages from above, then it is a good signal to sell. Similarly, for buying. The upward slope of the moving average, two faster one breaking it from below.

There is an EA based on the crossing of the moving averages, displayed are the results for H1 and H4.

おすすめのプロダクト
This is a trend indicator without redrawing Developed instead of the binary options strategy (by the color of the Martingale candlestick) Also works well in forex trading When to open trades (binary options) A signal will appear in the place with a candle signaling the current candle It is recommended to open a deal for one candle of the current timeframe M1 and M5 When a blue dot appears, open a deal up When a red dot appears, open a trade down. How to open trades on Forex. When a signal is rec
Owl smart levels
Sergey Ermolov
4.63 (54)
MT5版  |   FAQ Owl Smart Levels Indicator   は、 Bill Williams   の高度なフラクタル、市場の正しい波構造を構築する Valable ZigZag、エントリの正確なレベルをマークする Fibonacci レベルなどの一般的な市場分析ツールを含む 1 つのインジケーター内の完全な取引システムです。 利益を得るために市場と場所に。 戦略の詳細な説明 インジケータを操作するための指示 顧問-取引助手 プライベートユーザーチャット ->購入後に私に書いて、私はプライベートチャットにあなたを追加し、あなたはそこにすべてのボーナスをダウンロードすることができます 力はシンプルさにあります! Owl Smart Levels   取引システムは非常に使いやすいので、専門家にも、市場を勉強し始めて自分で取引戦略を選択し始めたばかりの人にも適しています。 戦略と指標に秘密の数式や計算方法が隠されているわけではなく、すべての戦略指標は公開されています。 Owl Smart Levels を使用すると、取引を開始するためのシグナルをすばやく確認し、
VR Cub
Vladimir Pastushak
VR Cub は、質の高いエントリーポイントを獲得するためのインジケーターです。このインジケーターは、数学的計算を容易にし、ポジションへのエントリーポイントの検索を簡素化するために開発されました。このインジケーターが作成されたトレーディング戦略は、長年にわたってその有効性が証明されてきました。取引戦略のシンプルさはその大きな利点であり、初心者のトレーダーでもうまく取引することができます。 VR Cub はポジション開始ポイントとテイクプロフィットとストップロスのターゲットレベルを計算し、効率と使いやすさを大幅に向上させます。取引の簡単なルールを理解するには、以下の戦略を使用した取引のスクリーンショットを見てください。 設定、設定ファイル、デモ版、説明書、問題解決方法は、以下から入手できます。 [ブログ] レビューを読んだり書いたりすることができます。 [リンク] のバージョン [MetaTrader 5] エントリーポイントの計算ルール ポジションをオープンする エントリーポイントを計算するには、VR Cub ツールを最後の高値から最後の安値までストレッチする必要があります。
Wave WOLD MT4外国為替インジケータは、Wolf waveを検索し、取引端末の現在のウィンドウに表示するように設計されています。 取引でオオカミの波を使用するトレーダーのための優れた指標。 取引戦略への適用は、効率と収益性を大幅に向上させます。 指標に関する情報 他のWolf wave指標とは異なり、Wave WOLD MT4外国為替指標は、その有効性を大幅に高める多くの機能を備えています: 最初のものは開いているWindows5Pointパラメータ(真の値)情報サポートを提供します。つまり、Wolf waveが登場したチャートのウィンドウを展開します。 たとえば、EURUSD、AUDUSD、GBPUSDチャートが開いていて、それぞれにWave WOLD MT4インジケーターがインストールされている場合、ユーロモデルが検出されると、対応するチャートが自動的に他のチャートの上に前景に表示され、多数の商品を取引するときに非常に便利になります。  2番目の機能は、ユーザーが自分で選択できるパラメータ(デフォルト設定(12,26,9))であるmacd上の組み込みの発散分析で
PABT Pattern Indicator - it's classical system one of the signal patterns. Indicator logic - the Hi & Lo of the bar is fully within the range of the preceding bar, look to trade them as pullback in trend. In the way if indicator found PABT pattern it's drawing two lines and arrow what showing trend way.  - First line - it's entry point and drawing at: 1. On the high of signal bar or on middle of the signal bar (depending from indicator mode) for buy; 2. On the low of signal bar or on middle of t
The Th3Eng PipFinite indicator is based on a very excellent analysis of the right trend direction with perfect custom algorithms. It show the true direction and the best point to start trading. With StopLoss point and Three Take Profit points. Also it show the right pivot of the price and small points to order to replace the dynamic support and resistance channel, Which surrounds the price. And Finally it draws a very helpful Box on the left side on the chart includes (take profits and Stop loss
Trend indicator with calculation of dynamic levels and signaling their intersection. Description of input parameters: StepTF = true; - Calculation of the indicator by closing the bar (true) or by each tick (false) BarsCount = 300; - Number of settlement bars Price = PRICE_CLOSE; - Type of price used TimeFrame = PERIOD_CURRENT; - Estimated timeframe TrendPeriod = 9; - Trend calculation period TrendDeviations = 4.9; - coefficient of deviation PeriodTrendSmooth = 1; - Trend smoothi
Trade with Gann on your side!! MASTER CIRCLE 360 CIRCLE CHART, originally created by Gann admitted that this is “The Mother of all charts”. It is one of the last studies that this great trader left for us. The numeric tab le is apparently quite simple like all the tables and is based on square numbers, the SQUARE OF 12 and is by evolution, one of the most important square numbers. Here we can find CYCLE, PRICE AND TIME thanks to angles and grades, to show past and future support and resistance.
"The trend is your friend" is one of the best known sayings in investing, because capturing large trendy price movements can be extremely profitable. However, trading with the trend is often easier said than done, because many indicators are based on price reversals not trends. These aren't very effective at identifying trendy periods, or predicting whether trends will continue. We developed the Trendiness Index to help address this problem by indicating the strength and direction of price trend
What are Heiken Ashi Candles? Heiken Ashi, derived from the Japanese term 'Heikin Ashi,' translates to average price bars. It's an indicator depicting price bars on a chart. Formula for Heiken Ashi candles: - Heiken Ashi opening price: (previous candle's opening + closing price) / 2 - Closing price Heiken Ashi: (opening + high + low + closing) / 4 - Heiken Ashi peak: Max of high, opening, or closing price - Heiken Ashi bottom price: Min of low, opening, or closing price How to Read Heik
The indicator displays the data of the Stochastic oscillator from a higher timeframe on the chart. The main and signal lines are displayed in a separate window. The stepped response is not smoothed. The indicator is useful for practicing "manual" forex trading strategies, which use the data from several screens with different timeframes of a single symbol. The indicator uses the settings that are identical to the standard ones, and a drop-down list for selecting the timeframe. Indicator Parame
Trend Monitor
Pavel Zamoshnikov
4.2 (5)
The indicator generates early signals basing on ADX reading data combined with elements of price patterns. Works on all symbols and timeframes. The indicator does not redraw its signals. You see the same things on history and in real time. For better visual perception signals are displayed as arrows (in order not to overload the chart). Features Easy to use. Filter configuration only requires selection of sensitivity in the " Sensitivity of the indicator " input. Signals can be filtered usin
The LineMagnit Indicator for MT4 is a highly precise tool that builds support and resistance levels which magnetically attract prices. This feature allows traders to easily determine the most probable entry and exit points in the market, as well as identify the market's directional forces, as levels are based on capital inflows into the instrument. Equipped with an intuitively understandable graphical interface, the LineMagnit Indicator enables users to quickly locate and analyze support and res
Insider Scalper Binary This tool is designed to trade binary options. for short temporary spends. to make a deal is worth the moment of receiving the signal and only 1 candle if it is m1 then only for a minute and so in accordance with the timeframe. for better results, you need to select well-volatile charts.... recommended currency pairs eur | usd, usd | jpy .... the indicator is already configured, you just have to add it to the chart and trade .... The indicator signals the next can
The Stepping Trend Indicator     The Steppi ng Trend indicator uses the  average true range  (ATR indicator) in its calculation. This gives you control to set your own average true range period, I set the Default as 10.   Indicator Details. Green Arrow Up: This means you are at the starting point of a new bullish trend, it’s time to buy.   Red  Arrow  Down : This means you are at the starting point of a new  bearish  trend, it’ s time to sell .   What if you miss the Arrow Signal?   No
Noize Absorption Index - is the manual trading system that measures the difference of pressure between bears forces and bulls forces. Green line - is a noize free index that showing curent situation. Zero value of index shows totally choppy/flat market.Values above zero level shows how powerfull bullish wave is and values below zero measures bearish forces.Up arrow appears on bearish market when it's ready to reverse, dn arrow appears on weak bullish market, as a result of reverse expectation. S
An indicator of pattern #31 ("Long Island") from Encyclopedia of Chart Patterns by Thomas N. Bulkowski. The second gap is in the opposite direction. Parameters: Alerts - show alert when an arrow appears   Push - send a push notification when an arrow appears (requires configuration in the terminal) GapSize - minimum gap size in points ArrowType - a symbol from 1 to 17 ArrowVShift - vertical shift of arrows in points   ShowLevels - show levels ColUp - color of an upward line ColDn - color of
Heiken Ashi Smoothed Strategy is a very simple but powerful system to get forex market trend direction. This indicator is actually 2 indicators in 1 pack, Heiken Ashi and Heiken Ashi Smoothed Moving Average both included. Because HA (Heiken Ashi) and HAS (Heiken Ashi Smoothed) are calculated in the same one system event with necessary buffers and loop only, so it is the FAST, OPTIMIZED and EFFICIENT HA having the combined indicator of MetaTrader 4. You can choose to display HA and HAS in the sam
Reversal First Impulse levels (RFI)    INSTRUCTIONS        RUS       -       ENG              R ecommended to use with an indicator   -   TREND PRO -  Version MT5 A key element in trading is zones or levels from which decisions to buy or sell a trading instrument are made. Despite attempts by major players to conceal their presence in the market, they inevitably leave traces. Our task was to learn how to identify these traces and interpret them correctly. Main functions: Displaying active zones
The trend is your friend! This is what this indicator is all about. Follow this famous saying and be safe. Characteristics: Buy/Sell signals fixed on the close of a bar. Works on all symbols and all timeframes. Clear visual market trend laser line, Buy/Sell signal arrows, market strength meter, TP1 & TP2 boxes. Visual signals when to enter, when to exit the market. No repainting. Compatible with Flexible EA for trading automation. (Ask for a free set file optimized to perform 2010-2018) Para
Introduction It is common practice for professional trades to hide their stop loss / take profit from their brokers. Either from keeping their strategy to the themselves or from the fear that their broker works against them. Using this indicator, the stop loss / take profit points will be drawn on the product chart using the bid price. So, you can see exactly when the price is hit and close it manually.  Usage Once attached to the chart, the indicator scans the open orders to attach lines fo
This indicator is another variant of the famous powerful indicator Fibonacci-SS https://www.mql5.com/en/market/product/10136 but has different behaviour in placing Pending Order and TP Line. Automatically places Fibonacci retracement lines from the last highest and lowest visible bars on the chart with: An auto Pending Order (Buy/Sell). Taking Profit 1, Taking Profit 2 is pivot point and Taking Profit 3 for extended reward opportunity. The best risk and reward ratio. Simple and powerful indica
[ZhiBiCCI]インディケータは全てのサイクル使用に適しており、そして全ての市場品種にも適しています。 [ZhiBiCCI]緑色の実線は強気の発散の逆転です。緑色の点線は古典的な強気の発散です。 [ZhiBiCCI]赤への実線は逆弱気の発散である。赤い点線は古典的な弱気の発散です。 [ZhiBiCCI]はパラメータ(アラート、メール送信、通知送信)で設定でき、(true)に設定するとインスタント信号をアラームウィンドウに送信し、Eメール、インスタントメッセージを送信できます。 パラメータ設定の説明 [displayAlert]:これはアラームスイッチで、trueに設定され、矢印が表示されればプロンプトに自動的に警告され、falseに設定されれば警告されません。 [sendmail_NO_OFF]:これはメールを送信するためのスイッチで、trueに設定します。矢印が表示されていればMT4で設定したメールボックスにメールを送信し、falseに設定されていればメールを送信しません。 [sendnotification_NO_OFF]:これはインスタントメッセー
Taurus All4 Taurus All4 is a high-performance indicator, it will tell you the strength of the trend, and you will be able to observe the strength of the candle. Our indicator has more than 4 trend confirmations. It is very simple and easy to use. Confirmation Modes Candle Trend Confirmations: When the candle switches to light green the trend is high. When the candle switches to light red the trend is reverting down. When the candle changes to dark red the trend is low. Trendline Trend Conf
Signal trend indicator. Detects the direction of the trend and is coloured accordingly.  Has built in audible and visual alerts when trends change. Can send notifications to your phone or email. Allows Trend and Counter-Trend trading. Works on all timeframes, all currency pairs, metals, indices and cryptocurrencies. Can be used with binary options. Distinctive features No re-drawing; Simple and clear settings; Four types of alerts; Works on all timeframes and all trading tools; Su
Alpha Trend
Evgeny Belyaev
3.33 (3)
Alpha Trend is a trend indicator for the MetaTrader 4 platform; it has been developed by a group of professional traders. The Alpha Trend indicator finds the most probable tendency reversal points, which allows making trades at the very beginning of a trend. This indicator features notifications, which are generated whenever a new signal appears (alert, email, push-notification). This allows you to open a position in a timely manner. Alpha Trend does not redraw, which makes it possible to evalua
Are you tired of the uncertainty that arises when your orders fail to stop at a specific line due to the spread? Look no further! Introducing our  indicator that plots candlesticks based on the Ask price instead of the traditional bid-based chart commonly used in MQL4. With this indicator, you can say goodbye to the frustrations caused by the bid-based chart, as it provides you with a more accurate representation of market movements. By utilizing the Ask price, which represents the price at whic
The Funicular is a functional indicator knowing all the rules of the market and performing constructions more accurate and faster than any professional analyst.  The Funicular helps you see the exact points of the "entrance", and it draws trends with great accuracy determinig their strength and fluctuation time. The main difference from the others is that it builds lines that are independent of timeframe allowing you to perceive the chart as a whole. Simply put, you need The Funicular, because i
Improved version of the free HMA Trend indicator (for MetaTrader 4) with statistical analysis. HMA Trend is a trend indicator based on the Hull Moving Average (HMA) with two periods. HMA with a slow period identifies the trend, while HMA with a fast period determines the short-term movements and signals in the trend direction. The main differences from the free version: Ability to predict the probability of a trend reversal using analysis of history data. Plotting statistical charts for analyz
このプロダクトを購入した人は以下も購入しています
現在26%オフ 初心者やエキスパートトレーダーに最適なソリューション! このインジケーターは、独自の機能と新しい計算式を取り入れた、ユニークで高品質、かつ手頃な価格のトレーディングツールです。たった1枚のチャートで28の為替ペアの通貨強度を読み取ることができます。新しいトレンドやスキャルピングチャンスの引き金となるポイントを正確に特定することができるので、あなたのトレードがどのように改善されるか想像してみてください。 ユーザーマニュアルはこちら  https://www.mql5.com/en/blogs/post/697384 これが最初の1本、オリジナルだ! 価値のないクローンを買わないでください。 特別な サブウィンドウの矢印で強い通貨の勢いを表示 GAPがあなたのトレードを導く! 基準通貨や気配値が売られすぎ・買われすぎのゾーン(外相フィボナッチレベル)にあるとき、個別チャートのメインウィンドウに警告表示。 通貨がレンジの外側から反落した場合、プルバック/リバーサルのアラート。 クロスパターンの特別なアラート 複数の時間枠を選択可能で、トレンドを素早く
まず第一に、この取引インジケーターは再描画されず、再描画されず、遅延しないことを強調する価値があります。これにより、手動取引とロボット取引の両方に理想的なものになります。 ユーザーマニュアル:設定、入力、戦略。 アトミックアナリストは、価格の強さとモメンタムを利用して市場でより良いエッジを見つけるためのPA価格アクションインジケーターです。ノイズや誤ったシグナルを除去し、取引ポテンシャルを高めるための高度なフィルターを備えています。複雑なインジケーターの複数のレイヤーを使用して、アトミックアナリストはチャートをスキャンし、複雑な数学的計算をシンプルなシグナルと色に変換します。これにより、どのような初心者トレーダーでも理解して使用し、一貫した取引の決定を行うことができます。 「アトミックアナリスト」は、新規および経験豊富なトレーダー向けにカスタマイズされた包括的な取引ソリューションです。プレミアムインジケーターとトップノッチの機能を1つの取引戦略に組み合わせ、すべてのタイプのトレーダーにとって汎用性のある選択肢にします。 デイリートレーディングとスキャルピング戦略:高
An exclusive indicator that utilizes an innovative algorithm to swiftly and accurately determine the market trend. The indicator automatically calculates opening, closing, and profit levels, providing detailed trading statistics. With these features, you can choose the most appropriate trading instrument for the current market conditions. Additionally, you can easily integrate your own arrow indicators into Scalper Inside Pro to quickly evaluate their statistics and profitability. Scalper Inside
TrendMaestro
Stefano Frisetti
5 (2)
note: this indicator is for METATRADER4, if you want the version for METATRADER5 this is the link:  https://www.mql5.com/it/market/product/108106 TRENDMAESTRO ver 2.4 TRENDMAESTRO recognizes a new TREND in the bud, he never makes mistakes. The certainty of identifying a new TREND is priceless. DESCRIPTION TRENDMAESTRO identifies a new TREND in the bud, this indicator examines the volatility, volumes and momentum to identify the moment in which there is an explosion of one or more of these data a
Advanced Supply Demand
Bernhard Schweigert
4.92 (311)
現在33%オフ 初心者にもエキスパートトレーダーにも最適なソリューション このインジケーターは独自の機能と新しい公式を多数内蔵しており、ユニークで高品質かつ手頃な取引ツールです。このアップデートでは、2つの時間枠ゾーンを表示できるようになります。より長いTFだけでなく、チャートTFとより長いTF(ネストゾーンを表示)の両方を表示できます。すべてのSupply Demandトレーダーの皆さんのお気に召すはずです。:) 重要情報の公開 Advanced Supply Demandの可能性を最大化するには、 https://www.mql5.com/ja/blogs/post/720245 にアクセスしてください。   エントリーまたはターゲットの正確なトリガーポイントを正確に特定できれば取引がどのように改善されるか想像してみてください。新しい基盤となるアルゴリズムに基づいて構築されているため、買い手と売り手の間の潜在的な不均衡をさらに簡単に特定できます。これは、最も強い需要と供給のゾーンと、過去のパフォーマンス(古いゾーンを表示)がグラフィカルに表現されるためです。これらの機能は、最適
TPSpro TRENDPRO  - is a trend indicator that automatically analyzes the market and provides information about the trend and each of its changes, as well as giving signals for entering trades without redrawing! The indicator uses each candle, analyzing them separately. referring to different impulses - up or down impulse. Exact entry points into transactions for currencies, crypto, metals, stocks, indices!  -  Version MT5               DETAILED DESCRIPTION                R ecommended to use with
現在20%OFF! 初心者やエキスパートトレーダーのためのベストソリューション! このダッシュボードソフトウェアは、28の通貨ペアで動作しています。それは私達の主要な指標(高度な通貨の強さ28と高度な通貨インパルス)の2に基づいています。それは全体の外国為替市場の大きい概観を与えます。それは、すべての(9)時間枠で28の外国為替ペアのための高度な通貨の強さの値、通貨の動きの速度と信号を示しています。チャート上で1つのインディケータを使用して市場全体を観察し、トレンドやスキャルピングの機会をピンポイントで見つけることができたら、あなたのトレードがどのように改善されるか想像してみてください。 このインディケータには、強い通貨と弱い通貨の識別、潜在的な取引の識別と確認がより簡単になるような機能が搭載されています。このインディケータは、通貨の強さや弱さが増加しているか減少しているか、また、すべての時間枠でどのように機能しているかをグラフィカルに表示します。 新機能として、現在の市場環境の変化に適応するダイナミックなマーケットフィボナッチレベルが追加され、すでに当社のAdvan
もちろんです。以下は、提供いただいたテキストの日本語への翻訳です: MT4用の天文学指標をご紹介します:究極の天体トレーディングコンパニオン トレーディング体験を天空の高みに高める準備はできていますか?私たちの革命的なMT4用の天文学指標をご紹介します。この革新的なツールは、複雑なアルゴリズムの力を借りて、類まれなる天文学的洞察と精密な計算を提供します。 あなたの指先で宇宙の情報を: 宝のような天文学的データが明らかになる包括的なパネルをご覧ください。惑星の地理的/太陽中心座標、太陽と地球の距離、星の大きさ、伸び、星座、黄道座標および赤道座標、さらには水平座標まで、それぞれが綿密に計算され美しく表示されています。指標によって生成される垂直線は時間値に対応し、トレーディングの旅に宇宙の視点を提供します。 惑星のラインと関係: グラフを飾る惑星のラインの魔法を体験し、スケールと角度をカスタマイズできます。直感的なコントロールパネルを介して各惑星のラインの表示を簡単に切り替えることができます。指定された時刻範囲内での合会、六分会、四分会、三分会、対会、逆行の指標で天体の関係の芸術を発見してく
FX Volume
Daniel Stein
4.6 (35)
mql5と Telegramの モーニング・ブリーフィングで、詳細とスクリーンショットを含む毎日のマーケット・アップデートをご覧 ください! FX Volumeは、ブローカーの視点から市場のセンチメントをリアルに洞察する、最初で唯一の出来高インジケーターです。 ブローカーのような機関投資家が外国為替市場でどのようなポジションをとっているか、COTレポートよりもはるかに速く、素晴らしい洞察を提供します。 この情報をチャート上で直接見ることは、あなたの取引にとって真のゲームチェンジャーであり、画期的なソリューションです。 以下のようなユニークなマーケットデータ洞察から利益を得てください。 比率は 、通貨のロングポジションとショートポジションの比率をパーセントで表示します。 比率の変化は 、選択した期間内のロング比率とその変化率を表示します。 Volumes Totalは 、通貨の取引量(ロングとショート)の合計をロット単位で表示します。 Volumes Long :全通貨のロングポジションの取引量を表示します。 Volumes(ショート )は、全通貨のショートポジションの取引量を表示
The indicator of a Professional Trader is an arrow indicator for predicting the direction of price movement. I have been working on this indicator since 2014. You can use this indicator as your main indicator, use its entry signals, and use it as your only indicator to find entry points. About the product: Recommended TF [H4-D1-W1]   . The indicator predicts the direction of the next candle. Fits a variety of tools; Flexibility in settings for different instruments and intervals through the
74% discount for the next 10 buyers (original price $605): 1 left Get a 50% bonus by buying (or even renting) any of our products. After buying (or renting), send a message for more information. 3 Indicators in 1 indicator Strategy based on price action Made specifically for the best forex currency pairs Can be used in the best time frame of the market at a very reasonable price This indicator is basically 3 different indicatos . But we have combined these 3 indicators in 1 indicator so th
ご紹介   クォンタム トレンド スナイパー インジケーターは 、トレンド反転を特定して取引する方法を変革する画期的な MQL5 インジケーターです。 13年以上の取引経験を持つ経験豊富なトレーダーのチームによって開発されました。     クォンタムトレンドスナイパーインジケーター   は、非常に高い精度でトレンドの反転を識別する革新的な方法で、あなたのトレーディングの旅を新たな高みに押し上げるように設計されています。 ***Quantum Trend Sniper Indicatorを購入すると、Quantum Breakout Indicatorを無料で入手できます!*** クォンタム ブレイクアウト インジケーターは、トレンドの反転を特定するとアラートを発し、矢印を示し、3 つのテイクプロフィットレベルを提案します。 初心者トレーダーにもプロのトレーダーにも適しています。 量子EAチャネル:       ここをクリック MT5のバージョン:       ここをクリック 推奨事項: 期間: すべての時間枠。最良の結果を得るには、
TakePropips Donchian Trend Pro
Eric John Pajarillaga Aldana
4.82 (17)
TakePropips Donchian Trend Pro   (MT4) は、ドンチャン チャネルを使用してトレンドの方向を自動的に検出し、エントリーとエグジットの取引シグナルを提供する強力で効果的なツールです! この多機能インジケーターには、トレンド スキャナー、取引シグナル、統計パネル、スクリーナー、取引セッション、およびアラート履歴ダッシュボードが含まれます。取引シグナルを提供し、チャートを分析する時間を節約するように設計されています! ユーザー マニュアルとインストール ガイドは、ブログ投稿 (   https://www.mql5.com/en/blogs/post/751368   ) からダウンロードできます。 今日は 50% オフ! 98ドルから49ドルに値下げ! このインジケーターは、ストラテジー テスターでテストできます (ビジュアル モードを有効にします)。 詳細については、説明の下にあるビデオ チュートリアルも利用できます。 ご不明な点やサポートが必要な場合は、私に連絡してください。 TakePropips Donchian Trend Pro イン
mql5と Telegramの モーニング・ブリーフィングで、詳細とスクリーンショットを含む毎日のマーケット・アップデートをご覧 ください! FX Power MT4 NGは 、長年の人気を誇る通貨強度計FX Powerの次世代モデルです。 この次世代ストレングスメーターは何を提供するのでしょうか?初代FXパワーの魅力すべて プラス GOLD/XAUの強さ分析 より正確な計算結果 個別に設定可能な分析期間 カスタマイズ可能な計算上限値により、さらに優れたパフォーマンスを実現 もっと見たい人のための特別なマルチインスタンス設定 すべてのチャートでお好みの色を無限に設定可能 数え切れないほどの通知オプションにより、重要なことを見逃すことはありません。 Windows 11とmacOSのスタイルで角を丸くした新しいデザイン 魔法のように動くインジケーターパネル FXパワーの主な機能 すべての主要通貨の強さの完全な履歴 すべての時間枠における通貨の強さの履歴 すべてのブローカーとチャートで同一の計算結果 100%信頼できるリアルタイム計算 -> リペイントなし ドロップダウン・リストから
ご紹介     Quantum Breakout PRO は 、ブレイクアウト ゾーンの取引方法を変革する画期的な MQL5 インジケーターです。 13年以上の取引経験を持つ経験豊富なトレーダーのチームによって開発された Quantum Breakout PROは 、革新的でダイナミックなブレイクアウトゾーン戦略により、あなたの取引の旅を新たな高みに押し上げるように設計されています。 クォンタム ブレイクアウト インジケーターは、5 つの利益ターゲット ゾーンを備えたブレイクアウト ゾーン上のシグナル矢印と、ブレイクアウト ボックスに基づいたストップロスの提案を提供します。 初心者トレーダーにもプロのトレーダーにも適しています。 量子EAチャネル:       ここをクリック MT5バージョン:   ここをクリック 重要!購入後、インストールマニュアルを受け取るためにプライベートメッセージを送ってください。 推奨事項: 時間枠: M15 通貨ペア: GBPJPY、EURJPY、USDJPY、NZDUSD、XAUUSD アカウントの種類: ECN、Raw、また
Wolfe Waves scanner - It scans all the Symbols and identify the movement of price and it gives confidence in trade. It automatically plots  fifth wave breaks out of the channel. According to the theory behind the pattern, a line drawn from the point at the beginning of the first wave and passing through the beginning of the fourth wave predicts a target price for the end of the fifth wave. If a trader properly identifies a Wolfe Wave as it forms, the beginning of the fifth wave represents an op
The NASDAQ 100 Power Indicator serves with TREND and trend reversals indication using automated arrows that indicates buy or sell at that price and has built-in signal provider across all time frames with alerts and provides also the automated support and resistance that can draw technical analysis patterns like double bottom, double top, head and shoulders etc. using closing and open prices, in assistance for if a trader did not see the pattern sooner for their technical analysis. The indicator
Step into the realm of Forex trading with confidence and precision using XQ, a cutting-edge Forex indicator designed to elevate your trading game to unprecedented heights. Whether you're a seasoned trader or just stepping into the world of currency exchange,   XQ Forex Indicator   empowers you with the insights and signals needed to make informed trading decisions. The signal conditions are a combination of three indicators, and XQ Forex Indicator only display  medium and long-term trends . The
Cycle Sniper
Elmira Memish
4.39 (36)
NEW YEAR SALE PRICE FOR LIMITED TIME!!! Please contact us after your purchase and we will send you the complimentary indicators to complete the system Cycle Sniper is not a holy grail but when you use it in a system which is explained in the videos, you will feel the difference. If you are not willing to focus on the charts designed with Cycle Sniper and other free tools we provide, we recommend not buying this indicator. We recommend watching the videos about the indiactor and system before pu
このインディケータは、異なる期間のフラクタルの価格構造を調べて、市場で起こり得る反転ポイントを決定し、すでに基本的または技術的な評価モデルを持っているポジショントレーダーにタイミングを提供します。弟の リバーサルフラクタル とは異なり、このインジケーターは選択された期間のためにリバーサルを逃すことはなく、ジグザグ形式でリバーサルフラクタルを見つけます。 [ インストールガイド | 更新ガイド | トラブルシューティング | よくある質問 | すべての製品 ] ターニングポイントは長いトレンドを開始できます インジケーターは再描画されていません あらゆる種類のアラートを実装します カスタマイズ可能な色とサイズ フラクタルは奇数番目のバーのフォーメーションであり、フォーメーションの最上位または最下位の中間バーであり、フラクタル内のすべてのバーが閉じるとインディケーターが描画されるため、このインジケーターはリアクティブまたは遅れ信号です。ただし、既存の方向バイアスを持つトレーダーは、この指標が非常に有用であり、早期のエントリポイントを取得します。 このインディケーターは、ボイルダウンされ
Introduction to Fractal Pattern Scanner Fractal Indicator refers to the technical indicator that makes use of the fractal geometry found in the financial market. Fractal Pattern Scanner is the advanced Fractal Indicator that brings the latest trading technology after the extensive research and development work in the fractal geometry in the financial market. The most important feature in Fractal Pattern Scanner is the ability to measure the turning point probability as well as the trend probabi
Indicator captures the trend reversals with no-repaint Buy and Sell Arrow signals. CyberZingFx Trend Reversal Indicator - your go-to solution for accurate and reliable trend reversal signals. With its  advanced trading strategy , the indicator offers you Buy and Sell Arrow signals that do not repaint, making it a reliable tool for catching Swing Highs and Swing Lows in any market and any time frame. Indicator works on  any market  and  any time frames . __________________________________________
ON Trade Waves Patterns Harmonic Elliot Wolfeをご紹介します。これは手動および自動の方法を使用して市場のさまざまなパターンを検出するために設計された高度なインジケーターです。以下はその動作方法です: ハーモニックパターン: このインジケーターは、チャートに表示されるハーモニックパターンを識別できます。これらのパターンは、Scott Carneyの「Harmonic Trading vol 1および2」で説明されているように、ハーモニックトレーディング理論を実践するトレーダーにとって重要です。手動で描画するか、自動検出に頼るかにかかわらず、ON Trade Waves Patternsがお手伝いします。 コントロールパネル: このインジケーターはユーザーフレンドリーなコントロールパネルを備えています。チャートと時間枠の設定を保存し、異なる構成間をスムーズに切り替えることができます。チャートスペースを最大限に活用するために最小化することもできます。他の分析ツールで作業することを好む場合、閉じるボタンをクリックするだけで、すべてのインジケーターデ
このインジケータは、手動および自動的な方法でチャートに描かれたハーモニックパターンを検出します。ユーザーマニュアルは、このリンクから参照できます: あなたのレビューを追加し、入手するために私たちに連絡してください。 この製品をmt4で試すための無料版があります。 GartleyおよびNenstarパターンを検出するために使用できます。 https://www.mql5.com/en/market/product/30181 完全なMT4バージョンを購入するには、次の場所から購入できます。 https://www.mql5.com/en/market/product/15212 注 インジケータにはコントロールパネルがあり、すべての(チャート&時間枠)設定が保存されます。チャート上でスペースをより多く確保するために、最小化することができ、他の分析ツールで作業する場合は、すべてのインジケータデータを非表示にするために閉じるボタンを押すことができます。 このインジケータを使用して設定を変更し、移動平均やボリンジャーバンドなどのインジケータを追加すると、編集のテンプレートが自動的に保存され、必
The All-in-One Trade Indicator (AOTI) determines daily targets for EURUSD, EURJPY, GBPUSD, USDCHF, EURGBP, EURCAD, EURAUD, AUDJPY, GBPAUD, GBPCAD, GBPCHF, GBPJPY, AUDUSD, and USDJPY. All other modules work with any trading instruments. The indicator includes various features, such as Double Channel trend direction, Price channel, MA Bands, Fibo levels, Climax Bar detection, and others. The AOTI indicator is based on several trading strategies, and created to simplify market analysis. All-in-One
WARNING!! THIS SWORD IS TOO SHARP!    ONLY 10 COPIES LEFT FOR THE NEXT PRICE TO BE 8,000$ FOR UNLIMITED PLAN. Dear traders I am very glad once again to introduce to you my other tool called "Forex Sword Indicator". In short this tool is meant to give you an edge over the market that you have been waiting for  so long. Now, here it is. It is a very very simple tool but yet a dangerous sword. I call it a  Holy grail indicator!. I will not talk a lot about this tool. Just let the tool speak by itse
このインディケータは、当社の2つの製品 Advanced Currency IMPULSE with ALERT  +   Currency Strength Exotics . のスーパーコンビネーションです。 このインジケーターは全ての時間枠で作動し、8つの主要通貨と1つのシンボルの強弱のインパルスをグラフで表示します。 このインジケータは、金、エキゾチックペア、商品、インデックス、先物など、あらゆるシンボルの通貨強度の加速度を表示することに特化されています。金、銀、原油、DAX、US30、MXN、TRY、CNHなどの通貨強度の加速度(インパルスまたは速度)を表示するために、任意のシンボルを9行目に追加できる、この種の最初のものです。 新しいアルゴリズムに基づいて構築され、潜在的な取引の特定と確認がさらに容易になりました。これは、通貨の強さや弱さが加速しているかどうかをグラフィカルに表示し、その加速の速度を測定するためです。加速すると物事は明らかに速く進みますが、これはFX市場でも同じです。つまり、反対方向に加速している通貨をペアリングすれば、潜在的に利益を生む取
The  RSI Basket Currency Strenght  brings the RSI indicator to a new level.  Expanding the boundaries of TimeFrames and mono-currency analysis, the RSI Multi Time Frame Currency Strenght take the movements of each currency that composes the cross and confront them in the whole basket of 7 crosses.  The indicator works with any combination of  AUD, CAD, CHF, EUR, GBP, JPY, NZD, USD  pairs and with full automation takes in account every RSI value for the selected Time Frame.  After that, the ind
フルSTOインジケータ(3つのSTOインジケータのすべてのバージョンを含む:プレミアム、ゴールド、シルバー) - STABLE TRADE OPTIONは、自動バイナリーオプション取引のために設計されています。 注意深くお読みください! 重要 1つのターミナルで、異なる有効期限を持つ2つのテンプレートを作成します。18:01、18:02のテンプレートは有効期限が1~15分、22:00のテンプレートは有効期限が10~20分です。 勝率:過去5年間で71 資金管理: 預金から0.3 このバージョンのインジケータは、モスクワ時間18:01、18:02、22:00の取引にのみ設定され、有効期限は銀と金が1~15分、プレミアムバージョンは10~20分です。シグナルはローソク足の内側に表示され、すぐに取引を開始します。 インジケータは完全に設定されているので、自分で何かを変更する必要はありません。インストールして取引してください! 実際の口座でstoの全バージョンをチェックし、結果を確認するのに2年以上かかりました。長年のテストの結果、最適なパラメータが選択さ
スイングトレーディング は、トレンドの方向のスイングと可能な反転スイングを検出するように設計された最初のインジケーターです。トレーディングの文献で広く説明されているベースラインスイングトレーディングアプローチを使用します。インディケータは、いくつかの価格と時間のベクトルを調査して、全体的なトレンドの方向を追跡し、市場が売られ過ぎまたは買われ過ぎて修正の準備ができている状況を検出します。 [ インストールガイド | 更新ガイド | トラブルシューティング | よくある質問 | すべての製品 ] むち打ちを起こさずに市場スイングの利益 インジケーターは常にトレンドの方向を表示します 色付きの価格帯は機会のベースラインを表します 色付きのダッシュは、可能な反転スイングを表します この指標は、独自の品質とパフォーマンスを分析します 複数時間枠のダッシュボードを実装します カスタマイズ可能なトレンドおよびスイング期間 電子メール/サウンド/プッシュアラートを実装します インジケータは再描画またはバックペインティングではありません Swing Tradingとは Swing Tradi
作者のその他のプロダクト
Indicator for collecting and storing ticks from the real market. Ticks are available in offline mode. The tick chart works like the standard time charts in MetaTrader 4. All indicators work on the tick chart. It is good for finding "pins" and spikes before the news releases. The indicator is good for scalpers and scalper systems. Templates also work. Settings: Period. - number of the period for collecting ticks. Default value is 2. You cannot use the standard minutes 1, 5, 15, 30, 60(hour), 240(
フィルタ:
レビューなし
レビューに返信
バージョン 5.0 2021.12.01
Компилирован под новый билд.