• 概要
  • レビュー (5)
  • コメント (25)
  • 最新情報

RSI Breakout Dashboard

5

RSI Breakout Dashboard is a tool for multiple currency pairs analysis at the same time in terms of breakout (return) from Oversold or Overbought Zone to Neutral Zone.


All displayed and used by indicator symbols are free to choose and are specified using a space separated list in parameters, so you're able to analyze not only predetermined ones, but everything that your broker offers, also commodities, equities, indices, ones with prefixes, suffixes etc.


You can choose 3 types of alerts: alert notifications in the MT4 terminal, push notifications to mobile device and email alerts, e.g. sent from VPS.


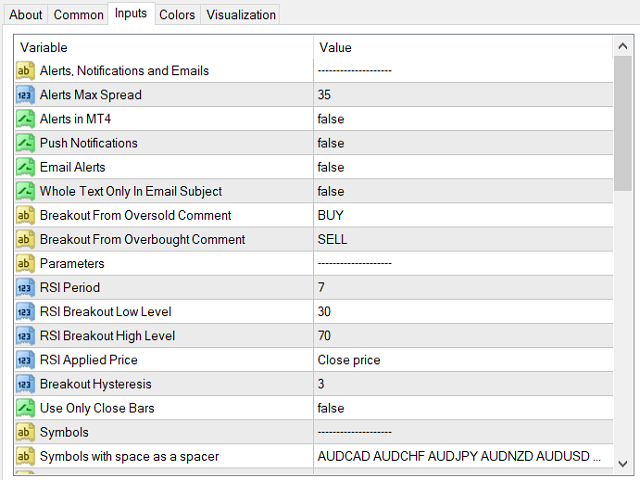
The most important parameters are period of RSI ("RSI Period"), 2 levels ("RSI Breakout Low Level", "RSI Breakout High Level") and hysteresis ("Breakout Hysteresis"). We get notifications above low and below high level if the value of RSI previously touched high or low level increased or decreased with value of hysteresis (specified in "Breakout Hysteresis" parameter). That gives us opportunity to filter bad/false signals from fluctuations of the RSI value.


The best explanation will be a simple example:

We set three parameters: RSI Breakout Low Level to 30, High Level to 70 and Breakout Hysteresis to 5,

  • if the value of RSI touches area below 25 or is equal to (25 comes from "RSI Breakout Low Level" minus "Breakout Hysteresis") indicator saves a fact of oversold state in memory and waits until "RSI Breakout Low Level" (=30) is crossed,
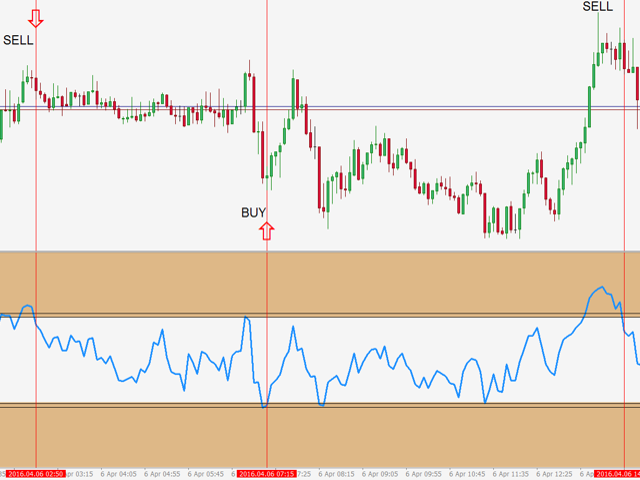
  • if RSI goes above Low Level (>30) it triggers alert to BUY (immediately or after closing the bar on specified timeframe, depending on "Use Only Closed Bars" - if "False" it alerts immediately),
  • if the RSI goes up further and touches 50, the alert state is reset (>=50) and another alert may occur when the RSI touches overbought or oversold zone and returns to neutral zone again.

In case of overbought it's similar, but inverted - the price goes down and crosses the hysteresis zone back to the neutral zone and gives SELL.


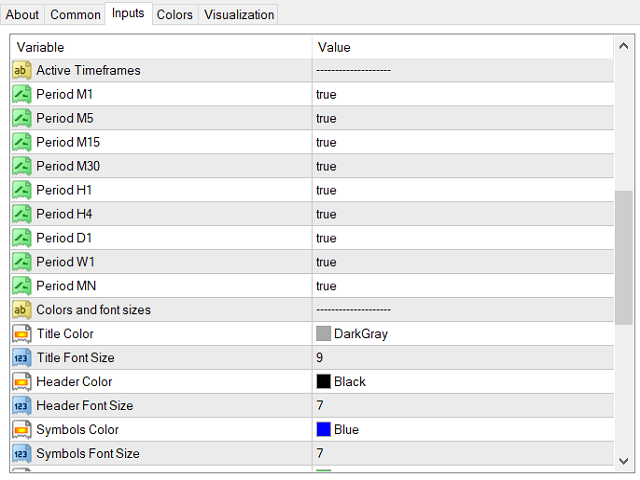
All available timeframes in MT4 are possible to choose in the parameters of indicator, from M1 (1 Minute) to MN (1 Month). On the screen you'll see (as columns) only selected TFs and they will be used for alerts, notifications, emails etc.


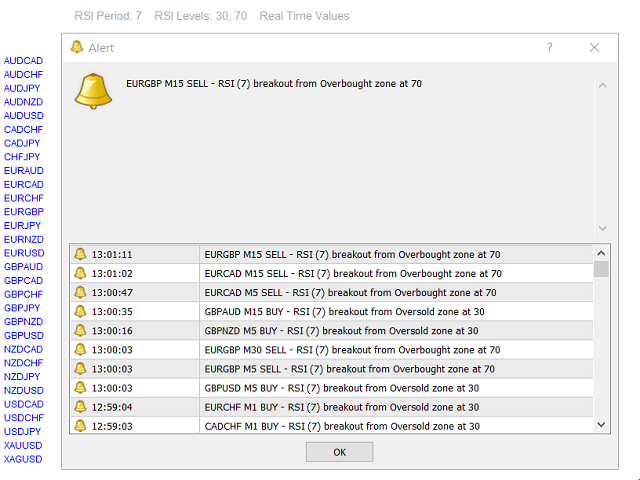
For every alert you can add comments: "Breakout From Oversold Comment" (default: "BUY") and "Breakout From Overbought Comment" (default: "SELL"), which are embedded between timeframe and RSI period. Information received in the alerts are: symbol, timeframe, comment, RSI (with given period) breakout from Oversold/Overbought zone at RSI level, eg.: EURUSD M15 BUY - RSI (14) breakout from Oversold zone at 30.

We can also choose whether the whole text of email alert is in the body or in the subject of email message ("Whole Text Only In Email Subject"). When set to False alerts look like:

Subject: GBPUSD

Body (comments on): M15 SELL - RSI (14) breakout from Overbought zone at 70

If we set "Whole Text Only In Email Subject" to True - whole text will be in subject.

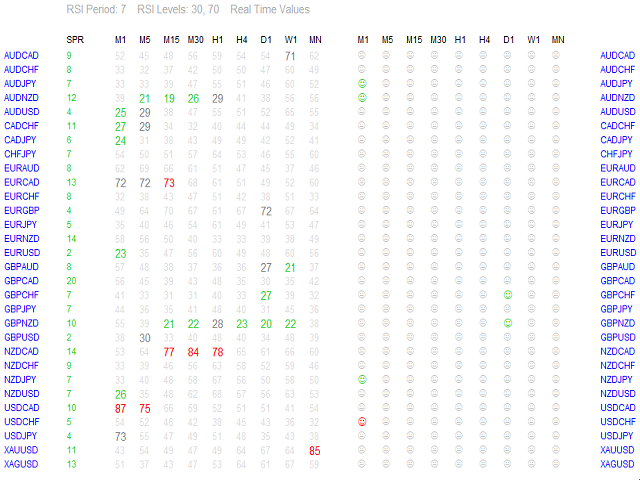
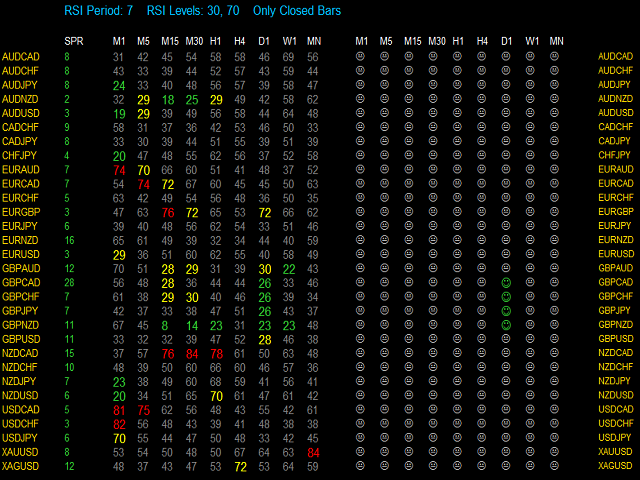
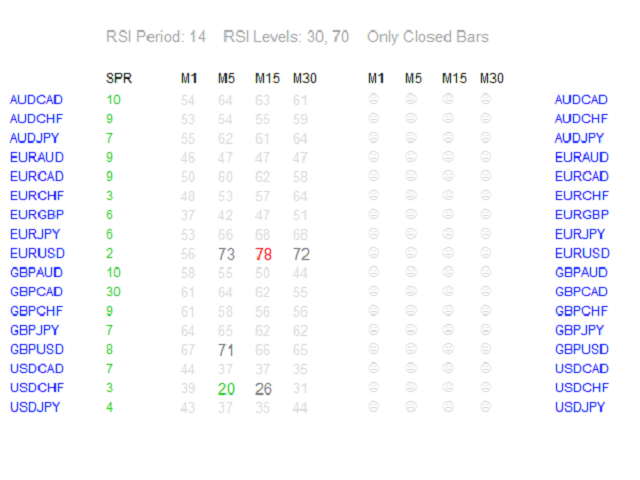
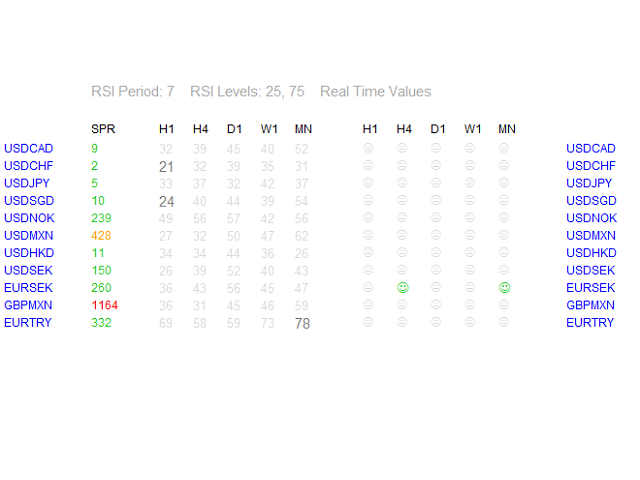
In the header of RSI Breakout Dashboard are displayed 4 actual parameters: RSI Period, 2 RSI Levels and "Real Time Values" or "Only Closed Bars" (depending on parameter "Use Only Closed Bars").


Every color and font size of an indicator is modifiable.

Default colors mean:

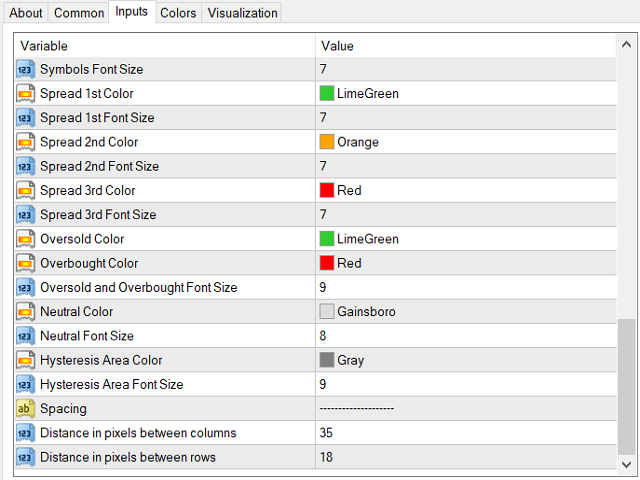
Green - RSI is below RSI Breakout Low Level decreased with Hysteresis (Oversold Zone), e.g. 30-5=25.

Red - RSI is above RSI Breakout High Level increased with Breakout_Hysteresis (Overbought Zone), e.g. 70+5=75.

Gray - RSI in Hysteresis area (e.g. between 25 and 30 or 70 and 75).

Gainsboro - RSI in Neutral Zone, e.g. between 30 and 70.


All the smileys show the last state that was triggered (green = BUY or red = SELL) so long as it is not reset to neutral (Gainsboro).


You can set maximum spread at which the alerts will come ("Alerts Max Spread").

Spread values also can have different colors:

a) when it's lower or equal to "Alerts Max Spread",

b) between 1 and 1.5 times higher than parameter,

c) above 1.5 times higher than parameter.

I suggest to make a new template with "RSI Breakout Dashboard" and scheme without colors ("None"), only Background and Foreground set to "White".


Remember, no one except yourself is responsible for any investment decision made by you.

You are responsible for your own investment research and investment decisions.

Good luck!

レビュー 5
Richard Jehl
1703
Richard Jehl 2017.02.21 01:15 
 

Dominik's projects and tools are among the most interesting and valuable over here, and the price is fair. First 5 trades using this dashboard were winners. But I still need to build a precise system as regard to SL and TP, and test on the long term. Thank you Dominik.

Johan Michel Struijk
248
Johan Michel Struijk 2017.02.16 16:57 
 

Awesome tool, great support and a great guy. I made 126% profit in a month because of his tools!

fabbry72
1350
fabbry72 2016.12.04 16:09 
 

Great dashboard very accurate,

together only two simple MA and PA in one months I made +40%

Profitable trading doesn't need complicated strategies: the right way is keep things extremely simple.

Good job Dominik !!

Fab.

おすすめのプロダクト
このインジケータは、スプレッドを3種類のフォーマットでCSVファイルに出力できるユーティリティです。 スプレッドがトレード結果に大きく影響を与えるようなスキャルピングの場合、あなたが利用するFX業者のスプレッドの仕様は、意識しなければならない重要な点です。スプレッドは時間帯によって大きく値が変化しますので、FX業者が公式に発表しているスプレッドの平均値は、あまり参考になりません。FX業者ごとのスプレッドの仕様を、ユーザー自ら調査することはとても大切なことです。このインジケーターは、そのようなユーザーのお役に立ちます。 CSVファイルの説明 CSVファイルは、( ./MQL4/Files/ )のフォルダに作成されます。ただし、テスターを使ったテストの場合には、( ./tester/files/ ) のフォルダに作成されます。CSVファイルのフォーマットの仕様は、スクリーンショットを参照してください。 CSV_file1 : スプレッドはtickごとに出力します。"YYYY/MM/DD", "HH:MI:SS", "Spread(pips)" CSV_file2 : Bar単位ごとの
Displays a digital clock in the chart in realtime. Benefits: Current time always in sight for market open/close, economic data, etc. Displays accurate time (server/broker time) Clearly visible (set color, size, font, position) Always runs/refreshes even without new price tick Hint: To display the most accurate time, use the server (broker) clock setting combined with the time (hour) offset for your time zone.
FREE
Fastest way to change the period. Suitable for traders who use many charts and timeframes. Size, shape and color can be customized. Inputs Parameters Corner — Choose corner placement Standart is "Right lower chart corner" Color — Background color of the button ColorText — Text color of the button ColorOn — Background color of the button for the current period ColorOnText — Text color of the button for the current period Font — Arial, Verdana... FontSize — Size of the font in pixels DistanceX —
FREE
Free informative Indicator-helper. It'll be usefull for traders who trade many symbols or using grid systems (Averaging or Martingale). Indicator counts drawdown as percent and currency separate. It has a number of settings: Count deposite drawdown according equity value and send e-mail or notifications to user if DD more than set; Sending e-mail when max open orders reached; Shows price and remaining pips amount before MarginCall on current chart and Account generally; Display summary trade lot
FREE
トレンドキャッチャー: アラートインジケーター付きのトレンドキャッチャーストラテジーは、市場トレンドやポテンシャルなエントリーポイントやエグジットポイントを特定するのに役立つ多目的な技術分析ツールです。動的なトレンドキャッチャーストラテジーを備えており、市場状況に適応してトレンドの方向を明確に視覚化します。トレーダーは、自身の好みやリスク許容度に合わせてパラメーターをカスタマイズできます。このインジケーターはトレンドの識別を支援し、ポテンシャルなリバーサルをシグナルし、トレイリングストップのメカニズムとして機能し、市場への迅速な対応のためのリアルタイムアラートを提供します。 特徴: - トレンドの識別:上昇トレンドと下降トレンドをシグナルします。 - トレンドのリバーサル:ローソク足の色が上昇から下降に変わった場合やその逆の場合に、ポテンシャルなリバーサルを警告します。 - リアルタイムアラート:新しいトレンドの識別に対するアラートを生成します。 推奨事項: - 通貨ペア:EURUSD、AUDUSD、XAUUSDなど... - タイムフレーム:H1。 - アカウン
FREE
Hello friends. I wrote this utility specifically for use in my profile with a large number of Expert Advisors and sets ("Joint_profiles_from_grid_sets" https://www.mql5.com/en/blogs/post/747929 ). Now, in order to limit losses on the account, there is no need to change the "Close_positions_at_percentage_of_loss" parameter on each chart. Just open one additional chart, attach this utility and set the desired percentage for closing all trades on the account. The utility has the following function
FREE
Simple RSI Forex Trading Strategy
Victor Manuel Valderrama Zamora
4 (1)
Diversify the risk in your trading account by combining our Expert Advisors. Build your own custom trading system here:   Simple Forex Trading Strategies The expert advisor opens trades when RSI indicator enter in oversold or overbought areas. The Stop Loss, Take Profit, and Trailing Stop are calculated based on the ATR indicator. The recommended currency pair is EURGBP and the recommended timeframe to operate and to do backtests is H4. This Expert Advisor can be profitable in any TimeFrame a
FREE
The Night Scalper EA Lite is a fully automated Expert Advisor that trades at night and relies on price reversion. The EA trades using market orders and has the option to use time averaging to improve performance. This EA works best on EURUSD using the M5 timeframe, but will also work on AUDUSD, GBPUSD, NZDUSD, USDCAD, USDCHF and likely many more. A VPS is advisable when trading this system and a low spread and commission based broker is best. Check the comments for back test results and optimiz
FREE
This simple but useful script calculates the lot in % of the deposit. It is indispensable for risk management. There is only one customizable parameter: MaxRisk - risk in % for lot calculation. The product works as a standard script. Launch it once on an appropriate chart and start trading using the calculated lot value. Genious is simplicity! Happy trading!
FREE
Lucky Forex Stats Lucky Forex Stats Allow users to See all Account data on their Chart, you can choose any time period and it'll show you full account details with ratio, and each pair has individual details! Advantages You can choose any time period and it'll display all detail. You can see your whole accounts details, the profit and loss with exact $figure and ratio as well. Each pair shows the profit they've earned or lose, The winning and losing trades Winning VS losing % and many
FREE
TradeMirrorはMT4/MT5プラットフォーム用のトレードコピーEAです。 なぜTradeMirrorなのか 私たちは、金融ソフトウェアのセキュリティ、安定性、プライバシーの重要性を理解しています: 操作しやすいグラフィカル・インターフェースを提供 プライバシーとセキュリティに重点を置き、注文の分配にプライバシー要件がある様々な金融シナリオに適している。 注文の正確な複製、ミリ秒単位の配信 フルプラットフォーム、MT4またはMT5をサポート; システムの状態をインテリジェントに認識し、電子メールによる通知でトランザクションのセキュリティを保護します。 コア機能リスト フォローアップ・ソフトウェアは、機能が多ければ多いほど良いというものではないので、厳密な需要分析の結果、プログラムを合理化し、最終的に以下のコア機能を維持した: 複数のコネクション メール通知 ロットスケーリング 信号フィルタリング 以下、逆順 テイクプロフィット/ストップロスのリセット 無料デモ Trademirrorを購入する前に、いつでも無料デモをお試しいただけます: このページの 無料デモ  ボタンをクリッ
FREE
Vanexio
Sayan Vandenhout
VANEXIO USES THE TREND WAVE INDICATOR AND IT CAN IDENTIFY THE BEGINNING AND THE END OF A NEW WAVE TREND MOVEMENT. AS AN OSCILLATOR, THE INDICATOR IDENTIFIES THE OVERBOUGHT AND OVERSOLD ZONES. IT WORKS GREAT TO CATCH THE SHORT TERM PRICE REVERSALS AND USES A MARTINGALE STRATEGY TO CLOSE ALL TRADES IN PROFIT. USE DEFAULT SETTINGS ON H1 OR HIGHER TIME FRAME ON ANY PAIR FOR MORE ACCURATE TRADES WHY THIS EA : Smart entries calculated by 5 great strategies The EA can be run on even a $20000
FREE
The Netsrac Correlation Trade Indicator (NCTI) was created to trade correlations between different assets. NCTI offers five different strategies to do this. Five different correlation trading strategies with two or three assets Fast access your assets with one click via asset buttons Your profit/loss at a glance Configurable alerts via screen or mobile You can use the indicator with every timeframe. Higher timeframes give fewer but better signals. If you have some questions or suggestions - plea
FREE
Free automatic Fibonacci is an indicator that automatically plots a Fibonacci retracement based on the number of bars you select on the BarsToScan setting in the indicator. The Fibonacci is automatically updated in real time as new highest and lowest values appears amongst the selected bars. You can select which level values to be displayed in the indicator settings. You can also select the color of the levels thus enabling the trader to be able to attach the indicator several times with differe
FREE
Show Pips
Roman Podpora
4.3 (54)
この情報インジケーターは、アカウントの現在の状況を常に把握したい人にとって役立ちます。このインジケーターには、ポイント、パーセンテージ、通貨での利益、現在のペアのスプレッド、現在の時間枠でバーが閉じるまでの時間などのデータが表示されます。 バージョンMT5 -   より便利なインジケーター チャート上に情報線を配置するには、いくつかのオプションがあります。 価格の右側 (価格の後ろにあります); コメントとして (グラフの左上隅に); 画面の選択した隅。 情報区切り記号を選択することもできます。 | / 。 \ # インジケーターにはホットキーが組み込まれています。 キー 1 - 情報表示の種類に戻ります (価格、コメント、コーナーの右側) キー 2 - 情報表示の種類を 1 つ進みます。 キー 3 - 情報ライン表示の位置を変更します。 ホットキーは設定で再割り当てできます。 このインジケーターは使いやすく、非常に有益です。設定で不要な情報項目を無効にすることも可能です。 設定 表示された情報を置き換えるホット キー (戻る)   - 情報表示の種類に戻ります。 表示情報を切
FREE
The "InfoBox" utility is designed to display the presence of open orders, the number of lots, current profit and much more in one window. The version for the MT5 platform   is here . You've probably encountered a situation where you have an advisor that works on a currency pair, but information about its operation: - orders and their number, the size of the spread for the instrument, the volume of lots on the market, drawdown and much more - are scattered in different places of the terminal an
FREE
ADX for majors "インディケータは、外国為替市場で主要通貨ペアの強 度を測定するために使用されるテクニカルツールです。このインディケータは、トレンドの強さとその方向を判断できるADX (Directional Movement Index)に基づいています。 このインディケータは、トレーダーが、ある時点の市場の値動きがどの程度活発かを知るのに役立ちます。さらに、「ADX for majors」は、主要通貨間のリーダーの変化に関する シグナルを提供し、これは取引の意思決定に有用な情報となり得ます。 トレーダーは、このインディケータを使用して、クロス・レートでの取引のエントリー やエグジットのタイミングを判断することができます。 例えば、NZDUSDのリーダー(成長)に関するシグナルを受信したとします。これは、NzdChfを買い、AudNzdを売る必要があることを意味します。 良い取引を! ..
FREE
Free version. Only works on EURUSD. Would you like to have statistics about your trades displayed while you operate? Have you a solid understanding of the symbol you are trading? Do you really know everything you need to about your trading account? Do you need to keep an eye on the local times around the world? Advanced Info Displayer answers to all that. It is the ultimate tool to know all sort of useful information and hidden or hard to find data. It is important if you are serious about tradi
FREE
Mirror chart
Salavat Yulamanov
4.5 (2)
このインジケーターは 1 つのチャートに 2 つの異なるペアを表示し、表示される情報を簡素化するように設計されています。   ターミナルで利用可能なほぼすべての商品(通貨ペアだけでなく、金属や原材料も)を扱うことができます。 あらゆる通貨ペアに対して視覚的な相関手法を使用する機能 サブシンボル。 通貨ペアは色付きのキャンドルで画面に表示されます。 これは同じ相関ペアです。 ミラーリング。 補助通貨。 このインジケーターは 2 種類の相関関係を反映します。 設定 サブシンボル = "USDCHF";   BullBarColor = オレンジレッド;   BearBarColor = 黄色;   color GridColor = 白;   ミラーリング = false;  The indicator displays two different pairs on one chart, designed to simplify the displayed information,   Capable of working with almost all instru
FREE
Advisor for manual and automatic trading on the trend lines of the Bollinger Bands indicator. The Expert Advisor draws trend lines from the middle band for a specified number of candles. You may be interested in my other products: https://www.mql5.com/ru/users/vypchela/seller Comments are welcome!  Recommended Broker . This Expert Advisor is available only on the MQL5 website! Options: Magic Number is a magic number. Profit - take profit Stop - stop loss. Lot - risk Limit - the maximum allowed
FREE
The indicator displays signals according to the strategy of Bill Williams on the chart. Demo version of the indicator has the same features as the paid, except that it can work only on a demo account . Signal "First Wise Man" is formed when there is a divergent bar with angulation.  Bullish divergent bar - with lower minimum and closing price in the upper half. Bearish divergent bar - higher maximum and the closing price at the bottom half. Angulation is formed when all three lines of Alligat
FREE
Vanda FX
Sayan Vandenhout
5 (2)
Vanda FX USES THE TREND WAVE INDICATOR AND IT CAN IDENTIFY THE BEGINNING AND THE END OF A NEW WAVE TREND MOVEMENT. AS AN OSCILLATOR, THE INDICATOR IDENTIFIES THE OVERBOUGHT AND OVERSOLD ZONES. IT WORKS GREAT TO CATCH THE SHORT TERM PRICE REVERSALS AND USES A MARTINGALE STRATEGY TO CLOSE ALL TRADES IN PROFIT. USE DEFAULT SETTINGS ON H1 OR HIGHER TIME FRAME ON ANY PAIR FOR MORE ACCURATE TRADES WHY THIS EA : Smart entries calculated by 4 great strategies The EA can be run on even a $2000
FREE
Account Info EA It is a tool that presents on the graph all the positions of the account, and specific information concerning the positions, but also the account. It enables the user to have an image of his account at a glance. Use like any expert advisor. You can't attach it in the same chart with other expert advisor. It does not have the ability to open or manage positions. You can attach it on any chart and any timeframe.
FREE
TrendPlus
Sivakumar Subbaiya
4.08 (12)
Trend Plus   Trendplus  Indicator   Time Frame: Suitable for any time frame.  Purpose: Trend Prediction. Blue and red candle indicate the buy and sell call respectively. Buy: When the blue candle is formed buy call is initiated. close the buy trades when the next red candle will formed.   Sell: When the Red candle is formed Sell call is initiated. close the Sell trades when the next blue candle will formed.   Happy trade!!
FREE
Indicator measures strength of each currency in your list. Main idea: It simply iterates through all combinations of pairs and adds difference between open and close in percent. Parameters: List of currencies - what currencies will be calculated (maximum is 8) Calculation type - from which data will be strength calculated Calculation data input - used as input related to calculation type Symbol suffix - used in case of suffix on symbols, e.g: when your symbols look like EURUSDm, EURUSDmicro et
FREE
Check out other great products from  https://www.mql5.com/en/users/augustinekamatu/seller   This indicator is the best so far at determining the currency strength of each pair. It provides stable values and is highly adaptive to market changes. It is a great tool to add to your arsenal to make sure you are on the right side of the trend at all times. No inputs required, it is simple plug and play. A Winning Trading Strategy This article describes the components and logic needed to develop a tr
FREE
ONREX IV  ONREX IV is a trading tool that be used to practise and enhance your manual trading skills. It's also Auto Trading Expert Advisor. Don't worry if your trades goes in the wrong direction, ONREX IV will take over and try to manage and control your risk management. ONREX IV offers a trading interface panel that allows traders to trade manually or opt FULL AUTO TRADING. It's also set to hide the Take Profit and Stop Loss. ONREX IV has its own Magic Number, please use trade button on the p
FREE
マトリックスアローインジケーターマルチタイムフレームパネルMT4 は無料のアドオンであり、マトリックスアローインジケーターMT4の優れた資産です。これは、5つのユーザーがカスタマイズした時間枠と合計16の変更可能なシンボル/機器の現在のマトリックスアローインジケーターMT4信号を示しています。ユーザーは、マトリックスアローインジケーターMT4で構成される10の標準インジケーターのいずれかを有効/無効にするオプションがあります。マトリックスアローインジケーターMT4のように、10の標準インジケーター属性もすべて調整可能です。マトリックスアローインジケーターマルチタイムフレームパネルMT4には、16個の変更可能なシンボルボタンのいずれかをクリックすることで、現在のチャートを変更するオプションもあります。これにより、異なるシンボル間ではるかに高速に作業でき、取引の機会を逃すことはありません。 この無料の マトリックスアローインジケーターマルチタイムフレームパネルMT4 アドオンを使用する場合は、ここでマトリックスアローインジケーターMT4を別途購入する必要があります: https://
FREE
FiboPlusWave Series products Ready-made trading system based on Elliott waves and Fibonacci retracement levels . It is simple and affordable. Display of the marking of Elliott waves (main or alternative option) on the chart. Construction of horizontal levels, support and resistance lines, a channel. Superposition of Fibonacci levels on waves 1, 3, 5, A Alert system (on-screen, E-Mail, Push notifications).    Features: without delving into the Elliott wave theory, you can immediately open one of
FFx Force Index
Eric Venturi-Bloxs
5 (1)
The purpose of this new version of the MT4 standard indicator provided in your platform is to display in a sub-window multiple timeframes of the same indicator. See the example shown in the picture below. But the display isn’t like a simple MTF indicator. This is the real display of the indicator on its timeframe. Here's the options available in the FFx indicator: Select the timeframes to be displayed (M1 to Monthly) Define the width (number of bars) for each timeframe box Alert pop up/sound/ema
FREE
このプロダクトを購入した人は以下も購入しています
Trade Assistant MT4
Evgeniy Kravchenko
4.43 (180)
取引 ごとのリスクの 計算、新規注文 の 簡単 な 設置、部分的 な 決済機能 を 持 つ 注文管理、 7 種類 のトレーリングストップなど 、便利 な 機能 を 備 えています 。 注意、アプリケーションはストラテジーテスターでは機能しません。 Manual, Description, Download demo ライン機能 チャート上にオープニングライン、ストップロス、テイクプロフィットを表示します。この機能により、新規注文を簡単に設定することができ、注文を出す前にその特徴を確認することができます。   リスク計算 リスク計算機能は、設定されたリスクとストップロス注文のサイズを考慮して、新規注文のボリュームを計算します。ストップロスの大きさを自由に設定できると同時に、設定したリスクを守ることができます。 Lot calc ボタン - リスク 計算 を 有効 / 無効 にします 。 Risk フィールドでは 、必要 なリスクの 値 を 0 から 100 までのパーセンテージまたは 預金通貨 で 設定 します 。 設定」 タブで 、 リスク 計算 の 種類 を 選択 します :
Local Trade Copier EA MT4
Juvenille Emperor Limited
5 (79)
Local Trade Copier EA MT4 による、驚くほど高速な取引コピーを体験してください。1分で簡単にセットアップできるこの取引コピー機は、同じWindowsコンピュータまたはWindows VPS上の複数のMetaTrader端末間で取引をコピーすることができ、0.5秒未満の高速コピースピードを実現します。 初心者であろうとプロのトレーダーであろうと、 Local Trade Copier EA MT4 には、あなたの特定のニーズに合わせてカスタマイズするための幅広いオプションが用意されています。これは、利益の可能性を高めたい人にとって究極のソリューションです。 今すぐ試してみて、これが市場で最も速くて簡単なトレードコピー機である理由を理解してください。 ヒント: デモアカウントで Local Trade Copier EA MT4 デモバージョンをダウンロードして試すことができます: ここ ダウンロードした無料のデモ ファイルを MT4 >> ファイル >> データ フォルダを開く >> MQL4 >> Experts フォルダに貼り付けて、ターミナルを再起動し
価格が一瞬で変わる可能性のある市場では、注文はできるだけ簡単にすべきだと思いますか? Metatraderでは、注文を開くたびに、開始価格を入力し、損失を止めて利益を得るウィンドウと、取引サイズを開く必要があります。金融市場の取引では、初期預金を維持し、それを増やすために資本管理が不可欠です。それで、あなたが注文をしたいとき、あなたはおそらくあなたがどれくらいの大きさの取引を開くべきか疑問に思いますか?この単一の取引であなたの預金の何パーセントを危険にさらすべきですか?この取引からどれだけの利益を得ることができますか?また、リスクに対する利益の比率はどのくらいですか?トレードサイズを設定する前に、トレードサイズがどうあるべきかという質問に対する答えを得るために必要な計算を行います。 これらすべてを自動的に行うツールがあると想像してみてください。チャートを開き、市場分析を行い、エントリーポイント、ディフェンスポイント(ストップロス)、ターゲット(テイクプロフィット)を水平線でマークし、最後にリスクのレベルを定義します。利用可能な資本の%として、このトランザクションで負担することができ、こ
The product will copy all telegram signal to MT4   ( which you are member  ) , also it can work as remote copier.  Easy to set up, copy order instant, can work with almost signal formats, image signal, s upport to translate other language to English Work with all type of channel or group, even channel have "Restrict Saving Content", work with  multi channel, multi MT5 Work as remote copier: with signal have ticket number, it will copy exactly via ticket number. Support to backtest signal. How to
MT4 to Telegram Signal Provider は使いやすく、完全にカスタマイズ可能なツールで、Telegramに信号を送信し、あなたのアカウントを信号提供者に変えることができます。 メッセージのフォーマットは 完全にカスタマイズ可能です! しかし、簡単な使用のために、あらかじめ定義されたテンプレートを選択し、メッセージの特定の部分を有効または無効にすることもできます。 [ デモ ]   [ マニュアル ] [ MT5バージョン ] [ Discordバージョン ] [ Telegramチャンネル ] セットアップ ステップバイステップの ユーザーガイド が利用可能です。 Telegram APIの知識は必要ありません。開発者が必要なものをすべて提供します。 主要機能 購読者に送信される注文の詳細をカスタマイズする機能 例えばブロンズ、シルバー、ゴールドなど、階層型のサブスクリプションモデルを作成できます。ゴールドサブスクリプションでは、すべての信号が得られますなど。 ID、シンボル、またはコメントによる注文のフィルタリング 注文が実行されたチャート
Tired of complex order placement and manual calculations? Trade Dashboard is your solution. With its user-friendly interface, placing orders becomes effortless, by a single click, you can open trades, set stop loss and take profit levels, manage trade lot size, and calculate risk to reward ratios, allowing you to only focus on your strategy. Say goodbye to manual calculations and streamline your trading experience with Trade Dashboard. Download  Demo Version  right now. You can find  Details
多機能ツール 搭載機能: ロット計算機、プライスアクション、リスク/リワードレシオ、トレードマネージャー、需要供給ゾーンなどをはじめ65以上の機能。 バージョ:デモ版   |   ユーザーマニュアル   |    MT5版 このユーティリティはストラテジー テスターでは機能しません。 ここからデモ バージョンをダウンロードして製品をテストできます。 ご不明な点や改善提案、バグの発見などございましたら、 連絡してください 。 取引プロセスを簡素化、高速化、自動化します。このダッシュボードで標準端末機能を拡張します 1. 新しい取引を開始します : ロット / リスク / RR の計算 1. Lot計算機(リスクサイズに基づく取引量計算 2. リスク計算機(ロットサイズに基づくリスク量) 3. リスク/リワードレシオ (R/R) 4. 注文のアクティベーション トリガー + Buy StopLimit / Sell StopLimit: MT4でも可  5. 仮想 SL / TP レベル (隠しSL、TP: ブローカーには見えない) 6.  Smart SL / エントリー レ
Forex Market View Dashboard and CSM
Opengates Success International
5 (1)
FFXMV Dashboard + CSM is a custom indicator combined with Currency Strength Meter . It is created to give the Traders a full view of what is going on in the market. It uses a real time data to access the market and display every bit of information needed to make a successful trading. Before attaching this Indicator to your window chart, go to your MT4's Market Watch panel and HIDE all the Currency pairs you don't need or trade and leave the rest there. The reason is that FFMV Dashboard will DISP
Exp COPYLOT CLIENT for MT4
Vladislav Andruschenko
4.7 (61)
MetaTrader4のコピー機を取引します。     それは任意の口座からの外国為替取引、ポジション、注文をコピーします。 それは最高の貿易コピー機の1つです     MT4 - MT4、MT5 - MT4     のために     COPYLOT MT4     バージョン(または     MT4 - MT5  MT5 - MT5     のために     COPYLOT MT5     バージョン)。 MT5のバージョン 完全な説明   +DEMO +PDF 購入する方法 インストールする方法     ログファイルの取得方法     テストと最適化の方法     Expforex のすべての製品 のコピー機 バージョン       MetaTrader 5 ターミナル(   МТ5 - МТ5、МТ4 - МТ5   )-   コピーロットクライアントMT5 独自のコピーアルゴリズムにより、すべての取引がマスターアカウントからクライアントアカウントに正確にコピーされます。 また、動作速度が速いことでも知られています。タフなエラー処理。 強力な機能セット。 プログ
あなたがメンバーである任意のチャンネル(プライベートおよび制限されたチャンネルを含む)からのシグナルを、直接あなたのMT4にコピーします。 このツールは、ユーザーを念頭に置いて設計されており、取引を管理および監視するために必要な多くの機能を提供しています。 この製品は、使いやすく視覚的に魅力的なグラフィカルインターフェースで提供されています。設定をカスタマイズして、数分で製品を使用開始できます! ユーザーガイド + デモ  | MT5版 | Discord版 デモを試したい場合は、ユーザーガイドを参照してください。 Telegram To MT5レシーバーは、ストラテジーテスターでは機能しません! Telegram To MT4の特長 一度に複数のチャンネルからシグナルをコピー プライベートおよび制限されたチャンネルからシグナルをコピー BotトークンやチャットIDは不要です(必要な場合は引き続き使用できます) リスク%または固定ロットを使用して取引 特定のシンボルを除外 すべてのシグナルをコピーするか、コピーするシグナルをカスタマイズするかを選択 すべてのシグナルを認識する
TradePanel MT4
Alfiya Fazylova
4.91 (85)
Trade Panel は、多機能の取引アシスタントです。 このアプリケーションには手動取引用の 50 以上の機能が含まれており、ほとんどの取引アクションを自動化できます。 購入する前に、デモ アカウントでデモ バージョンをテストできます。 デモは こちら から。 詳しい手順は こちら をご覧ください。 取引。 ワンクリックで基本的な取引操作を実行できます。 未決の注文とポジションをオープンする 注文のグリッドを開く 未決の注文とポジションを決済する ポジションの反転(買いを閉じて売りをオープンする、または売りを閉じて買いをオープンする) ポジションをロックする(反対のポジションをオープンすることで、売りポジションと買いポジションの量を等しくします) すべてのポジションを部分的に決済します。 すべてのポジションのテイクプロフィットやストップロスを共通のレベルに設定します。 すべてのポジションのストップロスを損益分岐点レベルに設定します。 注文とポジションをオープンする際に、次のことが可能になります。 確立されたリスクに応じて取引量の自動計算を使用します。 ワンクリックで複数の注文を開き
The product will copy all  Discord  signal   to MT4   ( which you are member  ) , also it can work as remote copier.  Easy to set up. Work with almost signal formats, support to translate other language to English Work with multi channel, multi MT4. Work with Image signal. Copy order instant, auto detect symbol. Work as remote copier: with signal have ticket number, it will copy exactly via ticket number. How to setup and guide: Let read all details about setup and download Discord To MetaTrade
あなたの外国為替ポートフォリオを管理してください。あなたが立っている場所、何が働いているのか、そして何があなたに痛みを引き起こしているのかを即座に見てください! ここで利用可能なMT5バージョン:https:// www.mql5.com/en/market/product/58658 Trade Managerダッシュボードは、外国為替市場での現在の各ポジションが一目でわかるように設計されており、リスク管理と通貨へのエクスポージャーを理解しやすくします。 複数のポジションで徐々に市場に参入するトレーダー、またはそれらのトレーディンググリッドとバスケット戦略にとって、これは重要な情報です。ターミナル内の複数の位置を監視することは、管理が難しいことがよくあります。 不十分なリスクの活用と使用:報酬は、新しいトレーダーや一部の経験豊富なトレーダーが直面する主要な問題です。トレードマネージャーは、各通貨へのエクスポージャーを個別に示し、一度に両方向に取引しないようにします。 特徴: オープントレード-通貨ペアでソートされた現在のオープントレードをすべて表示します。ペアだけでなく
Grid Manual MT4
Alfiya Fazylova
4.72 (18)
「Grid Manual」は、注文のグリッドを操作するための取引パネルです。 ユーティリティはユニバーサルで、柔軟な設定と直感的なインターフェイスを備えています。 それは、損失を平均化する方向だけでなく、利益を増やす方向でも注文のグリッドで機能します。 トレーダーは注文のグリッドを作成して維持する必要はありません。 すべてが「Grid Manual」によって行われます。 注文を開くだけで十分であり、「Grid Manual」は注文のグリッドを自動的に作成し、非常に閉じるまでそれに付随します。 完全な説明とデモバージョン ここ。 ユーティリティの主な機能と機能 ユーティリティは、モバイル端末から開かれた注文を含め、あらゆる方法で開かれた注文を処理します。 「制限」と「停止」の2種類のグリッドで機能します。 グリッド間隔の計算には、固定と動的(ATRインジケーターに基づく)の2つの方法で機能します。 オープンオーダーグリッドの設定を変更できます。 チャート上の各注文グリッドの損益分岐点を表示します。 各注文グリッドの利益率を表示します。 ワンクリックでグリッドから収益性の高い注文を閉じるこ
Summer 40% discount ($149 -> $88) Everything for chart Technical Analysis indicator mt4 in one tool Draw your supply demand zone with rectangle and support resistance with trendline and get alerts to mobile phone or email alert -  Risk reward indicator Video tutorials, manuals, DEMO download   here .  Find contacts on my   profile . 1.   Extended rectangles and trendlines Object will be extended to the right edge of the chart when price will draw new candles on chart. This is rectangle extend
Trade Manager は、リスクを自動的に計算しながら、取引を迅速に開始および終了するのに役立ちます。 過剰取引、復讐取引、感情的な取引を防止する機能が含まれています。 取引は自動的に管理され、アカウントのパフォーマンス指標はグラフで視覚化できます。 これらの機能により、このパネルはすべてのマニュアル トレーダーにとって理想的なものとなり、MetaTrader 4 プラットフォームの強化に役立ちます。多言語サポート。 MT5バージョン  |  ユーザーガイド + デモ Trade Manager はストラテジー テスターでは機能しません。 デモについてはユーザーガイドをご覧ください。 危機管理 % または $ に基づくリスクの自動調整 固定ロットサイズを使用するか、ボリュームとピップに基づいた自動ロットサイズ計算を使用するオプション RR、Pips、または価格を使用した損益分岐点ストップロス設定 トレーリングストップロス設定 目標に達したときにすべての取引を自動的に終了するための 1 日あたりの最大損失 (%)。 過度のドローダウンからアカウントを保護し、オーバートレードを防ぎま
VirtualTradePad mt4 Extra
Vladislav Andruschenko
4.88 (56)
ワンクリックで取引できるトレーディングパネル。ポジションと注文の操作!チャートまたはキーボードから取引。 手動取引用の取引パネル。チャート(チャートウィンドウ)またはキーボードから取引できます。開閉、リバース、ロックポジションと注文を処理する МetaТrader4のメインオーダーのトレーディングコントロールパネル:売買、売却、売却、売却、売却、閉じる、削除、修正、トレーリングストップ、ストップロス、takeproft MT5のバージョン 完全な説明   +DEMO +PDF 購入する方法 インストールする方法     ログファイルの取得方法     テストと最適化の方法     Expforex のすべての製品 シンボルウィンドウからの取引とキーボードからの取引! あなたはMetaTrader 4ターミナル - バーチャルコントロールパネルVirtualTradePadのためのユニークなプラグインを持っています。 Description on English 注意!  ストラテジーテスターの 取引方法を学びたい場合は、無料の TesterPad ユーティリティをチェック
Summer 50% discount ($199 -> $99) Advanced trading tool: One click smart orders that execute under your conditions Developed by trader for trading community:  position size calculator (lot size), open position after price action, strategy builder, set and forget trading, mobile notifications... Risk Management -  Risk percentage position size calculator, gain percentage, target risk reward ratio, spread and commissions are included in calculations 7 Advanced order types   - Set and forget tra
The Expert Advisor will help you forward all pop-up alert with screenshot from  MetaTrader 4 to Telegram channel/ group, also forward all notifications to Telegram. Parameters  -  Telegram Bot Token - create bot on Telegram and get token.  -  Telegram Chat ID  - input your Telegram user ID,  group / channel ID  -  Forward Alert - default true, to forward alert.  -  Send message as caption of Screenshot - default false, set true to send message below Screenshot  How to setup and guide  - Telegram
News Trapper EA
Noha Mohamed Fathy Younes Badr
4.82 (11)
Hi, all.  News trapper EA It is an expert for trading news very safe expert  Automated Trading on the news of the economic calendar. It shows stable trading during last 10  years. EA doesn't use dangerous technologies like martingale, grid. The Expert is very simple to use. how to install it     read the blog         after purchase contact me to add you to   VIP   channel  The program contains flexible settings for trading on the news of the economic calendar. It cannot be checked in the strat
Trade copier MT4
Alfiya Fazylova
4.52 (29)
Trade Copierは、取引口座間の取引をコピーして同期するように設計された専門的なユーティリティです。 コピーは、同じコンピューターまたはvps にインストールされている、サプライヤーのアカウント/端末から受信者のアカウント/端末に行われます。 購入する前に、デモ アカウントでデモ バージョンをテストできます。 デモ版 こちら 。 詳細な説明は こちら 。 主な機能と利点: MT5ネッティングアカウントを含む、MT4> MT4、MT4> MT5、MT5> MT4のコピーをサポートします。 高いコピー速度(0.5秒未満)。 ベンダーモードと受信者モードは同じ製品内に実装されています。 チャートから直接リアルタイムでコピーを制御できる、簡単で直感的なインターフェイス。 接続が切断されたり、端末が再起動されたりしても、設定と位置が失われることはありません。 コピーするシンボルを選択できます。また、受信者のシンボルを置き換えることもできます(例:EURUSD> USDJPY)。 バックコピーをサポートします。 特定の注文のみのコピーを有効にする機能。 取引開始価格の最大差と最大遅延時間を
DrawDown Limiter MT4
Haidar, Lionel Haj Ali
5 (8)
Drawdown Limiter EA You are in the right place if you were searching for Drawdown control, Drawdown limiter, Balance protection, Equity Protection or Daily Drawdown Limit related to Prop Firm, FTMO, or Funded account trading, or if you want to protect your trading account. Have you suffered from controlling your drawdown when trading funded accounts? This EA is meant for you. Prop firms usually set a rule called “Trader Daily Drawdown”, and if it is not respected, you are disqualified.  I am an
Eezeorder 2
Tawanda Tinarwo
5 (2)
NEW VERSION!  NB: IF YOU ARE USING A VERY HIGH RESOLUTION MACHINE AND THE EA DISPLAY LOOKS TOO SMALL, CONTACT ME SO I CAN HELP YOU. Open Multiple Trades on MT4 in 1 click at one price. Enter the Lot size Specify the number of trades you want to open Choose whether you want TP SL or Trailing Stop Once you are done, click Buy or Sell Open Multiple Pending Orders on MT4 in 1 click at one price. Enter the Lot size Specify the gap from the current price, where you want to place the pending order Spe
このエキスパートアドバイザーは、コストのかかるドローダウンを防止したり、取引ルールを遵守したりするために、取引口座のエクイティを常に監視しています。特定のルールセットに違反すると、EAは警告を発し、すべての取引を終了し、場合によっては、保留中のすべての注文を削除します。オプションで、すべてのチャートを閉じて、アカウントで動作しているすべてのEAを削除することもできます。このEAは、FTMOチャレンジやPZチャレンジなどの自己勘定取引チャレンジに特に役立ちます。 [ インストールガイド | アップデートガイド | トラブルシューティング | FAQ | すべての製品 ] 次の機能が実装されており、自由に有効または無効にできます。 エクイティ最大損失、別名トレーリングエクイティドローダウン 毎日のエクイティ最大損失 エクイティ利益目標 エクイティトレーリングストップ その他の利点は次のとおりです。 使いやすいデッド 自己勘定取引会社やトレーダーに便利 あらゆる種類のアラートを実装します ターミナルに報告する 技術的な案内: それはそれ自身で最大エクイティとデイリーエクイ
このプログラムでは、非常に使いやすいユーザーインターフェースを使用して、MetaTraderアカウントからすべての取引を直接Notionにエクスポートできます。  MT5 バージョン  |  ユーザーガイド + デモ 始めるには、ユーザーガイドをご利用いただき、Notionのテンプレートをダウンロードしてください。 デモが必要な場合は、ユーザーガイドをご覧ください。ストラテジーテスターでは機能しません! 主な特長 取引口座からすべての取引をNotionにエクスポート 最終日からの取引をエクスポートする 最終週からの取引をエクスポートする 最終月からの取引をエクスポートする カスタム時間範囲からの取引をエクスポートする すべての新しい閉じられた取引を自動的にNotionに送信する 注文タイプ、ボリューム、オープン時間、クローズ時間などのエクスポートに含めるフィールドを選択する 始め方 上記のユーザーガイドに移動するか、EAを起動して「接続ヘルプを取得」をクリックしてください。 接続したら、「開始:すべてをエクスポート」をクリックして、履歴からすべての現在の取引をNotionに送信
Mentfx Mmanage
Anton Jere Calmes
5 (15)
The added video will show you the full functionality, effectiveness, and simplicity of this trade manager. Drag and Drop Trade Manager. Draw your entry and have the tool calculate the rest. Advanced targeting and close portions of a trade directly available in tool (manage trades while you sleep). Market order or limit order on either side with factored spread. Just draw the entry, the tool does the rest. Hotkey setup to make it simple. Draw where you want to enter, and the stop loss, the tool c
DFGX Dashboard
Tsvetan Tsvetanov
5 (2)
Take your trading to the next level with DFGX - our second generation Dynamic Fibonacci Grid. This new, powerful and easy to use application is specially designed and optimized for contrarian intraday trading, scalping and news trading on the Forex market. This system is the ideal solution for active professional traders and scalpers who are looking for innovative ways to optimize their strategy. The system also provides excellent opportunity for new traders who want to learn to trade in a syste
Trade Copier Global: The name speaks for itself. This copier allows you to copy orders between MT4 terminals even if they are not installed on the same computer. Features Copying trades between MT4 terminals around the world with a short delay. Automatically recognizes symbol prefixes. Can connect many Slaves to the same Master. Supports pending and market orders. Supports partial order close (with limitations, see below) Can send messages and notifications to the Slaves from the Master Severa
これは、グリッドシステムを取引する半自動のエキスパートアドバイザーです。アイデアは、市場で徐々にさまざまなポジションを取り、次にそれらの損益分岐点を計算することです。価格がこの損益分岐点を所定の距離だけ通過すると、すべての未決済注文がクローズされます。 重要な情報 ユーザーガイドは次のとおりです。   https://www.mql5.com/en/blogs/post/730567 このEAは、他のどの製品でも試すことができ ます。https://www.mql5.com/en/users/bermaui314/seller 重要な機能 EAには、予期しない結果から取引資本を保護するためのストップロスメカニズムがあります。 EURUSD-XAUUSD-Oil-BitcoinのようなMT4シンボルを取引することができます。 MT4の時間枠をトレードすることができます。 VPSからEAを実行することをお勧めします。 パラメータとデフォルト設定 1)お金の管理設定 ロットを開始します。 レバレッジが1:400以上の場合、デフォルト設定で500ドルごとに0.0
This EA Utility allows you to manage (with advanced filtering) unlimited open orders (manual or EA) with 16 trailing stop methods: fixed, percent, ATR Exit, Chandelier Exit, Moving Average, Candle High Low Exit, Bollinger Bands, Parabolic, Envelope, Fractal, Ichimoku Kijun-Sen, Alligator, Exit After X Minutes or Bars, RSI and Stochastic. The trailing stop can be either real or virtual, and you can exit fully or with a partial close percent on touch or bar close.  Moreover, you can add (overr
作者のその他のプロダクト
Technical Dashboard is a great tool for quickest possible analysis of multiple currency pairs in terms of coherent conditions of 4 different indicators at the same time. The number of displayed symbols is 30 and the name of each symbol can be edited in the parameters, so we are able to analyze not only predetermined currency pairs, but also other ones, commodities, equities, indices, currency pairs with prefixes and suffixes etc. This analyzer is perfect for alert notifications through the MetaT
MFI Pointer is an indicator based on Money Flow Index indicator that uses both price and volume to measure buying and selling pressure. Money Flow Index is also known as volume-weighted RSI . MFI Pointer simply draws arrows on chart window when value of Money Flow Index (from parameter MFI_Period) is below MFI_Level (green upward pointing arrow) or above 100-MFI_Level (red downward pointing arrow). Indicator works on all timeframes and all currency pairs, commodities, indices, stocks etc. MFI Po
RSI Dashboard is a great tool for quickest possible analysis of multiple currency pairs  at the same time in terms of Oversold or Overbought . All displayed and used by indicator symbols are freely to choose and are specified using a space separated list in parameters you're able to analyze not only predetermined ones, but everything that your broker offers, also commodities, equities, indices, ones with prefixes, suffixes etc. There are 3 types of alerts: alert notifications in the MT4 term
Interceptor - professional volume and price extremes indicator. Interceptor is a powerful indicator, which thanks to a combination of four different types of normalized indicators in one algorithm can correctly identify extremes of the price leading to retracements and reversals in the trend. Algorithm is based mainly on combination of Accumulation/Distribution , On Balance Volume , Money Flow Index and Relative Strength Index . The first parameter of Interceptor is Interceptor_Depth which defin
Volume Volatility Dashboard is a great tool for quickest possible analysis of multiple currency pairs in terms of extremely high and extremely low accumulation to distribution ratio in comparison to values from past. The number of displayed symbols is 30 and the name of each symbol can be edited in the parameters, so we are able to analyze not only predetermined currency pairs, but also other ones, commodities, equities, indices, currency pairs with prefixes and suffixes etc... This analyzer is
It's a simple but useful tool for creating a grid based on Envelopes. Only 2 parameters can be set: 1) "Period" - the period of all visible Envelopes (i.e. 4) and 1 Moving Average (Envelopes axis), 2) "Deviations Distance" - the distance between Envelopes. Naturally, the colors of all 9 lines can be changed as desired. It works with everything that is available in your Market Watch. Good luck!
FREE
It's a simple but useful tool for creating a grid based on Bollinger Bands . Only 2 parameters can be set: 1) "Period" - the period of all visible Bollinger Bands (i.e. 4) and 1 Moving Average (axis of all Bollinger Bands), 2) "Deviations Distance" - the distance between Bollinger Bands. Naturally, the colors of all 9 lines can be changed as desired. It works with everything that is available in your Market Watch. Good luck!
FREE
RSI Pointer is an indicator which simply draws arrows on a chart window when the value of RSI (from parameter RSI_Period) is below RSI_Level (green upward pointing arrow) or above 100-RSI_Level (red downward pointing arrow). RSI Pointer works on all timeframes and all currency pairs, commodities, indices, stocks etc. RSI Pointer has only two parameters, RSI_Period and RSI_Level . For example, if you set RSI_Period=7 and RSI_Level=20, the indicator will draw arrows for values below 20 (oversold)
CCI Pointer is an indicator which simply draws arrows on chart window when value of CCI (from parameter CCI_Period) is above CCI_Level (red downward pointing arrow) or below negative CCI_Level (green upward pointing arrow). CCI Pointer works on all timeframes and all currency pairs, commodities, indices, stocks etc. CCI Pointer has only two parameters, CCI_Period and CCI_Level . For example, if you set CCI_Period=25 and CCI_Level=200 indicator will draw arrows for values below -200 (oversold) an
ADX Pointer is an indicator which is based on "Average Directional Index" and draws three numbers in chart window depending on the value of ADX. In ADX Pointer you can set "ADX_Period" which is of course period of Average Directional Index and you can also set 3 levels. When ADX value exceed first level ("ADX_Level1") in chart window appears number "1", when ADX exceed second level ("ADX_Level2") appears "2" and when ADX exceed third level ("ADX_Level3") appears "3". Simple. ADX Pointer works on
Spread Display is a simple but very helpful indicator allowing live monitoring of spread in chart window. Using this indicator, there's no need to distract attention never again, seeking current spread value somewhere else. From now on, everything is clear and at the height of your eyes, in chart window of selected currency pair. Indicator has many settings. We can choose any font we want and we can set 3 spread levels ( Spread_Level_1 , Spread_Level_2 and Spread_Level_3 ) between which will cha
Volume Volatility is an indicator which analyzes currency pairs, indices, commodities etc. in terms of extremely high and extremely low accumulation to distribution ratio in comparison to values from past. The most important parameter is "Volume Volatility Factor" - this parameter, in big simplification, determines how far distance in the past is analyzed. The lower value of the parameter, the indicator analyzes less data from the past. I recommend you to set and test e.g. 3, 5, 15, 35, and 48 w
MFI Breakout Dashboard is a tool for multiple currency pairs analysis at the same time in terms of breakout from Oversold or Overbought Zone . Money Flow Index (MFI) uses both price and volume to measure buying and selling pressure. MFI is also known as volume-weighted RSI (Relative Strength Index). The number of displayed symbols is 30 and the name of each symbol can be edited in the parameters. The analyzer is perfect for alert notifications, push notifications and email alerts. We can also se
MFI Extremes Dashboard is a great tool for quickest possible analysis of multiple currency pairs in terms of Oversold or Overbought at the same time. Money Flow Index (MFI) uses both price and volume to measure buying and selling pressure. MFI is also known as volume-weighted RSI (Relative Strength Index). The number of displayed symbols is 30 and the name of each symbol can be edited in the parameters, so we are able to analyze not only predetermined currency pairs, but also other ones, commodi
Closing Orders At Specified Time is a utility which helps you to close opened orders and delete pending orders at a specified time - especially when you cannot be online and do it by yourself at that time. You can schedule a specific time for closing orders, and additionally you can choose what type of orders should be closed (all, only opened or only pending), what symbols (all or you can enter names of three symbols) and with what Magic Number. You can also select to close only profitable or o
フィルタ:
Richard Jehl
1703
Richard Jehl 2017.02.21 01:15 
 

Dominik's projects and tools are among the most interesting and valuable over here, and the price is fair. First 5 trades using this dashboard were winners. But I still need to build a precise system as regard to SL and TP, and test on the long term. Thank you Dominik.

Johan Michel Struijk
248
Johan Michel Struijk 2017.02.16 16:57 
 

Awesome tool, great support and a great guy. I made 126% profit in a month because of his tools!

fabbry72
1350
fabbry72 2016.12.04 16:09 
 

Great dashboard very accurate,

together only two simple MA and PA in one months I made +40%

Profitable trading doesn't need complicated strategies: the right way is keep things extremely simple.

Good job Dominik !!

Fab.

schweizer
47
schweizer 2016.08.03 11:51 
 

ユーザーは評価に対して何もコメントを残しませんでした

khoopla
22
khoopla 2016.07.29 17:59 
 

ユーザーは評価に対して何もコメントを残しませんでした

レビューに返信
バージョン 2.0 2020.06.22
Added an option to select on/off each one timeframe from all timeframes available in MT4, from M1 to MN. Selected timeframes are visible and used by indicator for alerts etc. Unused timeframes are hidden and inactive.

Changed the method of entering symbols in the form of a convenient list. Only entered symbols (and available on active account) are visible and used. Anything that is not on the list or is on the list, but doesn't exist on an account is automatically excluded from the list of visible symbols on dashboard.

Added parameter "RSI Applied Price" to choose desired price base for RSI calculations (all possible methods are available, i.e. Close Price, Open Price, Maximum and Minimum Price for the period, Median, Typical and Average Price).

Added possibility to change all font sizes, colors and to set spacing in pixels between columns and rows.

Cosmetic changes like removing underscores ("_") from parameter names.

Optimized code.