• 概要
  • レビュー (8)
  • コメント (90)
  • 最新情報

RSI Dashboard Multi Overbought Oversold Analyzer

4.86

RSI Dashboard is a great tool for quickest possible analysis of multiple currency pairs at the same time in terms of Oversold or Overbought.


All displayed and used by indicator symbols are freely to choose and are specified using a space separated list in parameters you're able to analyze not only predetermined ones, but everything that your broker offers, also commodities, equities, indices, ones with prefixes, suffixes etc.


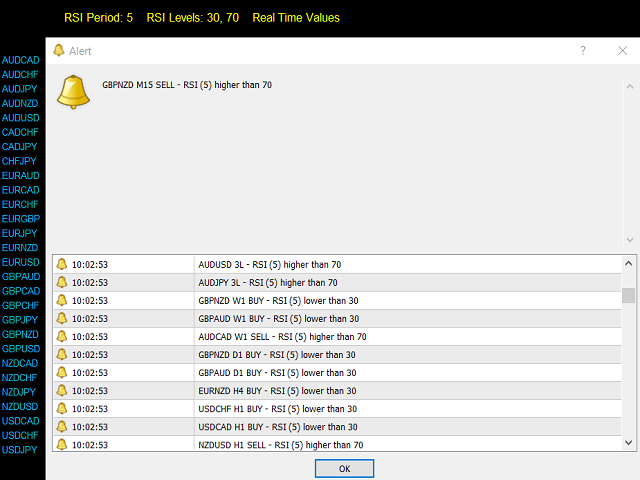
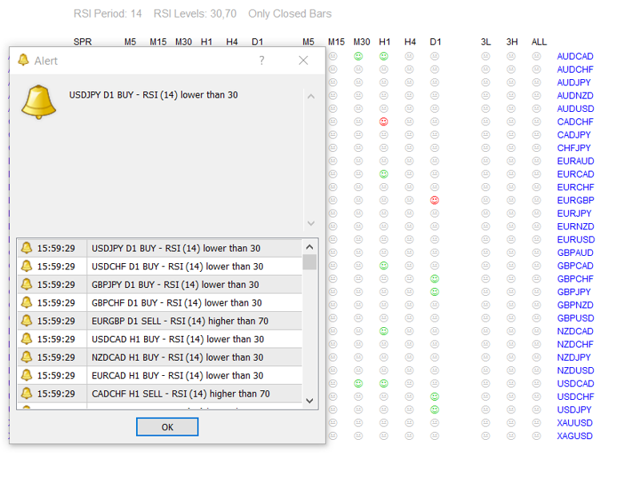
There are 3 types of alerts: alert notifications in the MT4 terminal, push notifications to mobile device and email alerts.


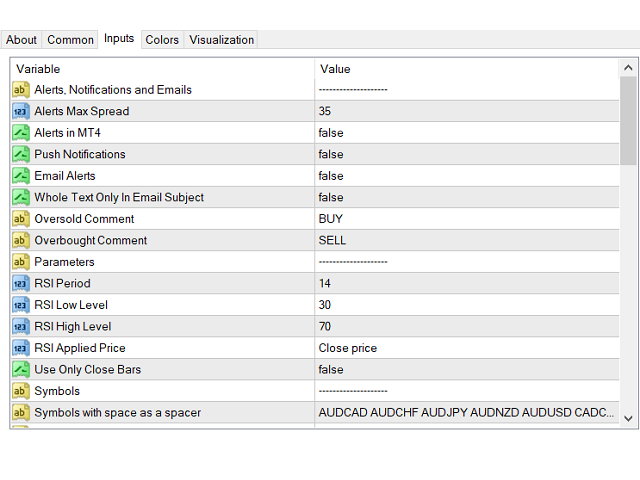
The most important parameters are "RSI Period" and 2 levels: "RSI Low Level" and "RSI High Level", below/above which you get alerts.

You can choose desired price base for calculations("RSI Applied Price") as Close Price, Open Price, Maximum/Minimum Price for the period, Median, Typical or Average Price.

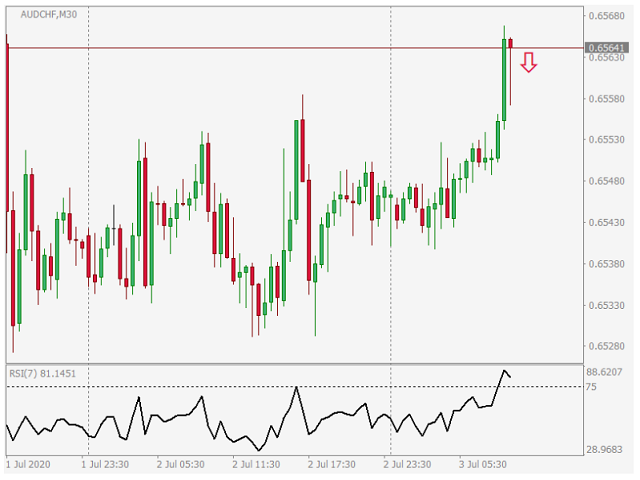
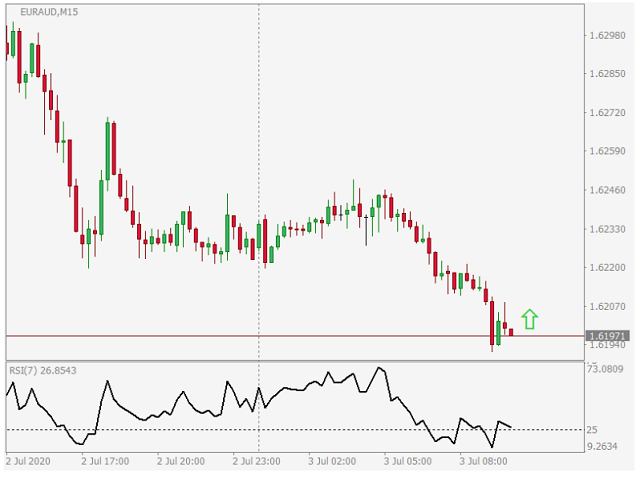
If RSI Period=7, RSI Low Level=20 and RSI High Level=80, you get alerts when RSI with period 7 for a given currency pair on selected timeframes is be below 20 (OS) or above 80 (OB).


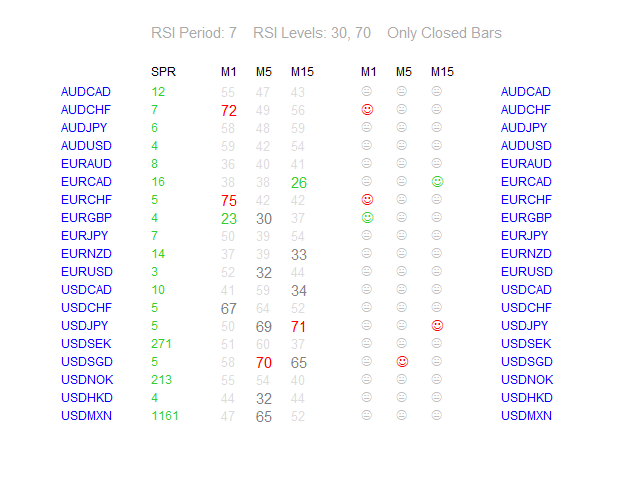
Another parameter is "Use Only Closed Bars" - if set to "True" alerts come only from closed candles. If set to "False" - alerts come immediately.


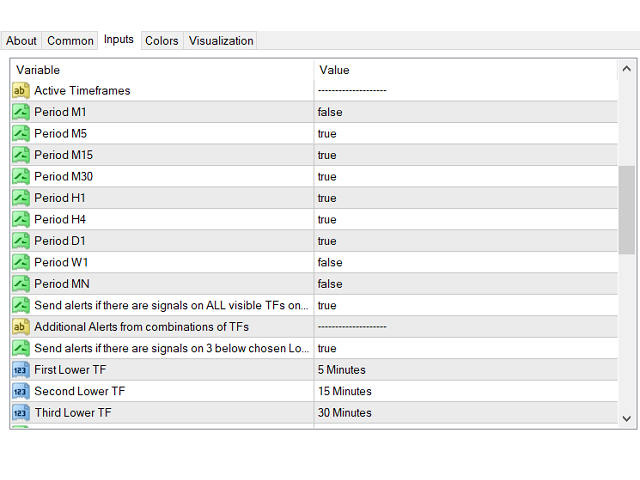
All available MT4 timeframes are possible to choose in parameters of indicator, from M1 (1 Minute) to MN (1 Month). On the screen you see (as columns)  selected timeframes and only they will be used for alerts.


You have possibility to choose alerts from all chosen timeframes and two sets of combined timeframes with same conditions - all in Overbought or Oversold zone:

"Send alerts if there are signals on...

  •  ...ALL visible TFs on pair" - if "True", it just does what it says,
  • ...3 below chosen Lower TFs" - if "True", alerts come when conditions match for the below selected 3 timeframes (and they can be also duplicated - so the alerts will be sent when the conditions match only for 2 timeframes).
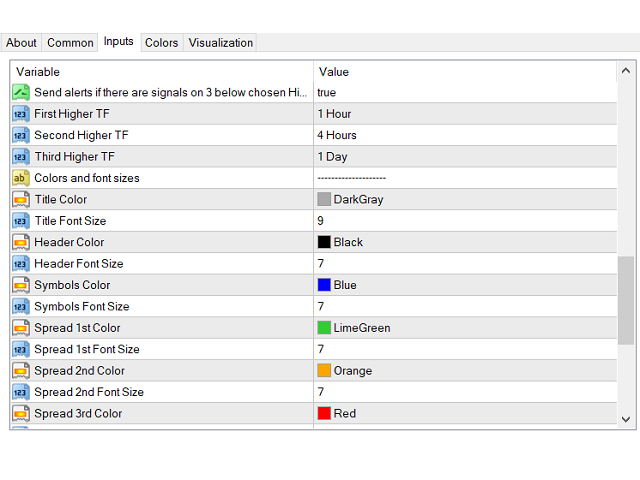
  • ...3 below chosen Higher TFs" - analogical as above.
You can experiment with any timeframe, even combine M1 with MN.


For all alerts you can add comments that work in two cases: "Oversold Comment" in the case of Oversold (RSI lower than "RSI Low Level" - default comment: "BUY") and "Overbought Comment" when Overbought (RSI value higher than "RSI High Level" - default comment: "SELL"). Information that you receive in emails are: symbol, timeframe, comment, RSI (with period) is lower/higher than (set in parameters) RSI level, eg.: EURUSD M15 BUY - RSI (14) lower than 20 or USDCHF H1 SELL - RSI (7) higher than 75. If you leave blank fields in these parameters you'll get alerts without comments.

You can choose whether the whole text of alert is in the body or in the subject of email messages ("Whole Text In Email Subject"). When set to "True" (with comments off):

Subject: GBPUSD M5 - RSI (14) higher than 70

If "False":

Subject: GBPUSD
Body: M5 - RSI (14) higher than 70


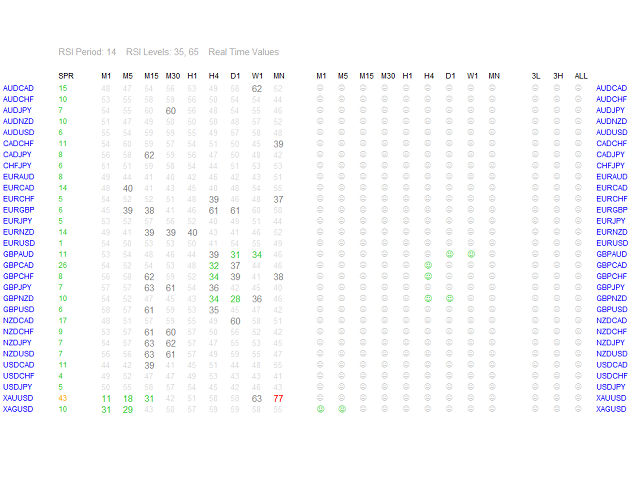
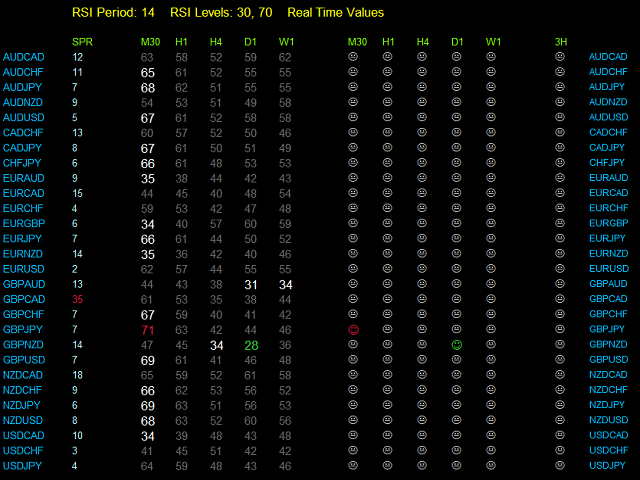
In header there are 4 parameters: RSI Period, 2 RSI Levels and "Real Time Values" or "Only Closed Bars" (depending on "Use Only Closed Bars").


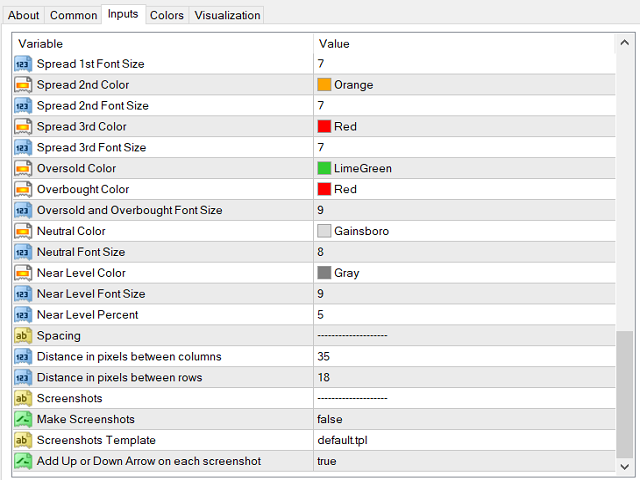
Every color and font size of RSI Dashboard is modifiable. Default colors of values and meaning:

  • Green - means that value of RSI is below RSI Low Level.
  • Red - RSI is above RSI High Level.
  • Gray - RSI value is maximal "Near Level Percent" points above RSI Low Level or below RSI High Level.


You can also set spacing as "Distance in pixels between columns" and "Distance in pixels between rows".


You can set maximum spread at which the alerts will come ("Alerts Max Spread").

Spread values also can have different colors:

  • a) when lower or equal to "Alerts Max Spread",
  • b) between 1 and 1.5 times higher,
  • c) above 1.5 times higher.


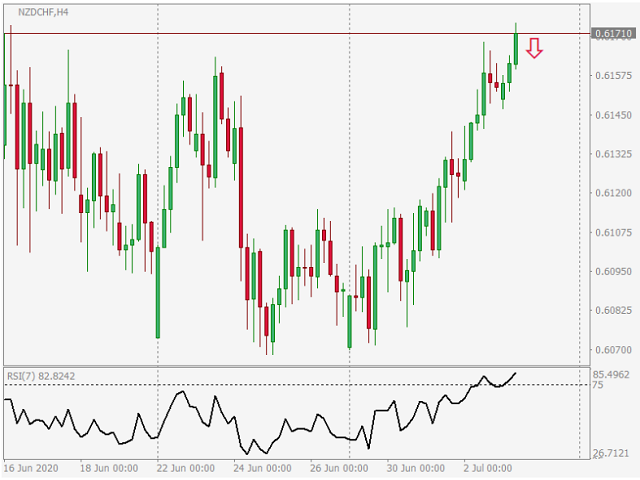
With 3 last parameters you can turn on making screenshots ("Make Screenshots"), choose template for them ("Screenshots Template") and enable or disable visible arrow ("Add Up or Down Arrow...").

Screenshots are saved in your default MT4 "Data Folder"/MQL4/Files/RSI_Dashboard/and their name look like this:

symbol - timeframe in minutes - BUY or SELL (if from 3 Lower or 3 Higher TFs than also 3L or 3H) - year - month - day - hour - minute - second.png

For example: NZDCHF-5-SELL-2020-7-3-10-20-11.png

Your template must be in MT4 "Data Folder"/templates.


I suggest to make a new template with "RSI Dashboard" without colors ("None"), only Background and Foreground set to "White".

Good luck!

レビュー 8
Yongqiang Chao
422
Yongqiang Chao 2018.09.03 07:08 
 

手动好工具!用来提醒。~

Mark Vaines
1821
Mark Vaines 2018.03.12 15:22 
 

great!!!!!

aodthth
426
aodthth 2018.02.18 16:06 
 

excellent tool for trading

おすすめのプロダクト
革新的な Trades Time Manager を使用して、取引ルーチンを簡単に管理できます。この強力なツールは、指定された時間に注文執行を自動化し、取引アプローチを変革します。 購入から注文の設定まで、すべて手動介入なしで、さまざまな取引アクションのためのパーソナライズされたタスク リストを作成します。 Trades Time Manager のインストールと入力ガイド EA に関する通知を受け取りたい場合は、MT4/MT5 ターミナルに URL を追加してください (スクリーンショットを参照)。 MT4のバージョン     https://www.mql5.com/en/market/product/103716 MT5のバージョン     https://www.mql5.com/en/market/product/103715 手動監視に別れを告げ、合理化された効率を採用します。直感的なインターフェイスにより、シンボル、約定時間、価格、ストップロス (SL)、テイクプロフィット (TP) ポイント、ロットサイズなどの正確なパラメーターを設定できます。 このツールの柔軟性は、市
Heaven Assistant: Simplify Your MT4 Management Simplify the management of the MetaTrader 4 (MT4) platform with the Heaven Assistant . This Expert Advisor (EA) is a robust tool that allows you to control and customize your trading environment in an efficient and user-friendly manner. Key Features: Multiple Pairs Opening: Quick access to most currency pairs, both major and minor, plus exotic pairs. The ability to open indices, metals, and cryptocurrencies with a single click. Template Change: Easi
Introducing AutoPilotFX: Your Ultimate Trading Panel with Advanced Features Take your trading to new heights with AutoPilotFX, an MQL4 Expert Advisor designed to streamline your trading process and optimize your strategies. Discover the powerful features it offers and learn how it can help you maximize your profits and minimize your risks. Key Features: Automatic Lot Size Calculation: AutoPilotFX automatically calculates the ideal lot size based on your desired risk-reward ratio, ensuring that y
FREE
「一目均衡表」の専門的な使い方は、一目均衡表を正しく解釈してグラフを分析することです! はトレーダーが価格グラフ上の指定された点間の比率を素早く簡 単に測定できるようにするグラフィックプログラムです。この時間と価格の指標は、MT4 プラットフォームの一目の戦略に従って図表を分析するための基本的なツールです。この ツールを使用すると、 非常に短期間での価格波だけでなく、時間波の洞察に満ちた完全な 分析も可能になります。分析の実行に費やされる労力は、エクセルを使用して実行される 同様の測定および計算と比較して、何度も最小限に抑えられます。指標は、一目均衡表戦 略を使用するトレーダーの知識と経験、およびそれらの期待を考慮して設計されています。 提示されたツールは私たちの仕事の結果です。 指標のモジュール構造により、論理的な順序で分析を実行できます。このプロセスは過去 の波に関するデータを収集することから始まり、それが将来の市場の動きを計算するため の基礎となります。 計算で考慮されるデータは、予測の正確さにとって非常に重要です。 この操作は最小限に抑えられ、即座に測定値が得られます。 この測
close all profitable orders The set contains scripts for different purposes, facilitating work in the MetaTrader 4 terminal. If necessary, a screen is provided for some scripts. Before working on a real account, check (on a demo account) whether the required script responds to your tasks (for example, there is a script for opening five orders at the same time, by default the lot is set to 10; so that you do not accidentally open five positions with a total volume of 50 lots - be attentive))) Use
** Automatically Adds to your existing trades that you open ** KFX Dashboard EA monitors Price Action using Candle Direction + Moving Average on Multiple currency pairs (selected by you) and on Multiple Timeframes (selected by you). The dashboard also reveals Currency Strength of pairs based on your Moving Average selection. KFX Dashboard EA option to set Stop Loss(SL) and Take Profit(TP) based on your selected Timeframe and ATR / Points settings. Trailing stop by ATR / Points also available (s
「一目均衡表」の専門的な使い方は、一目均衡表を正しく解釈してグラフを分析することです! はトレーダーが価格グラフ上の指定された点間の比率を素早く簡 単に測定できるようにするグラフィックプログラムです。この時間と価格の指標は、MT4 プラットフォームの一目の戦略に従って図表を分析するための基本的なツールです。この ツールを使用すると、 非常に短期間での価格波だけでなく、時間波の洞察に満ちた完全な 分析も可能になります。分析の実行に費やされる労力は、エクセルを使用して実行される 同様の測定および計算と比較して、何度も最小限に抑えられます。指標は、一目均衡表戦 略を使用するトレーダーの知識と経験、およびそれらの期待を考慮して設計されています。 提示されたツールは私たちの仕事の結果です。 指標のモジュール構造により、論理的な順序で分析を実行できます。このプロセスは過去 の波に関するデータを収集することから始まり、それが将来の市場の動きを計算するため の基礎となります。 計算で考慮されるデータは、予測の正確さにとって非常に重要です。 この操作は最小限に抑えられ、即座に測定値が得られます。 この測
FREE
Vantage is a one-click semi-automated tool which works with the user interface. The EA's base strategy is grid trading. The user can start first trade from chart buttons and the EA will do rest of the work. User can open grid to loss side, profit side or both sides same time, or can do a simple trade without the grid. Use low risk against balance and apply EA on VPS. With this, the EA can work properly without any interruption. To understand all functions watch the video below. Input parameter
Indicator Statistics MultiPairs for MT4 1. Current Openning Ords - Symbols Openning + Buy Orders + Buy Volume + Sell Orders +Sell Volume - DrawDown by Symbols - Floating by Symbols 2. Closed Orders - Statistics by Today, Week, Month, YTD and Volume - Sum of Closed Orders by Symbol 3. Statistics by Day - Statistics by Say and Volume 4. DrawDown by Day - Each day DrawDown in Week - Percent of DrawDown Contact me at Telegram   @MaiMew68
This EA has been developed, tested and traded live on NASDAQ M15 TF. Everything is ready for immediate use on real account. Very SIMPLE STRATEGY with only FEW PARAMETERS. Strategy is based on EXPANSION ON THE DAILY CHART. It enters if volatility raise after some time of consolidation. It uses STOP pending orders with ATR STOP LOSS. To catch the profits is a TRAILING PROFIT function in the strategy.  EA has been backtested on more than 10-year long tick data with 99% quality of modeling and verif
Market View MT4
Kyra Nickaline Watson-gordon
5 (1)
Definition : Market View is a dashboard (scanner) to view price graphs of all symbols and all timeframes at a glance. The utility is designed user friendly and added a wide range of customization options. Main features of Market View : Visual settings window on the chart Customizable list of symbols and timeframes Different shapes : Real Candles, Schematic Candles, Arrows Customizable number of candles Changeable size of dashboard (scanner) Highlight timeframes with gaps on candles Open appr
THIS PRODUCT CAN NOT BE TEST IN STRATEGY TESTER. PLEASE TRY DEMO VERSION: https: //www.mql5.com/en/market/product/58082 FIRST 10 COPIES AT 30 USD, NEXT PRICE WOULD BE 50 USD RISK AND TRADE MANAGER RISK AND TRADE MANAGER   is an advanced trading panel designed for manual trading.   Utility helps to manage trades effectively and efficiently with a single click. MAIN FEATURES Convert and display Stop Loss (SL)   Pips into % and amount to view the clear picture of the trades if SL hits. Fund alloca
Edward Teach Fx Это советник для краткосрочной торговли с использованием серии ордеров с их усреднением  и последующим увеличением. Советник торгует в обе стороны, выбирая более подходящую сторону в процессе торговли. Используется скрытые профиты и виртуальный скользящий стоп в виде трала.Так же советник имеет возможность останавливать торговлю (не открывать новые ордера) перед важными новостями, как   при ручной установке, так и получая информацию от индикатора "News provider" . Имеется несколь
MT42Telegram Trade Signal Alerts EA MT42Telegram Trade Signal Alerts EA is created most especially for the Forex trade Signal providers who would like to broadcast trade signals to the members of their channel on the Telegram. This EA Utility can be used to broadcast to both Private and Public Channels only but if the user wants to use it for the Telegram group also, he can create group for/from the existing channel so that when he sent trade signals, it will also go to this Channel's group wher
Calculated trend indicator, can be used with an optimal risk to profit ratio, shows successful signals. Uses two options for settings. Shows favorable moments for entering the market with arrows. The probability of a successful trend is not very bad! The indicator can be used both for pipsing on small periods, and for long-term trading. The indicator does not redraw and does not lag. It works on all currency pairs and on all timeframes.
Hello Traders! Version 3.0 of the script has been released!  What's new?  Thanks to your suggestions I have inserted these changes to the tool: 1 - Data input are now date picker, it will be easier and faster to set the data export period; 2 - A message box will check that there is not a file with the same name in your folder; 3 - Error message to check that data insert are correct. If you like this product, take a look to the FULL INTERFACE!   MT4 To Excel Interface This script is a very use
Introducing the "KFX Trade Manager" expert advisor for MetaTrader 4 (MT4), a comprehensive solution for advanced trade management and risk control. This powerful tool is designed to enhance your trading experience by automating various aspects of order handling, profit optimization, and alert notifications. With the "KFX Trade Manager," you can take your trading to the next level and streamline your operations for improved efficiency and better risk management. Key Features: Trade Management Set
This EA is based on the relationship between the three currencies, interaction, and thus hedging, I now find the most ideal pair of currencies is the default parameter of the three pairs of currencies, On the parameters Parameter setting is very simple, "Huoli" is profitable n USD. Users can determine the number of orders according to the funds of the account.
Ichimoku Cloud at a Glance Multi is the intuitive, powerful tool for analyzing the trend, support, resistance, pivots and the currency strength utilizing Ichimoku info from the multiple timeframe of the multiple cross currencies.  It let you watch 7 cross currencies' stats in one screen. It also shows the base currency relative strength intuitively.  Those 7 currencies' Ichimoku stats are shown in colors and several lines.  It also alerts possible entry point and offers one click order entries.
TradeWise EA is a compact yet powerful tool loaded with robust features. It offers a 30-trades compounding challenge , Risk-Management, Performance Tracking, Break-Even Calculation, Automated SR Zones, Trailing Stop-loss by ATR or PIPS, Automatic Risk-to Reward Ratio based on Stop-loss, Easy Order Adjustments, Calculates Total Stop Loss and Take Profit, Automatic buy and sell orders on manually placed SR Zones, and more. These features are designed to cater to both scalpers and long-term traders
FX28 Trader
Tsvetan Tsvetanov
5 (1)
FX28 Trader Dashboardをご紹介します - あなたの究極のトレードマネージャー FX28 Trader Dashboardは、あなたの外国為替(Forex)取引を新たな高みに押し上げるために設計された包括的で直感的なトレードマネージャーです。経験豊富なトレーダーでも、まだ金融の旅を始めたばかりの方でも、この強力なツールは取引活動を効率化し、意思決定プロセスを向上させるために開発されました。 主な特徴: ユーザーフレンドリーなインターフェース: FX28 Trader Dashboardは、あらゆるレベルのトレーダーに適したユーザーフレンドリーなインターフェースを備えています。さまざまな機能やツールを簡単にナビゲートし、わずか数クリックでトレードを完全にコントロールできます。 リアルタイムマーケットデータ: リアルタイムのマーケットデータフィードで先を見越してください。通貨ペア、トレンド、マーケットの変動に関する最新の情報を提供し、情報を元に自信を持ってトレードを実行できます。 高度なトレードアナリティクス: FX28 Trader Dashboardでは、高度なアナ
The AG algorithm is an element of a complex trading system for trading a basket of currencies for 8 major currencies for all 28 currency pairs. The algorithm is used to process data from the cluster indicator CCFp,  determining the width of the trading range relative to the previous ones,  and to calculate the trend and signal to enter and exit a position. The algorithm receives data from the indicator CCfp through 8 buffers Signals to open and close orders are transmitted for automatic tradin
Fibo Color Levels
Marlon Campos da Silva
5 (4)
Fibo Color Levels is an amazing tool for Fibonacci lovers. You can customize your preferred values, styles and formats of each level and set the color levels according to their importance. Fibo Color Levels Not add object fibonacci retracement automatically . The purpose of this indicator is not it. So you need to manually add the Fibonacci Retracement in your chart, as usually already do. Use the standard tool Fibonacci Retracement in your MT4, draw the Fibo according to the swing-high and/or s
Designed with advanced algorithms and utilizing deep learning technology, our Haiau Capital MT4 (EA) is crafted to assist you in the intricate world of forex trading. The system analyzes market behaviors and conducts transactions based on specific criteria, empowering you to engage with market trends more effectively. With the backing of nearly a decade of data, the EA employs deep learning to examine past market conditions, aiming to provide enhanced decision-making. Recommendations: Cur
Click Trade Manager
Hispraise Chinedum Abraham
5 (1)
クリック・トレード・マネージャーは、これまでで最高の製品です! ビギナーからプロップファームのトレーダーまで、最高のソリューションです。 FTMO/MFFプロップファームまたは個人口座をドローダウン限界突破から保護します。EAは自動的にすべての取引を終了させるので、ドローダウンの限界に達することはありません。 ドローダウンリミットを超える可能性がある取引は警告されます。 利益目標が達成されると、自動的に取引を終了します。 ブローカーからマジックナンバーを隠すように設定することができます。 1クリックでリスクを計算し、SLとTPで取引を行うことができます。 ストップとリミットオーダーを1クリックで発注 1クリックで各取引に異なるSLとTPで複数のFibレベルの取引を設定。 パーシャルを取る、SLをBEに移動、すべてのオープントレードをクローズ、すべての保留中のオーダーをキーボード上のキーを押すだけで削除。 あらかじめ設定された時間にすべてのトレードをクローズします。 テレグラムに全トレードのアラートを送信します。 高度にカスタマイズ可能 - あなたの取引スタ
Multiple Position Opening   is a multi-symbol multi- timeframe   script used to open simultaneously various positions . The   script   offers multi- option   through   input parameters   to   configure the positions.   Risk Management   The volume used to open each of the positions is chosen between a fixed and a variable lot size, available through the Volume and Free Margin % input parameters, respectively. If there   isn't   enough money in the account for the chosen volume, this is reduce
市場全体のすべてのシンボルの利益の可能性を分析するためのシンプルなスクリプト。 各期間の最小および最大利益をパーセントおよびステップ数で指定できます。 スクリプトは、構成に応じて最も興味深い記号を見つけます。 あなたはあなたが取引の正しい選択をするのを助けることができる市場全体の迅速で最新の分析を得るでしょう、あなたは二度と機会を逃すことはありません。 市場全体のすべてのシンボルの利益の可能性を分析するためのシンプルなスクリプト。 各期間の最小および最大利益をパーセントおよびステップ数で指定できます。 スクリプトは、構成に応じて最も興味深い記号を見つけます。 あなたはあなたが取引の正しい選択をするのを助けることができる市場全体の迅速で最新の分析を得るでしょう、あなたは二度と機会を逃すことはありません。
FREE
Trade History Exporter automatically exports trade history to a CSV (comma separated values) file. Trade History Exporter: - automatically exports trade history every time a trade is closed - allows you to manually force an export by using the "W" key on your keyboard - can use Order Comments as Magic Numbers - useful for instance when using a Trade Copier - calculates the Net Profit per trade
The Asian Session - it is a Secure Automated Software for trade Forex market and indices. This system detects the ranges between the end of the American session and the beginning of the Asian session, operating in favor of the break, thinking that this break prior to the start of the session occurs because within the Asian session there will be an impulse in favor of the break. breaking off. To adapt to the different schedules of the different brokers, you have to set the closing time of the A
Just $30 for six months!!!. This will draw Supply & Demand zones just by clicking on a candle. It can also draw a 50% line on the zone. https://youtu.be/XeO_x7cpx8g As a drawing tool, it is not active all the time after adding it to the chart. Activate by pressing 's' twice on the keyboard within a second. If activated but then decided not to draw, deactivate by pressing 's' once.  Box color depends if candle is above or below current price. Features: Draw the box up to the last current can
このプロダクトを購入した人は以下も購入しています
Trade Assistant MT4
Evgeniy Kravchenko
4.43 (180)
取引 ごとのリスクの 計算、新規注文 の 簡単 な 設置、部分的 な 決済機能 を 持 つ 注文管理、 7 種類 のトレーリングストップなど 、便利 な 機能 を 備 えています 。 注意、アプリケーションはストラテジーテスターでは機能しません。 Manual, Description, Download demo ライン機能 チャート上にオープニングライン、ストップロス、テイクプロフィットを表示します。この機能により、新規注文を簡単に設定することができ、注文を出す前にその特徴を確認することができます。   リスク計算 リスク計算機能は、設定されたリスクとストップロス注文のサイズを考慮して、新規注文のボリュームを計算します。ストップロスの大きさを自由に設定できると同時に、設定したリスクを守ることができます。 Lot calc ボタン - リスク 計算 を 有効 / 無効 にします 。 Risk フィールドでは 、必要 なリスクの 値 を 0 から 100 までのパーセンテージまたは 預金通貨 で 設定 します 。 設定」 タブで 、 リスク 計算 の 種類 を 選択 します :
Local Trade Copier EA MT4
Juvenille Emperor Limited
5 (79)
Local Trade Copier EA MT4 による、驚くほど高速な取引コピーを体験してください。1分で簡単にセットアップできるこの取引コピー機は、同じWindowsコンピュータまたはWindows VPS上の複数のMetaTrader端末間で取引をコピーすることができ、0.5秒未満の高速コピースピードを実現します。 初心者であろうとプロのトレーダーであろうと、 Local Trade Copier EA MT4 には、あなたの特定のニーズに合わせてカスタマイズするための幅広いオプションが用意されています。これは、利益の可能性を高めたい人にとって究極のソリューションです。 今すぐ試してみて、これが市場で最も速くて簡単なトレードコピー機である理由を理解してください。 ヒント: デモアカウントで Local Trade Copier EA MT4 デモバージョンをダウンロードして試すことができます: ここ ダウンロードした無料のデモ ファイルを MT4 >> ファイル >> データ フォルダを開く >> MQL4 >> Experts フォルダに貼り付けて、ターミナルを再起動し
価格が一瞬で変わる可能性のある市場では、注文はできるだけ簡単にすべきだと思いますか? Metatraderでは、注文を開くたびに、開始価格を入力し、損失を止めて利益を得るウィンドウと、取引サイズを開く必要があります。金融市場の取引では、初期預金を維持し、それを増やすために資本管理が不可欠です。それで、あなたが注文をしたいとき、あなたはおそらくあなたがどれくらいの大きさの取引を開くべきか疑問に思いますか?この単一の取引であなたの預金の何パーセントを危険にさらすべきですか?この取引からどれだけの利益を得ることができますか?また、リスクに対する利益の比率はどのくらいですか?トレードサイズを設定する前に、トレードサイズがどうあるべきかという質問に対する答えを得るために必要な計算を行います。 これらすべてを自動的に行うツールがあると想像してみてください。チャートを開き、市場分析を行い、エントリーポイント、ディフェンスポイント(ストップロス)、ターゲット(テイクプロフィット)を水平線でマークし、最後にリスクのレベルを定義します。利用可能な資本の%として、このトランザクションで負担することができ、こ
The product will copy all telegram signal to MT4   ( which you are member  ) , also it can work as remote copier.  Easy to set up, copy order instant, can work with almost signal formats, image signal, s upport to translate other language to English Work with all type of channel or group, even channel have "Restrict Saving Content", work with  multi channel, multi MT5 Work as remote copier: with signal have ticket number, it will copy exactly via ticket number. Support to backtest signal. How to
Tired of complex order placement and manual calculations? Trade Dashboard is your solution. With its user-friendly interface, placing orders becomes effortless, by a single click, you can open trades, set stop loss and take profit levels, manage trade lot size, and calculate risk to reward ratios, allowing you to only focus on your strategy. Say goodbye to manual calculations and streamline your trading experience with Trade Dashboard. Download  Demo Version  right now. You can find  Details
MT4 to Telegram Signal Provider は使いやすく、完全にカスタマイズ可能なツールで、Telegramに信号を送信し、あなたのアカウントを信号提供者に変えることができます。 メッセージのフォーマットは 完全にカスタマイズ可能です! しかし、簡単な使用のために、あらかじめ定義されたテンプレートを選択し、メッセージの特定の部分を有効または無効にすることもできます。 [ デモ ]   [ マニュアル ] [ MT5バージョン ] [ Discordバージョン ] [ Telegramチャンネル ] セットアップ ステップバイステップの ユーザーガイド が利用可能です。 Telegram APIの知識は必要ありません。開発者が必要なものをすべて提供します。 主要機能 購読者に送信される注文の詳細をカスタマイズする機能 例えばブロンズ、シルバー、ゴールドなど、階層型のサブスクリプションモデルを作成できます。ゴールドサブスクリプションでは、すべての信号が得られますなど。 ID、シンボル、またはコメントによる注文のフィルタリング 注文が実行されたチャート
多機能ツール 搭載機能: ロット計算機、プライスアクション、リスク/リワードレシオ、トレードマネージャー、需要供給ゾーンなどをはじめ65以上の機能。 バージョ:デモ版   |   ユーザーマニュアル   |    MT5版 このユーティリティはストラテジー テスターでは機能しません。 ここからデモ バージョンをダウンロードして製品をテストできます。 ご不明な点や改善提案、バグの発見などございましたら、 連絡してください 。 取引プロセスを簡素化、高速化、自動化します。このダッシュボードで標準端末機能を拡張します 1. 新しい取引を開始します : ロット / リスク / RR の計算 1. Lot計算機(リスクサイズに基づく取引量計算 2. リスク計算機(ロットサイズに基づくリスク量) 3. リスク/リワードレシオ (R/R) 4. 注文のアクティベーション トリガー + Buy StopLimit / Sell StopLimit: MT4でも可  5. 仮想 SL / TP レベル (隠しSL、TP: ブローカーには見えない) 6.  Smart SL / エントリー レ
Forex Market View Dashboard and CSM
Opengates Success International
5 (1)
FFXMV Dashboard + CSM is a custom indicator combined with Currency Strength Meter . It is created to give the Traders a full view of what is going on in the market. It uses a real time data to access the market and display every bit of information needed to make a successful trading. Before attaching this Indicator to your window chart, go to your MT4's Market Watch panel and HIDE all the Currency pairs you don't need or trade and leave the rest there. The reason is that FFMV Dashboard will DISP
あなたがメンバーである任意のチャンネル(プライベートおよび制限されたチャンネルを含む)からのシグナルを、直接あなたのMT4にコピーします。 このツールは、ユーザーを念頭に置いて設計されており、取引を管理および監視するために必要な多くの機能を提供しています。 この製品は、使いやすく視覚的に魅力的なグラフィカルインターフェースで提供されています。設定をカスタマイズして、数分で製品を使用開始できます! ユーザーガイド + デモ  | MT5版 | Discord版 デモを試したい場合は、ユーザーガイドを参照してください。 Telegram To MT5レシーバーは、ストラテジーテスターでは機能しません! Telegram To MT4の特長 一度に複数のチャンネルからシグナルをコピー プライベートおよび制限されたチャンネルからシグナルをコピー BotトークンやチャットIDは不要です(必要な場合は引き続き使用できます) リスク%または固定ロットを使用して取引 特定のシンボルを除外 すべてのシグナルをコピーするか、コピーするシグナルをカスタマイズするかを選択 すべてのシグナルを認識する
Exp COPYLOT CLIENT for MT4
Vladislav Andruschenko
4.7 (61)
MetaTrader4のコピー機を取引します。     それは任意の口座からの外国為替取引、ポジション、注文をコピーします。 それは最高の貿易コピー機の1つです     MT4 - MT4、MT5 - MT4     のために     COPYLOT MT4     バージョン(または     MT4 - MT5  MT5 - MT5     のために     COPYLOT MT5     バージョン)。 MT5のバージョン 完全な説明   +DEMO +PDF 購入する方法 インストールする方法     ログファイルの取得方法     テストと最適化の方法     Expforex のすべての製品 のコピー機 バージョン       MetaTrader 5 ターミナル(   МТ5 - МТ5、МТ4 - МТ5   )-   コピーロットクライアントMT5 独自のコピーアルゴリズムにより、すべての取引がマスターアカウントからクライアントアカウントに正確にコピーされます。 また、動作速度が速いことでも知られています。タフなエラー処理。 強力な機能セット。 プログ
The product will copy all  Discord  signal   to MT4   ( which you are member  ) , also it can work as remote copier.  Easy to set up. Work with almost signal formats, support to translate other language to English Work with multi channel, multi MT4. Work with Image signal. Copy order instant, auto detect symbol. Work as remote copier: with signal have ticket number, it will copy exactly via ticket number. How to setup and guide: Let read all details about setup and download Discord To MetaTrade
Trade Manager は、リスクを自動的に計算しながら、取引を迅速に開始および終了するのに役立ちます。 過剰取引、復讐取引、感情的な取引を防止する機能が含まれています。 取引は自動的に管理され、アカウントのパフォーマンス指標はグラフで視覚化できます。 これらの機能により、このパネルはすべてのマニュアル トレーダーにとって理想的なものとなり、MetaTrader 4 プラットフォームの強化に役立ちます。多言語サポート。 MT5バージョン  |  ユーザーガイド + デモ Trade Manager はストラテジー テスターでは機能しません。 デモについてはユーザーガイドをご覧ください。 危機管理 % または $ に基づくリスクの自動調整 固定ロットサイズを使用するか、ボリュームとピップに基づいた自動ロットサイズ計算を使用するオプション RR、Pips、または価格を使用した損益分岐点ストップロス設定 トレーリングストップロス設定 目標に達したときにすべての取引を自動的に終了するための 1 日あたりの最大損失 (%)。 過度のドローダウンからアカウントを保護し、オーバートレードを防ぎま
TradePanel MT4
Alfiya Fazylova
4.91 (85)
Trade Panel は、多機能の取引アシスタントです。 このアプリケーションには手動取引用の 50 以上の機能が含まれており、ほとんどの取引アクションを自動化できます。 購入する前に、デモ アカウントでデモ バージョンをテストできます。 デモは こちら から。 詳しい手順は こちら をご覧ください。 取引。 ワンクリックで基本的な取引操作を実行できます。 未決の注文とポジションをオープンする 注文のグリッドを開く 未決の注文とポジションを決済する ポジションの反転(買いを閉じて売りをオープンする、または売りを閉じて買いをオープンする) ポジションをロックする(反対のポジションをオープンすることで、売りポジションと買いポジションの量を等しくします) すべてのポジションを部分的に決済します。 すべてのポジションのテイクプロフィットやストップロスを共通のレベルに設定します。 すべてのポジションのストップロスを損益分岐点レベルに設定します。 注文とポジションをオープンする際に、次のことが可能になります。 確立されたリスクに応じて取引量の自動計算を使用します。 ワンクリックで複数の注文を開き
あなたの外国為替ポートフォリオを管理してください。あなたが立っている場所、何が働いているのか、そして何があなたに痛みを引き起こしているのかを即座に見てください! ここで利用可能なMT5バージョン:https:// www.mql5.com/en/market/product/58658 Trade Managerダッシュボードは、外国為替市場での現在の各ポジションが一目でわかるように設計されており、リスク管理と通貨へのエクスポージャーを理解しやすくします。 複数のポジションで徐々に市場に参入するトレーダー、またはそれらのトレーディンググリッドとバスケット戦略にとって、これは重要な情報です。ターミナル内の複数の位置を監視することは、管理が難しいことがよくあります。 不十分なリスクの活用と使用:報酬は、新しいトレーダーや一部の経験豊富なトレーダーが直面する主要な問題です。トレードマネージャーは、各通貨へのエクスポージャーを個別に示し、一度に両方向に取引しないようにします。 特徴: オープントレード-通貨ペアでソートされた現在のオープントレードをすべて表示します。ペアだけでなく
News Trapper EA
Noha Mohamed Fathy Younes Badr
4.82 (11)
Hi, all.  News trapper EA It is an expert for trading news very safe expert  Automated Trading on the news of the economic calendar. It shows stable trading during last 10  years. EA doesn't use dangerous technologies like martingale, grid. The Expert is very simple to use. how to install it     read the blog         after purchase contact me to add you to   VIP   channel  The program contains flexible settings for trading on the news of the economic calendar. It cannot be checked in the strat
Summer 40% discount ($149 -> $88) Everything for chart Technical Analysis indicator mt4 in one tool Draw your supply demand zone with rectangle and support resistance with trendline and get alerts to mobile phone or email alert -  Risk reward indicator Video tutorials, manuals, DEMO download   here .  Find contacts on my   profile . 1.   Extended rectangles and trendlines Object will be extended to the right edge of the chart when price will draw new candles on chart. This is rectangle extend
VirtualTradePad mt4 Extra
Vladislav Andruschenko
4.88 (56)
ワンクリックで取引できるトレーディングパネル。ポジションと注文の操作!チャートまたはキーボードから取引。 手動取引用の取引パネル。チャート(チャートウィンドウ)またはキーボードから取引できます。開閉、リバース、ロックポジションと注文を処理する МetaТrader4のメインオーダーのトレーディングコントロールパネル:売買、売却、売却、売却、売却、閉じる、削除、修正、トレーリングストップ、ストップロス、takeproft MT5のバージョン 完全な説明   +DEMO +PDF 購入する方法 インストールする方法     ログファイルの取得方法     テストと最適化の方法     Expforex のすべての製品 シンボルウィンドウからの取引とキーボードからの取引! あなたはMetaTrader 4ターミナル - バーチャルコントロールパネルVirtualTradePadのためのユニークなプラグインを持っています。 Description on English 注意!  ストラテジーテスターの 取引方法を学びたい場合は、無料の TesterPad ユーティリティをチェック
Summer 50% discount ($199 -> $99) Advanced trading tool: One click smart orders that execute under your conditions Developed by trader for trading community:  position size calculator (lot size), open position after price action, strategy builder, set and forget trading, mobile notifications... Risk Management -  Risk percentage position size calculator, gain percentage, target risk reward ratio, spread and commissions are included in calculations 7 Advanced order types   - Set and forget tra
Grid Manual MT4
Alfiya Fazylova
4.72 (18)
「Grid Manual」は、注文のグリッドを操作するための取引パネルです。 ユーティリティはユニバーサルで、柔軟な設定と直感的なインターフェイスを備えています。 それは、損失を平均化する方向だけでなく、利益を増やす方向でも注文のグリッドで機能します。 トレーダーは注文のグリッドを作成して維持する必要はありません。 すべてが「Grid Manual」によって行われます。 注文を開くだけで十分であり、「Grid Manual」は注文のグリッドを自動的に作成し、非常に閉じるまでそれに付随します。 完全な説明とデモバージョン ここ。 ユーティリティの主な機能と機能 ユーティリティは、モバイル端末から開かれた注文を含め、あらゆる方法で開かれた注文を処理します。 「制限」と「停止」の2種類のグリッドで機能します。 グリッド間隔の計算には、固定と動的(ATRインジケーターに基づく)の2つの方法で機能します。 オープンオーダーグリッドの設定を変更できます。 チャート上の各注文グリッドの損益分岐点を表示します。 各注文グリッドの利益率を表示します。 ワンクリックでグリッドから収益性の高い注文を閉じるこ
Trade copier MT4
Alfiya Fazylova
4.52 (29)
Trade Copierは、取引口座間の取引をコピーして同期するように設計された専門的なユーティリティです。 コピーは、同じコンピューターまたはvps にインストールされている、サプライヤーのアカウント/端末から受信者のアカウント/端末に行われます。 購入する前に、デモ アカウントでデモ バージョンをテストできます。 デモ版 こちら 。 詳細な説明は こちら 。 主な機能と利点: MT5ネッティングアカウントを含む、MT4> MT4、MT4> MT5、MT5> MT4のコピーをサポートします。 高いコピー速度(0.5秒未満)。 ベンダーモードと受信者モードは同じ製品内に実装されています。 チャートから直接リアルタイムでコピーを制御できる、簡単で直感的なインターフェイス。 接続が切断されたり、端末が再起動されたりしても、設定と位置が失われることはありません。 コピーするシンボルを選択できます。また、受信者のシンボルを置き換えることもできます(例:EURUSD> USDJPY)。 バックコピーをサポートします。 特定の注文のみのコピーを有効にする機能。 取引開始価格の最大差と最大遅延時間を
The most advanced news filter and drawdown limiter on MQL market NEW: Take a Break can be backtested against your account history! Check the " What's new " tab for details. Take a Break has evolved from a once simple news filter to a full-fledged account protection tool. It pauses any other EA during potentially unfavorable market conditions and will continue trading when the noise is over. Typical use cases: Stop trading during news/high volatility (+ close my trades before). Stop trading when
利益追跡機能で総利益/損失に達したときにMetaTrader4のポジションをクローズします。 仮想停止(個別注文)を 有効にできます。 買いと売りのポジションを別々に 計算して閉じる(別々の買い売り)、 すべてのシンボルまたは現在のシンボルのみ(すべてのシンボル)を 閉じて計算します。 利益のためにトレーリングを有効にする( トレーリング 利益) 預金通貨、ポイント、残高の%の総損益を閉じます。 このアプリケーションは、他のEAと一緒に、または手動取引と組み合わせて、任意のアカウントで使用するように設計されています。 MT5 のバージョン 完全な説明   +DEMO +PDF 購入する方法 インストールする方法     ログファイルの取得方法     テストと最適化の方法     Expforex のすべての製品 一部またはすべてのペアの貿易収支の合計が設定で指定された値以上になるとすぐに、すべてのポジションがクローズされ、注文が削除されます。 このバージョンは、指定された利益レベルでポジションを閉じることができるだけでなく、より良い結果を得るために利益を追跡することもで
DrawDown Limiter MT4
Haidar, Lionel Haj Ali
5 (8)
Drawdown Limiter EA You are in the right place if you were searching for Drawdown control, Drawdown limiter, Balance protection, Equity Protection or Daily Drawdown Limit related to Prop Firm, FTMO, or Funded account trading, or if you want to protect your trading account. Have you suffered from controlling your drawdown when trading funded accounts? This EA is meant for you. Prop firms usually set a rule called “Trader Daily Drawdown”, and if it is not respected, you are disqualified.  I am an
Bar Replay MT4
Hoang The Manh
3.43 (7)
Don't purchase before testing the Demo version first. DEMO version:   https://www.mql5.com/en/market/product/76917 __________________________________________________ This EA  - Tool allow you replay bar in Meta Trader 4 for back test. This Tool can back test in multi timeframe in only one chart. This Tool is very useful for Price action trader. It can work with Indicators, some indicators cannot works. So please download Demo to test before purchase.  Demo Version We do not accept refund in any
Eezeorder 2
Tawanda Tinarwo
5 (2)
NEW VERSION!  NB: IF YOU ARE USING A VERY HIGH RESOLUTION MACHINE AND THE EA DISPLAY LOOKS TOO SMALL, CONTACT ME SO I CAN HELP YOU. Open Multiple Trades on MT4 in 1 click at one price. Enter the Lot size Specify the number of trades you want to open Choose whether you want TP SL or Trailing Stop Once you are done, click Buy or Sell Open Multiple Pending Orders on MT4 in 1 click at one price. Enter the Lot size Specify the gap from the current price, where you want to place the pending order Spe
このエキスパートアドバイザーは、コストのかかるドローダウンを防止したり、取引ルールを遵守したりするために、取引口座のエクイティを常に監視しています。特定のルールセットに違反すると、EAは警告を発し、すべての取引を終了し、場合によっては、保留中のすべての注文を削除します。オプションで、すべてのチャートを閉じて、アカウントで動作しているすべてのEAを削除することもできます。このEAは、FTMOチャレンジやPZチャレンジなどの自己勘定取引チャレンジに特に役立ちます。 [ インストールガイド | アップデートガイド | トラブルシューティング | FAQ | すべての製品 ] 次の機能が実装されており、自由に有効または無効にできます。 エクイティ最大損失、別名トレーリングエクイティドローダウン 毎日のエクイティ最大損失 エクイティ利益目標 エクイティトレーリングストップ その他の利点は次のとおりです。 使いやすいデッド 自己勘定取引会社やトレーダーに便利 あらゆる種類のアラートを実装します ターミナルに報告する 技術的な案内: それはそれ自身で最大エクイティとデイリーエクイ
このプログラムでは、非常に使いやすいユーザーインターフェースを使用して、MetaTraderアカウントからすべての取引を直接Notionにエクスポートできます。  MT5 バージョン  |  ユーザーガイド + デモ 始めるには、ユーザーガイドをご利用いただき、Notionのテンプレートをダウンロードしてください。 デモが必要な場合は、ユーザーガイドをご覧ください。ストラテジーテスターでは機能しません! 主な特長 取引口座からすべての取引をNotionにエクスポート 最終日からの取引をエクスポートする 最終週からの取引をエクスポートする 最終月からの取引をエクスポートする カスタム時間範囲からの取引をエクスポートする すべての新しい閉じられた取引を自動的にNotionに送信する 注文タイプ、ボリューム、オープン時間、クローズ時間などのエクスポートに含めるフィールドを選択する 始め方 上記のユーザーガイドに移動するか、EAを起動して「接続ヘルプを取得」をクリックしてください。 接続したら、「開始:すべてをエクスポート」をクリックして、履歴からすべての現在の取引をNotionに送信
Trading History - A program for trading and money management on the history of quotes in stratagy tester. It can work with pending and immediate orders, and is equipped with trailing stop, breakeven and take profit functions. Very good for training and testing different strategies. Manual (Be sure to read before purchasing) Advantages 1. Allows you to test any trading strategy in the shortest possible time 2. An excellent simulator for trading training. You can gain months of trading experi
Mentfx Mmanage
Anton Jere Calmes
5 (15)
The added video will show you the full functionality, effectiveness, and simplicity of this trade manager. Drag and Drop Trade Manager. Draw your entry and have the tool calculate the rest. Advanced targeting and close portions of a trade directly available in tool (manage trades while you sleep). Market order or limit order on either side with factored spread. Just draw the entry, the tool does the rest. Hotkey setup to make it simple. Draw where you want to enter, and the stop loss, the tool c
DFGX Dashboard
Tsvetan Tsvetanov
5 (2)
Take your trading to the next level with DFGX - our second generation Dynamic Fibonacci Grid. This new, powerful and easy to use application is specially designed and optimized for contrarian intraday trading, scalping and news trading on the Forex market. This system is the ideal solution for active professional traders and scalpers who are looking for innovative ways to optimize their strategy. The system also provides excellent opportunity for new traders who want to learn to trade in a syste
作者のその他のプロダクト
Technical Dashboard is a great tool for quickest possible analysis of multiple currency pairs in terms of coherent conditions of 4 different indicators at the same time. The number of displayed symbols is 30 and the name of each symbol can be edited in the parameters, so we are able to analyze not only predetermined currency pairs, but also other ones, commodities, equities, indices, currency pairs with prefixes and suffixes etc. This analyzer is perfect for alert notifications through the MetaT
MFI Pointer is an indicator based on Money Flow Index indicator that uses both price and volume to measure buying and selling pressure. Money Flow Index is also known as volume-weighted RSI . MFI Pointer simply draws arrows on chart window when value of Money Flow Index (from parameter MFI_Period) is below MFI_Level (green upward pointing arrow) or above 100-MFI_Level (red downward pointing arrow). Indicator works on all timeframes and all currency pairs, commodities, indices, stocks etc. MFI Po
It's a simple but useful tool for creating a grid based on Bollinger Bands . Only 2 parameters can be set: 1) "Period" - the period of all visible Bollinger Bands (i.e. 4) and 1 Moving Average (axis of all Bollinger Bands), 2) "Deviations Distance" - the distance between Bollinger Bands. Naturally, the colors of all 9 lines can be changed as desired. It works with everything that is available in your Market Watch. Good luck!
FREE
Interceptor - professional volume and price extremes indicator. Interceptor is a powerful indicator, which thanks to a combination of four different types of normalized indicators in one algorithm can correctly identify extremes of the price leading to retracements and reversals in the trend. Algorithm is based mainly on combination of Accumulation/Distribution , On Balance Volume , Money Flow Index and Relative Strength Index . The first parameter of Interceptor is Interceptor_Depth which defin
Volume Volatility Dashboard is a great tool for quickest possible analysis of multiple currency pairs in terms of extremely high and extremely low accumulation to distribution ratio in comparison to values from past. The number of displayed symbols is 30 and the name of each symbol can be edited in the parameters, so we are able to analyze not only predetermined currency pairs, but also other ones, commodities, equities, indices, currency pairs with prefixes and suffixes etc... This analyzer is
It's a simple but useful tool for creating a grid based on Envelopes. Only 2 parameters can be set: 1) "Period" - the period of all visible Envelopes (i.e. 4) and 1 Moving Average (Envelopes axis), 2) "Deviations Distance" - the distance between Envelopes. Naturally, the colors of all 9 lines can be changed as desired. It works with everything that is available in your Market Watch. Good luck!
FREE
RSI Pointer is an indicator which simply draws arrows on a chart window when the value of RSI (from parameter RSI_Period) is below RSI_Level (green upward pointing arrow) or above 100-RSI_Level (red downward pointing arrow). RSI Pointer works on all timeframes and all currency pairs, commodities, indices, stocks etc. RSI Pointer has only two parameters, RSI_Period and RSI_Level . For example, if you set RSI_Period=7 and RSI_Level=20, the indicator will draw arrows for values below 20 (oversold)
CCI Pointer is an indicator which simply draws arrows on chart window when value of CCI (from parameter CCI_Period) is above CCI_Level (red downward pointing arrow) or below negative CCI_Level (green upward pointing arrow). CCI Pointer works on all timeframes and all currency pairs, commodities, indices, stocks etc. CCI Pointer has only two parameters, CCI_Period and CCI_Level . For example, if you set CCI_Period=25 and CCI_Level=200 indicator will draw arrows for values below -200 (oversold) an
ADX Pointer is an indicator which is based on "Average Directional Index" and draws three numbers in chart window depending on the value of ADX. In ADX Pointer you can set "ADX_Period" which is of course period of Average Directional Index and you can also set 3 levels. When ADX value exceed first level ("ADX_Level1") in chart window appears number "1", when ADX exceed second level ("ADX_Level2") appears "2" and when ADX exceed third level ("ADX_Level3") appears "3". Simple. ADX Pointer works on
Spread Display is a simple but very helpful indicator allowing live monitoring of spread in chart window. Using this indicator, there's no need to distract attention never again, seeking current spread value somewhere else. From now on, everything is clear and at the height of your eyes, in chart window of selected currency pair. Indicator has many settings. We can choose any font we want and we can set 3 spread levels ( Spread_Level_1 , Spread_Level_2 and Spread_Level_3 ) between which will cha
Volume Volatility is an indicator which analyzes currency pairs, indices, commodities etc. in terms of extremely high and extremely low accumulation to distribution ratio in comparison to values from past. The most important parameter is "Volume Volatility Factor" - this parameter, in big simplification, determines how far distance in the past is analyzed. The lower value of the parameter, the indicator analyzes less data from the past. I recommend you to set and test e.g. 3, 5, 15, 35, and 48 w
RSI Breakout Dashboard  is a tool for multiple currency pairs analysis at the same time in terms of  breakout  (return) from  Oversold  or  Overbought  Zone to  Neutral  Zone. All displayed and used by indicator symbols are free to choose  and are specified using a space separated list in parameters, so you're able to analyze not only predetermined ones, but everything that your broker offers, also commodities, equities, indices, ones with prefixes, suffixes etc. You can choose 3 types of al
MFI Breakout Dashboard is a tool for multiple currency pairs analysis at the same time in terms of breakout from Oversold or Overbought Zone . Money Flow Index (MFI) uses both price and volume to measure buying and selling pressure. MFI is also known as volume-weighted RSI (Relative Strength Index). The number of displayed symbols is 30 and the name of each symbol can be edited in the parameters. The analyzer is perfect for alert notifications, push notifications and email alerts. We can also se
MFI Extremes Dashboard is a great tool for quickest possible analysis of multiple currency pairs in terms of Oversold or Overbought at the same time. Money Flow Index (MFI) uses both price and volume to measure buying and selling pressure. MFI is also known as volume-weighted RSI (Relative Strength Index). The number of displayed symbols is 30 and the name of each symbol can be edited in the parameters, so we are able to analyze not only predetermined currency pairs, but also other ones, commodi
Closing Orders At Specified Time is a utility which helps you to close opened orders and delete pending orders at a specified time - especially when you cannot be online and do it by yourself at that time. You can schedule a specific time for closing orders, and additionally you can choose what type of orders should be closed (all, only opened or only pending), what symbols (all or you can enter names of three symbols) and with what Magic Number. You can also select to close only profitable or o
フィルタ:
Евгения Тонких
425
Евгения Тонких 2023.06.02 19:52 
 

отличный инструмент. Не хватает подложки под инфо панель

Yongqiang Chao
422
Yongqiang Chao 2018.09.03 07:08 
 

手动好工具!用来提醒。~

Mark Vaines
1821
Mark Vaines 2018.03.12 15:22 
 

great!!!!!

aodthth
426
aodthth 2018.02.18 16:06 
 

excellent tool for trading

loginuras
915
loginuras 2017.11.10 23:36 
 

Nice update! Works great.

khanet Kitpawongchanok
408
khanet Kitpawongchanok 2016.08.04 07:10 
 

เป็นเครื่องมือที่ดีมาก

khoopla
22
khoopla 2016.07.29 18:09 
 

ユーザーは評価に対して何もコメントを残しませんでした

bighead1971
2360
bighead1971 2016.03.29 06:50 
 

Very good dashboard. An EA will be perfect

レビューに返信
バージョン 7.0 2020.07.03
Added an option to make screenshots of charts with chosen pairs and timeframes where specified conditions are met. Screenshots are stored locally and template for them can be also freely chosen. There is also an option to turn on the arrow on screenshots showing the expected direction of price after getting out of the Overbought or Oversold zone.
バージョン 6.0 2020.06.22
Added an option to select on/off each one timeframe from all timeframes available in MT4, from M1 to MN. Selected timeframes are visible and used by indicator for alerts etc. Unused timeframes are hidden and inactive.

Changed the method of entering symbols in the form of a convenient list. Only entered symbols (and available on active account) are visible and used. Anything that is not on the list or is on the list, but doesn't exist on an account is automatically excluded from the list of visible symbols on dashboard.

Added parameter "RSI Applied Price" to choose desired price base for RSI calculations (all possible methods are available, i.e. Close Price, Open Price, Maximum and Minimum Price for the period, Median, Typical and Average Price).

Added an option to free choose preferred 3 lower and 3 higher timeframes for sending alerts if conditions on all selected timeframes are met. In each case, all timeframes from M1 to MN (and also Current) are available to choose.

Added possibility to change all font sizes and to set spacing in pixels between columns and rows.
バージョン 5.0 2016.04.12
1. The number of displayed symbols is 30 and the name of each symbol can be edited in the parameters.
2. Every color in dashboard is modifiable.
3. Added possibility to adding comments to every type of alert.
4. Simplification in naming of parameters and description.
5. Code optimized.
バージョン 4.0 2016.04.07
1. The possibility of setting two unrelated to each other RSI Levels ( "RSI_Low_Level" and "RSI_High_Level" - default: 30 and 70). Information about the both two levels is displayed in the header of the dashboard.

2. Added information in header of dashboard whether we use only closed bars or current bars to trigger the alerts.

3. Possibility of adding two comments to email alerts that work in two cases. "Oversold_Coment" works in the case of RSI oversold (RSI value lower than "RSI_Low_Level" - default comment: "BUY") and "Overbought_Comment" works in the case of RSI overbought (RSI value higher than "RSI_High_Level" - default comment: "SELL"). Comments in email alerts are embedded between timeframe and RSI period.

4. The possibility to choose whether the whole text of alert is in the body or in the subject of email messages ("Alert_On_Email_Subject", default alert text is in the body of email message).
バージョン 3.0 2016.03.17
1. Added possibility to set "Only_Closed_Bars" - if set to "True" alerts come only from closed candles. Of course, if set to "False" - alerts come immediately from current candles (as so far).

2. Added missing currency pairs.
バージョン 2.0 2016.01.05
1. Added alerts from combined timeframes (with coincident conditions):
a) M5 + M15 + M30 ("Lower_3_TFs"),
b) H1 + H4 + D1 ("Higher_3_TFs"),
c) M5 + M15 + M30 + H1 + H4 + D1 ("ALL_TFs").

2. Added title above dashboard with visible actual parameters "RSI Period" and "RSI Level".

3. Optimized the code.