MT4 Bar Replay Indicator
- インディケータ
- Hong Jun Dai
- バージョン: 1.3
- アップデート済み: 27 5月 2024
Free for a limited time! It may be terminated at any time, please seize the opportunity
If you think the indicator is useful, you can give me 5 stars!
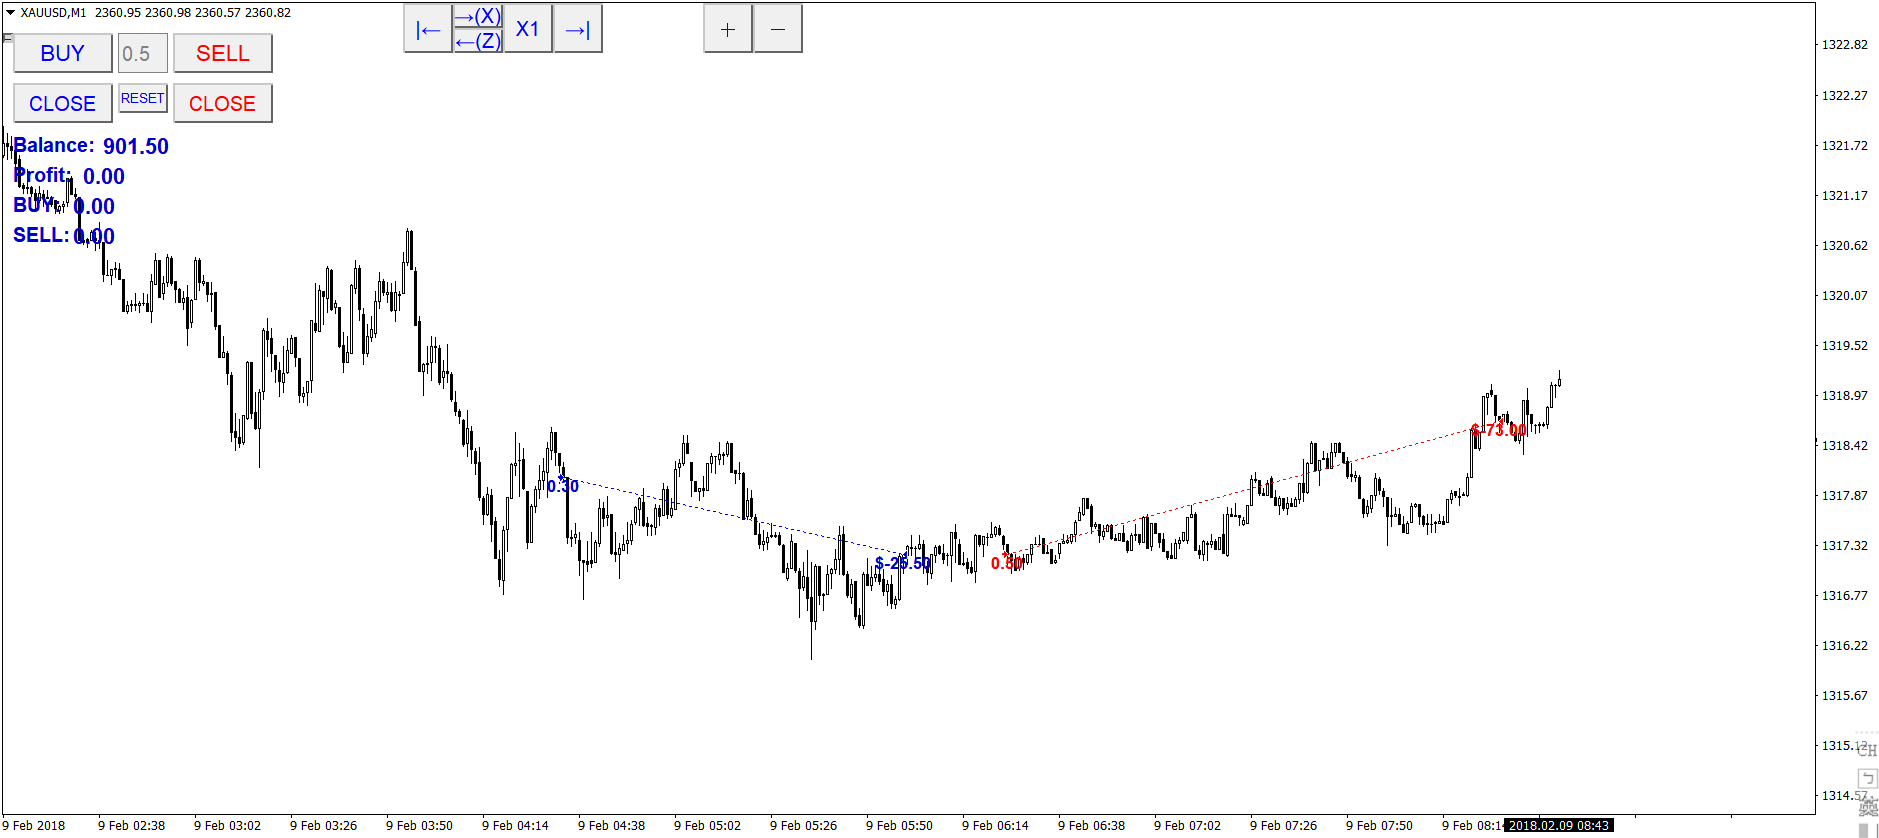
This indicator is not an EA,so it does not have the 'ORDER' function. It only simulates placing orders, so please use it with confidence.
→|:Back to current time.
Note: If you pull too far forward in the big period, Bar in the small period may not read that far forward.
At this time, you must first reduce the picture to the minimum, then press and hold the 'PAGE UP' key on the keyboard, and first read the Bar in the hour area.
But be aware that some of the broker’s period cannot be read too far!
This tool allows you to add the indicators and tools you need, which is very convenient!
All functions are consistent with the functions of a certain T website
You can also compress the chart price on the right, and click twice to restore the original Bar ratio.
But a certain T website cannot read as far back in time as this tool!
If your MT4 can go as far as 2004
Then you can review the market situation in 2004!
Indicator is garbage. I have installed it onto my platform and immediately my entire MT4 freezes. I have tried to hit the button to start it but it is not working. I would not buy in its current state.