• 概要
  • レビュー
  • コメント
  • 最新情報

BBMA Structure Guide

タイトル: BBMA 構造ガイド - BBMA 構造ガイド

説明:
BBMA 構造ガイドは、BBMA 構造の進化をより簡単かつ効率的に理解するのに役立つ特別な MQL4 インジケーターです。BBMA、または「Bollinger Bands Moving Average」は、「一歩先を行く」というモットーで知られており、市場構造を深く理解することの重要性を強調しています。

BBMA 構造ガイドを使用すると、価格変動の基本的な市場構造パターンを迅速に識別できます。これにより、より正確かつ効果的な取引の決定が可能になります。このインジケーターは情報を明確で直感的に表示し、次の取引ステップをより自信を持って進むことができます。

主な特徴:
- **深い理解:** BBMA 構造ガイドは、市場構造を明確に示し、市場のダイナミクスをより良く理解できます。
- **使いやすさ:** 直感的なインターフェイスで設計されており、すべての経験レベルのトレーダーが簡単に使用できます。
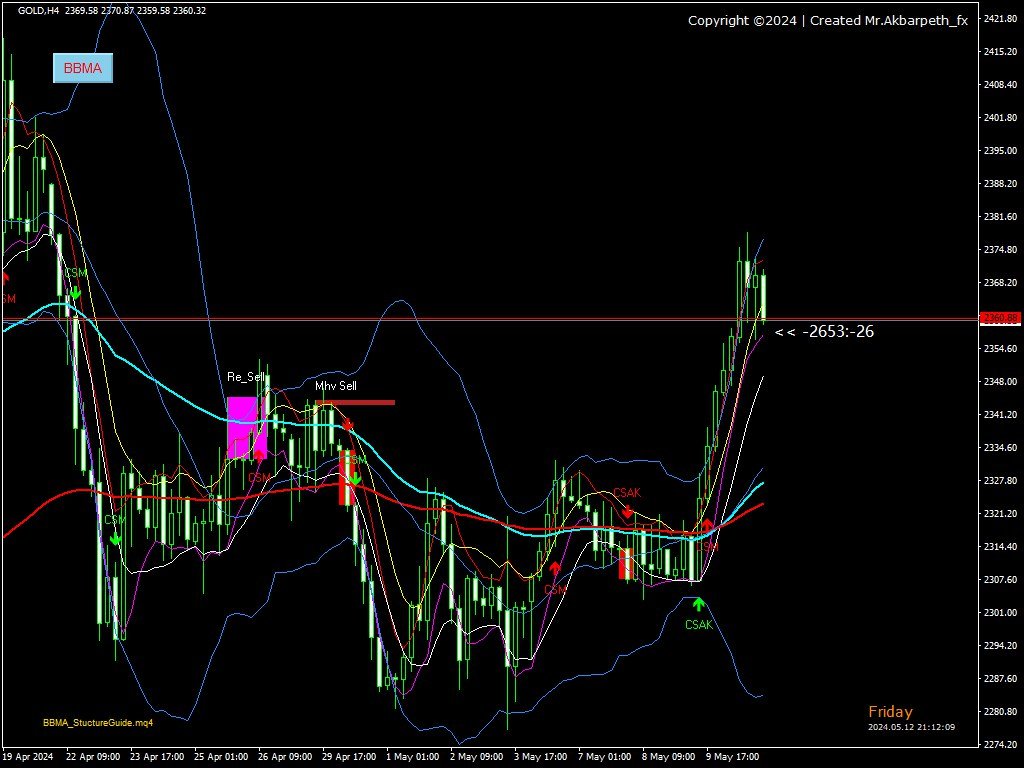
- **強力なシグナル:** このインジケーターは、**CSAK**(キャンドルスティックの強力な方向)や **MHV**(市場の取引量喪失)など、BBMA システムで重要なシグナルを提供します。 **CSAK** シグナルは、方向性の強いキャンドルスティックの存在を示し、**MHV** シグナルは市場が取引量を失っていることを示します。

取引セットアップ:
BBMA 構造ガイドには、**MHV セットアップ**(市場の取引量喪失)や **再エントリー** など、2つの重要な取引セットアップがあります。MHV セットアップは、市場が取引量を喪失し、不安定な市場状況を示します。一方、再エントリーは価格の修正後に市場に再び参入するのを支援するセットアップです。

更新:
私たちは BBMA 構造ガイドを市場の変化に常に適応させるために努力しています。最新の機能や必要な改善を含む最新バージョンでこのインジケーターを定期的に更新します。

BBMA 構造ガイドが提供するシグナルとセットアップを使用すると、即時の利益を約束することなく、過剰な主張を行うことなく、潜在的な取引機会を特定できます。このインジケーターを今すぐ入手し、取引で「一歩先を行く」ことができます。
おすすめのプロダクト
Considering the main theories of Forex (Dow Theory, support lines, chart patterns, and Fibonacci retracements), It tells you the price range where whales (large investors) are likely to appear. You can trade at the price points that professionals also aim for. You no longer have to warry about where to aim next. We are live-streaming the actual operation of the system. Please check for yourself if it is usable. Please check it out for yourself. https://www.youtube.com/@ganesha_forex We do no
Introducing the Donchian Channels indicator for MQL4, a powerful technical analysis tool designed to boost your trading success. This indicator consists of four lines that represent the upper and lower boundaries of price movement over a specified period. With the Donchian Channels indicator, you can easily identify potential breakouts and reversals in the market. The upper line shows the highest high of the specified period, while the lower line represents the lowest low. The space between thes
「一目均衡表」の専門的な使い方は、一目均衡表を正しく解釈してグラフを分析することです! はトレーダーが価格グラフ上の指定された点間の比率を素早く簡 単に測定できるようにするグラフィックプログラムです。この時間と価格の指標は、MT4 プラットフォームの一目の戦略に従って図表を分析するための基本的なツールです。この ツールを使用すると、 非常に短期間での価格波だけでなく、時間波の洞察に満ちた完全な 分析も可能になります。分析の実行に費やされる労力は、エクセルを使用して実行される 同様の測定および計算と比較して、何度も最小限に抑えられます。指標は、一目均衡表戦 略を使用するトレーダーの知識と経験、およびそれらの期待を考慮して設計されています。 提示されたツールは私たちの仕事の結果です。 指標のモジュール構造により、論理的な順序で分析を実行できます。このプロセスは過去 の波に関するデータを収集することから始まり、それが将来の市場の動きを計算するため の基礎となります。 計算で考慮されるデータは、予測の正確さにとって非常に重要です。 この操作は最小限に抑えられ、即座に測定値が得られます。 この測
with JR Trend you will able to enter and exit every trade with just a signals appear no need for any strategy just flow the indicator it work on all pairs and all Timeframe i usually take a look on higher timeframe and return to the lowest  timeframe and make an order with indicator signals you can see the amazing result so you can depend only on it intraday or swing as you wish   
The indicator shows De Mark patterns and gives trading signals in the form of arrows and alerts. Shows De Mark lines on the history of quotes. Has a multiframe., Can show DeMark patterns of higher timeframes on lower timeframes. Has a switchable function for displaying fractals. Trading signals are accompanied by sound alerts, as well as sending them to mail and mobile devices.
Market Structure Break Out for MT4をご紹介します – あなたのプロフェッショナルなMSBおよび不破のゾーンインジケータ  mql5コミュニティの  Koala Trading Solution Channel  に参加して、Koalaのすべての製品に関する最新情報を入手しましょう。参加リンクはこちら: https://www.mql5.com/en/channels/koalatradingsolution Market Structure Break Out: 市場の波に対する純粋な分析の方法 このインジケータは市場の構造と動きの波を描画し、最適なMSBまたは市場構造のブレイクアウトを見つけるために設計されています。市場が動き、最近の構造を破ると、そのブレイクアウトの要因がどれくらい重要かを判断し、特定の要因よりも大きい場合、そのブレイクアウトは確認されたものと見なすことができます。このツールでは4つの重要なケースがあります:  市場構造の波  確認された構造のブレイクアウト、および  未破壊のサプライとデマンドゾーン。 再タッチおよび再確認
Trend New Trend Indicator, shows the signals for entry. Displays both entry points and the trend itself. Shows statistically calculated moments for entering the market with arrows. When using the indicator, it is possible to optimally distribute the risk factor. Settings: Uses all one parameter for settings. Selecting a parameter, it is necessary to visually resemble it so that the appropriate graph has a projection of extremes. Options: Length - the number of bars for calculating the ind
Chart Projection
Lorentzos Roussos
4.61 (57)
チャート投影インジケーター チャンネルに参加し 、レビューを書き、YouTube でチャンネル登録し 、動画を高く評価してください。ありがとう チャートの予測は、組み込みのジグザグテクニカルインジケーターを使用して将来の価格アクションを予測する小さなインジケーターとして始まりました(古いアルゴリズムはコメントで見つけることができます) アイデアは単純で、 過去の価格行動は未来に変換されませんが、過度に具体的、または過度に一般的でない場合は、何が起こる可能性があるかについてのガイドラインを抽出できます。 チャート投影の「論文」はこれです: トレーダーはチャートを見て決定を下すので、アルゴリズムはチャートも見ることができます。指標値を読み取らない、価格を読み取らないが、チャートを見る 何かを探すことは、繰り返しのなじみのあるパターンを見つけることです。そして、そのなじみのあるパターンを見つけるためには、それを保存する必要があります。 ジグザグはそれだけでは不十分であり、それを実行し、チャートの視覚的側面に関するデータを保持する新しいアルゴリズムが必要でした。したがって、光学ア
FREE
Introduction  The Commodity Channel Index, commonly known as the CCI, is a versatile indicator used by traders and investors to identify cyclical trends in commodities, stocks, and other securities. It was developed by Donald Lambert in 1980, primarily for commodity trading, but has since found widespread application in various financial markets. The CCI is particularly favored for its ability to gauge overbought and oversold levels in price movements. Historical Background  Donald Lambert, the
If you wish to draw Support and Resistance lines, view: daily market opening, classical pivot levels, Fibonacci pivot levels, trend lines, Fibonacci levels, the remaining time to candle closing, and current spread. If you seek to place your orders with the exact lot that meets your desired stop loss risk. If you wish to do all this and more with just one click, then this is the perfect tool to use. This tool will allow you to feel more relaxed when deciding to open orders, as well as predicting
Intro to APAMI, PROfessional edition Trace exactly how far prices trend between two price levels with fractional pip precision, while qualifying price movement between the same price levels. Completely automate when trends change direction and volatility, without any lag .  This is possible because the Accurate Price Action Measurement Indicator (APAMI) actually does what no other indicator can:  measure price distance between two points and simultaneously qualify the price action that occurs
F ully automated Expert Advisor using the  advanced   algorithm for trading the EURUSD Designed for profit in a short period of time and big profit in a long run. Prefers EURUSD 1H. Principle of operation The SELL and BUY orders are opened (depending on the parameters set), guided by signals and the market situation.     Recommended parameter: Use an ECN broker account. minimum deposit of 100$ USD. use it in H1 time frame recommended symbol is EURUSD input parameter: TrendType               
Algo Trading Indicaor  With this indicator , you’ll have zones and trends that hight probability the price will reverse from it. so will gives you all the help that you need  Why should you join us !?  1-This indicator is logical since it’s working in previous days movement , to predict the future movements. 2-Algo trading indicator will help you to draw trends which is special and are too strong than the basics trend , trends will change with the frame time that you work on . 3-We can
マーチンゲールアローは、マーチンゲールバイナリーオプション取引用に設計された矢印タイプのMT4インジケーターで、この矢印はバーオープン/バー内に印刷され、アラートを与えます。 使用方法: 矢印が表示された瞬間に取引を開始し、取引が勝った場合は次のシグナルを待って同じロットを取引します。次のシグナルでトレードがダブルロットを失い、シグナルが勝つまでそれを続けた場合、リセットして最初のトレードロットでトレードします。 推奨される期間 : 任意 最低入金額: 200 ユニット。 このインジケーターはライブでは再ペイント/バックペイントを行いません。 -------------------------------------------------- ------------- パラメーター : インジケーター期間: これを変更すると、異なるシグナルが表示されます。 インジケーターの価格/種類 買われすぎ/売られすぎレベル アラート入力 矢印スタイル ========================================
This Expert uses multiple indicators and special algorithm to choose the entry points and provide the maximum Gain with the minimum Risk . Run the BackTest and check the efficienty of the product. Working Conditions : This EA works on all Pairs on 15M Timeframe. With 1000 $ Balance Input Parameters : Trading Mode : Choose between 3 modes. AutoManagement : The lot will increase with the increasing of the balance. Trading Lot : The Lot is set manually. Take Profit : Set it by points.
The Find Levels utility scans the range of prices and bars indicated by you on the chart, finds the levels most often related to High and Low prices and provides a full report. The color of the level line depends on the number of touches and changes in the program settings. The level is drawn in the event that if the shadow of the High or Low candle was at least two touches during the period specified in the parameters. The characteristics of the candle, namely, what should be its parameters for
Supply and Demand Indicator + FREE Currency Strength Meter ADD-ON Looking for a powerful tool that can help you identify the most reactive zones in the forex market? Our supply and demand indicator for MetaTrader 4 and 5 is exactly what you need. With its advanced algorithms and real-time analysis, this indicator helps traders of all experience levels make informed trading decisions. The supply and demand indicator is a cutting-edge tool that helps traders identify areas where buyers and seller
Kaka Kaki EurUsd Pro Scalp: Introducing   Kaka Kaki EurUsd Pro Scalp , the cutting-edge solution in low-risk automated trading. Unlike conventional systems that tailor strategies to historical data, Kaka Kaki EurUsd Pro Scalp is meticulously crafted to operate on low-risk settings. This distinguishes it from the commonplace "take and throw" systems reliant on simple lot size with grids optional for survival. This EA offers a unique approach, prioritizing risk management and ensuring a sophistica
GRUPO TELEGRAM https://t.me/QUANTSROBOFX TELEGRAM =   @QUANTSROBOFX Robô Quantum fx  MULTI- ESTRATÉGIAS MEU ROBÔ DE 10 ANOS À SUA DISPOSIÇÃO Teste GRÁTIS em conta Demo Instale no seu MT4 (use sempre uma VPS) ️ Recomendações de uso: √ Conta STANDARD com saldo a partir de 1k USD, use lote 0.01 pra cada 1k. √ Conta CENTS com saldo a partir de 10.000 USD, use lote 0.10 pra cada 10.000. √ Timeframe indicado H1 ou H4 Arraste para o gráfico e coloque o t
TREND HARMONY MT4 –  Multi Timeframe Trend and Phase and Pullback Level Visualizer indicator for Metatrader4 The TREND HARMONY indicator automates deep trend analysis and generates visualizations for you. Take control of your trades by eliminating uncertainty! Revolutionize your trading experience with precision and insight through the TREND HARMONY Multi Timeframe Trend Indicator – your ultimate MT4 trend visualization indicator. Are you tired of missing trading opportunities or consistently e
The arrow indicator for Forex and Binary options is based on tick volumes. Unlike many volume indicators, the "Super volumes" indicator calculates bullish and bearish volumes and gives signals based on the predominance of any of them. If, say, there was an advantage of bullish volumes in this range at the moment, then the signal will be on Buy. Or if the predominance was bearish volumes, then, accordingly, the signal will be on Sell. In the indicator settings in the "volumes" variable, you ca
This is an original, agile, and excellent trending system. Whether you are a beginner trading novice or a professional trader, this set of indicators can help you quickly and timely track the latest changes in market trends. It has the following characteristics: The method of use is extremely simple, plug and play, and the display of all trend analysis results is clear at a glance; There is no need to configure any functional parameters, the trend tracking indicator will automatically analyze th
Thư viện này bao gồm: * Mã nguồn struct của 5 cấu trúc cơ bản của MQL4: + SYMBOL INFO + TICK INFO + ACCOUNT INFO * Các hàm cơ bản của một robot + OrderSend + OrderModify + OrderClose * String Error Runtime Return * Hàm kiểm tra bản quyền của robot, indicator, script * Hàm init dùng để khởi động một robot chuẩn * Hàm định dạng chart để không bị các lỗi nghẽn bộ nhớ của chart khi chạy trên VPS * Hàm ghi dữ liệu ra file CSV, TXT * Hỗ trợ (mã nguồn, *.mqh): dat.ngtat@gmail.com
Summary This indicator is based on RSI and Momentum indicators. It also considers moving averages of these two indicators. The three indicators have adjustable settings. The arrows do not repaint since the indicator only uses confirmed values and waits for the candle to close before painting an arrow. The indicator is also able to alert when arrows appear. There are 3 types of alerts - Popup, Email and Mobile Push Notifications. The arrows can be used in the EA and the inputs can also be optimiz
FREE
This indicator is named so for a reason, because it will show the reverse side of the market. It has several math indicators built in that are tuned to show the best signals for currency pairs! Ideally proved to be in work on the M5-M15 no more and no less! Only at the same time it shows up to 86.5% of correct signals! The settings include the colors of the arrows, the alert, and the same parameters so that you can reconfigure the indicator and trade on cryptocurrency and raw materials!
Dear Trader It is my pleasure to introduce to you my tool called the " Forex Sniper Indicator" . The major aim of this tool is to help serious traders and investors in all type of Financial Markets to catch price next movement right at the moment the price direction is about to change. This tool can be used to snipe the price direction in both down trend, uptrend and ranging markets. This tool can be used as the stand alone tool though it may be combined with other tools as well. My goal is to h
Holy Trinity Volatility Indicator This indicator reflects the peak time of the day wherein there's is expected to be sharp price actions. It also presents the markets as just waking up from the dull and less volatile Asian (and or London) trading sessions into a bustling time of highly liquid price flows. NOTE: This indicator informs the trader ahead of peak price movements - one bar just before the real actions starts. Enter when the volatility line falls below the Tripple Exponential Moving Av
This EA using linear regression strategy, EA can identify key price points—entry price, stop-loss price, and exit prices. Price and time period determine the system parameters for linear regression, making the method universally applicable. Linear regression is the analysis of two separate variables to define a single relationship and is a useful measure for technical and quantitative analysis in financial markets.  Requirements and Recommendations EA   specifically for the USDJPY pair on the H4
The EA is based on trend trading strategy . Mechanism " trend trading strategy " is a tendency of a financial market price to move in a particular direction over time. If there is a turn contrary to the trend, This mechanism will exit and wait until the turn establishes itself as a trend in the opposite direction, and re-enter when the trend re-establishes. This EA has been back tested for 4 years of real tick data (2019-2022), consistent with the latest trading accounts. Immortal MT4:   https:
The Nihilist 5.0 Indicator includes Forexalien and Nihilist Easy Trend trading strategies and systems. It is composed of an MTF Dashboard where you can analyze the different input possibilities of each strategy at a glance. It has an alert system with different types of configurable filters. You can also configure which TF you want to be notified on your Metatrader 4 platform and Mobile application The indicator has the option to view how could be a TP and SL by using ATR or fixed points, even
このプロダクトを購入した人は以下も購入しています
現在26%オフ 初心者やエキスパートトレーダーに最適なソリューション! このインジケーターは、独自の機能と新しい計算式を取り入れた、ユニークで高品質、かつ手頃な価格のトレーディングツールです。たった1枚のチャートで28の為替ペアの通貨強度を読み取ることができます。新しいトレンドやスキャルピングチャンスの引き金となるポイントを正確に特定することができるので、あなたのトレードがどのように改善されるか想像してみてください。 ユーザーマニュアルはこちら  https://www.mql5.com/en/blogs/post/697384 これが最初の1本、オリジナルだ! 価値のないクローンを買わないでください。 特別な サブウィンドウの矢印で強い通貨の勢いを表示 GAPがあなたのトレードを導く! 基準通貨や気配値が売られすぎ・買われすぎのゾーン(外相フィボナッチレベル)にあるとき、個別チャートのメインウィンドウに警告表示。 通貨がレンジの外側から反落した場合、プルバック/リバーサルのアラート。 クロスパターンの特別なアラート 複数の時間枠を選択可能で、トレンドを素早く
74% discount for the next 10 buyers (original price $605): 1 left Get a 50% bonus by buying (or even renting) any of our products. After buying (or renting), send a message for more information. 3 Indicators in 1 indicator Strategy based on price action Made specifically for the best forex currency pairs Can be used in the best time frame of the market at a very reasonable price This indicator is basically 3 different indicatos . But we have combined these 3 indicators in 1 indicator so th
まず第一に、この取引インジケーターは再描画されず、再描画されず、遅延しないことを強調する価値があります。これにより、手動取引とロボット取引の両方に理想的なものになります。 ユーザーマニュアル:設定、入力、戦略。 アトミックアナリストは、価格の強さとモメンタムを利用して市場でより良いエッジを見つけるためのPA価格アクションインジケーターです。ノイズや誤ったシグナルを除去し、取引ポテンシャルを高めるための高度なフィルターを備えています。複雑なインジケーターの複数のレイヤーを使用して、アトミックアナリストはチャートをスキャンし、複雑な数学的計算をシンプルなシグナルと色に変換します。これにより、どのような初心者トレーダーでも理解して使用し、一貫した取引の決定を行うことができます。 「アトミックアナリスト」は、新規および経験豊富なトレーダー向けにカスタマイズされた包括的な取引ソリューションです。プレミアムインジケーターとトップノッチの機能を1つの取引戦略に組み合わせ、すべてのタイプのトレーダーにとって汎用性のある選択肢にします。 デイリートレーディングとスキャルピング戦略:高
A key element in trading is zones or levels from which decisions to buy or sell a trading instrument are made. Despite attempts by major players to conceal their presence in the market, they inevitably leave traces. Our task was to learn how to identify these traces and interpret them correctly. Reversal First Impulse levels (RFI)   -  Version MT5                INSTRUCTIONS                 RUS                 ENG                                       R ecommended to use with an indicator   -  
TPSpro TRENDPRO  - is a trend indicator that automatically analyzes the market and provides information about the trend and each of its changes, as well as giving signals for entering trades without redrawing! The indicator uses each candle, analyzing them separately. referring to different impulses - up or down impulse. Exact entry points into transactions for currencies, crypto, metals, stocks, indices!  -  Version MT5               DETAILED DESCRIPTION        /       TRADING SETUPS           
ご紹介   クォンタム トレンド スナイパー インジケーターは 、トレンド反転を特定して取引する方法を変革する画期的な MQL5 インジケーターです。 13年以上の取引経験を持つ経験豊富なトレーダーのチームによって開発されました。     クォンタムトレンドスナイパーインジケーター   は、非常に高い精度でトレンドの反転を識別する革新的な方法で、あなたのトレーディングの旅を新たな高みに押し上げるように設計されています。 ***Quantum Trend Sniper Indicatorを購入すると、Quantum Breakout Indicatorを無料で入手できます!*** クォンタム ブレイクアウト インジケーターは、トレンドの反転を特定するとアラートを発し、矢印を示し、3 つのテイクプロフィットレベルを提案します。 初心者トレーダーにもプロのトレーダーにも適しています。 量子EAチャネル:       ここをクリック MT5のバージョン:       ここをクリック 推奨事項: 期間: すべての時間枠。最良の結果を得るには、
An exclusive indicator that utilizes an innovative algorithm to swiftly and accurately determine the market trend. The indicator automatically calculates opening, closing, and profit levels, providing detailed trading statistics. With these features, you can choose the most appropriate trading instrument for the current market conditions. Additionally, you can easily integrate your own arrow indicators into Scalper Inside Pro to quickly evaluate their statistics and profitability. Scalper Inside
FX Volume
Daniel Stein
4.6 (35)
mql5と Telegramの モーニング・ブリーフィングで、詳細とスクリーンショットを含む毎日のマーケット・アップデートをご覧 ください! FX Volumeは、ブローカーの視点から市場のセンチメントをリアルに洞察する、最初で唯一の出来高インジケーターです。 ブローカーのような機関投資家が外国為替市場でどのようなポジションをとっているか、COTレポートよりもはるかに速く、素晴らしい洞察を提供します。 この情報をチャート上で直接見ることは、あなたの取引にとって真のゲームチェンジャーであり、画期的なソリューションです。 以下のようなユニークなマーケットデータ洞察から利益を得てください。 比率は 、通貨のロングポジションとショートポジションの比率をパーセントで表示します。 比率の変化は 、選択した期間内のロング比率とその変化率を表示します。 Volumes Totalは 、通貨の取引量(ロングとショート)の合計をロット単位で表示します。 Volumes Long :全通貨のロングポジションの取引量を表示します。 Volumes(ショート )は、全通貨のショートポジションの取引量を表示
Advanced Supply Demand
Bernhard Schweigert
4.92 (310)
現在33%オフ 初心者にもエキスパートトレーダーにも最適なソリューション このインジケーターは独自の機能と新しい公式を多数内蔵しており、ユニークで高品質かつ手頃な取引ツールです。このアップデートでは、2つの時間枠ゾーンを表示できるようになります。より長いTFだけでなく、チャートTFとより長いTF(ネストゾーンを表示)の両方を表示できます。すべてのSupply Demandトレーダーの皆さんのお気に召すはずです。:) 重要情報の公開 Advanced Supply Demandの可能性を最大化するには、 https://www.mql5.com/ja/blogs/post/720245 にアクセスしてください。   エントリーまたはターゲットの正確なトリガーポイントを正確に特定できれば取引がどのように改善されるか想像してみてください。新しい基盤となるアルゴリズムに基づいて構築されているため、買い手と売り手の間の潜在的な不均衡をさらに簡単に特定できます。これは、最も強い需要と供給のゾーンと、過去のパフォーマンス(古いゾーンを表示)がグラフィカルに表現されるためです。これらの機能は、最適
ご紹介     Quantum Breakout PRO は 、ブレイクアウト ゾーンの取引方法を変革する画期的な MQL5 インジケーターです。 13年以上の取引経験を持つ経験豊富なトレーダーのチームによって開発された Quantum Breakout PROは 、革新的でダイナミックなブレイクアウトゾーン戦略により、あなたの取引の旅を新たな高みに押し上げるように設計されています。 クォンタム ブレイクアウト インジケーターは、5 つの利益ターゲット ゾーンを備えたブレイクアウト ゾーン上のシグナル矢印と、ブレイクアウト ボックスに基づいたストップロスの提案を提供します。 初心者トレーダーにもプロのトレーダーにも適しています。 量子EAチャネル:       ここをクリック MT5バージョン:   ここをクリック 重要!購入後、インストールマニュアルを受け取るためにプライベートメッセージを送ってください。 推奨事項: 時間枠: M15 通貨ペア: GBPJPY、EURJPY、USDJPY、NZDUSD、XAUUSD アカウントの種類: ECN、Raw、また
mql5と Telegramの モーニング・ブリーフィングで、詳細とスクリーンショットを含む毎日のマーケット・アップデートをご覧 ください! FX Power MT4 NGは 、長年の人気を誇る通貨強度計FX Powerの次世代モデルです。 この次世代ストレングスメーターは何を提供するのでしょうか?初代FXパワーの魅力すべて プラス GOLD/XAUの強さ分析 より正確な計算結果 個別に設定可能な分析期間 カスタマイズ可能な計算上限値により、さらに優れたパフォーマンスを実現 もっと見たい人のための特別なマルチインスタンス設定 すべてのチャートでお好みの色を無限に設定可能 数え切れないほどの通知オプションにより、重要なことを見逃すことはありません。 Windows 11とmacOSのスタイルで角を丸くした新しいデザイン 魔法のように動くインジケーターパネル FXパワーの主な機能 すべての主要通貨の強さの完全な履歴 すべての時間枠における通貨の強さの履歴 すべてのブローカーとチャートで同一の計算結果 100%信頼できるリアルタイム計算 -> リペイントなし ドロップダウン・リストから
現在20%OFF! 初心者やエキスパートトレーダーのためのベストソリューション! このダッシュボードソフトウェアは、28の通貨ペアで動作しています。それは私達の主要な指標(高度な通貨の強さ28と高度な通貨インパルス)の2に基づいています。それは全体の外国為替市場の大きい概観を与えます。それは、すべての(9)時間枠で28の外国為替ペアのための高度な通貨の強さの値、通貨の動きの速度と信号を示しています。チャート上で1つのインディケータを使用して市場全体を観察し、トレンドやスキャルピングの機会をピンポイントで見つけることができたら、あなたのトレードがどのように改善されるか想像してみてください。 このインディケータには、強い通貨と弱い通貨の識別、潜在的な取引の識別と確認がより簡単になるような機能が搭載されています。このインディケータは、通貨の強さや弱さが増加しているか減少しているか、また、すべての時間枠でどのように機能しているかをグラフィカルに表示します。 新機能として、現在の市場環境の変化に適応するダイナミックなマーケットフィボナッチレベルが追加され、すでに当社のAdvan
このインディケータは、当社の2つの製品 Advanced Currency IMPULSE with ALERT  +   Currency Strength Exotics . のスーパーコンビネーションです。 このインジケーターは全ての時間枠で作動し、8つの主要通貨と1つのシンボルの強弱のインパルスをグラフで表示します。 このインジケータは、金、エキゾチックペア、商品、インデックス、先物など、あらゆるシンボルの通貨強度の加速度を表示することに特化されています。金、銀、原油、DAX、US30、MXN、TRY、CNHなどの通貨強度の加速度(インパルスまたは速度)を表示するために、任意のシンボルを9行目に追加できる、この種の最初のものです。 新しいアルゴリズムに基づいて構築され、潜在的な取引の特定と確認がさらに容易になりました。これは、通貨の強さや弱さが加速しているかどうかをグラフィカルに表示し、その加速の速度を測定するためです。加速すると物事は明らかに速く進みますが、これはFX市場でも同じです。つまり、反対方向に加速している通貨をペアリングすれば、潜在的に利益を生む取
TrendMaestro
Stefano Frisetti
5 (2)
note: this indicator is for METATRADER4, if you want the version for METATRADER5 this is the link:  https://www.mql5.com/it/market/product/108106 TRENDMAESTRO ver 2.4 TRENDMAESTRO recognizes a new TREND in the bud, he never makes mistakes. The certainty of identifying a new TREND is priceless. DESCRIPTION TRENDMAESTRO identifies a new TREND in the bud, this indicator examines the volatility, volumes and momentum to identify the moment in which there is an explosion of one or more of these data a
Automated Trendlines
Georgios Kalomoiropoulos
5 (16)
トレンドラインは、外国為替取引におけるテクニカル分析の最も重要なツールです。残念ながら、ほとんどのトレーダーはそれらを正しく描画していません。自動トレンドラインインジケーターは、市場のトレンドの動きを視覚化するのに役立つ本格的なトレーダー向けのプロフェッショナルツールです。 トレンドラインには、強気トレンドラインと弱気トレンドラインの2種類があります。 上昇トレンドでは、外国為替トレンドラインは価格変動の最低スイングポイントを介して描画されます。 少なくとも2つの「最低安値」を接続すると、トレンドラインが作成されます。 下降トレンドでは、トレンドラインは価格変動の最も高いスイングポイントを介して描画されます。 少なくとも2つの「最高値」を接続すると、トレンドラインが作成されます。 トレンドラインが壊れたとき? 弱気のろうそくが強気のトレンドラインの下で閉じ、ろうそくの高さがトレンドラインの上にあるとき、強気のトレンドラインは壊れます。 強気のろうそくが弱気のトレンドラインの上で閉じ、ろうそくの安値がトレンドラインの下にあるとき、弱気のトレ
An extremely convenient indicator that truly makes the process of making money on the exchange easy. It is based on the scientifically rigorous theory of the market developed by the author, the beginning of which is presented here .                The full algorithm of this indicator operation is presented in the article .               The indicator calculates the most probable price movement trajectory and displays it on the chart. Based on the predicted price movement trajectory
もちろんです。以下は、提供いただいたテキストの日本語への翻訳です: MT4用の天文学指標をご紹介します:究極の天体トレーディングコンパニオン トレーディング体験を天空の高みに高める準備はできていますか?私たちの革命的なMT4用の天文学指標をご紹介します。この革新的なツールは、複雑なアルゴリズムの力を借りて、類まれなる天文学的洞察と精密な計算を提供します。 あなたの指先で宇宙の情報を: 宝のような天文学的データが明らかになる包括的なパネルをご覧ください。惑星の地理的/太陽中心座標、太陽と地球の距離、星の大きさ、伸び、星座、黄道座標および赤道座標、さらには水平座標まで、それぞれが綿密に計算され美しく表示されています。指標によって生成される垂直線は時間値に対応し、トレーディングの旅に宇宙の視点を提供します。 惑星のラインと関係: グラフを飾る惑星のラインの魔法を体験し、スケールと角度をカスタマイズできます。直感的なコントロールパネルを介して各惑星のラインの表示を簡単に切り替えることができます。指定された時刻範囲内での合会、六分会、四分会、三分会、対会、逆行の指標で天体の関係の芸術を発見してく
Allows multiple indicators to be combined into a single indicator, both visually and in terms of an alert. Indicators can include standard indicators, e.g. RSI, CCI, etc., and also Custom Indicators, even those purchased through Market, or where just have the ex4 file. An early alert is provided, say when 4 out 5 indicators have lined up, and a confirmed alert when all are in agreement. A‌lso features a statistics panel reporting the success of the combined indicator by examining the current cha
ON Trade Waves Patterns Harmonic Elliot Wolfeをご紹介します。これは手動および自動の方法を使用して市場のさまざまなパターンを検出するために設計された高度なインジケーターです。以下はその動作方法です: ハーモニックパターン: このインジケーターは、チャートに表示されるハーモニックパターンを識別できます。これらのパターンは、Scott Carneyの「Harmonic Trading vol 1および2」で説明されているように、ハーモニックトレーディング理論を実践するトレーダーにとって重要です。手動で描画するか、自動検出に頼るかにかかわらず、ON Trade Waves Patternsがお手伝いします。 コントロールパネル: このインジケーターはユーザーフレンドリーなコントロールパネルを備えています。チャートと時間枠の設定を保存し、異なる構成間をスムーズに切り替えることができます。チャートスペースを最大限に活用するために最小化することもできます。他の分析ツールで作業することを好む場合、閉じるボタンをクリックするだけで、すべてのインジケーターデ
MetaTrend M4
Vahidreza Heidar Gholami
5 (1)
Meta Trend Indicator is an efficient way to forecast and detect the trend in any market. It reveals the trend, support and resistance levels, volatility and the maximum potential target, all in one indicator. To adapt to the price and to decrease consecutive trend failures, the internal trend detector algorithm studies the market and dynamically chooses the right values for the internal parameters. This indicator is a perfect trend filter for any strategy or expert advisor. Features Super Adapti
Gold Trend   - これは優れた株価テクニカル指標です。指標のアルゴリズムは、資産の値動きを分析し、ボラティリティと潜在的なエントリーゾーンを反映しています。 最高の指標シグナル: - 売りの場合 = 赤のヒストグラム + 赤のショートポインター + 同じ方向に黄色のシグナル矢印。 - 買いの場合 = 青のヒストグラム + 青のロングポインター + 同じ方向の水色のシグナル矢印。 インジケータの利点 1. このインディケータは、高い精度でシグナルを発信します。 2. 確定した矢印シグナルは、トレンドが変化したときにのみ再描画されます。 3. どのブローカーのMetaTrader 4取引プラットフォームでも取引できます。 4. あらゆる資産(通貨、金属、暗号通貨、株式、指数など)を取引できます。 5. H1タイムフレーム(中期取引)で取引するのがよい。 6. 各トレーダーがインディケータを自分用に簡単にカスタマイズできるよう、インディケータ設定で個々のパラメータ(TF、色など)を変更できます。 7. このインディケータは、トレーディングシステムの優れた
Advanced version of CyberZingFx Volume Plus, the ultimate MT4 indicator for traders seeking highly accurate buy and sell signals. With an additional strategy and price action dot signals that enhances its effectiveness, this indicator offers a superior trading experience for professionals and beginners alike. The CyberZingFx Volume Plus Advanced version combines the power of volume analysis and historical price data with an additional strategy, resulting in even more precise and reliable signals
Price Action Entry Alerts
Stephen Sanjeeve Sahayam
5 (3)
このインジケーターは、売買圧力についてすべてのバーをスクリーニングし、最大量の 4 種類のローソク足パターンを特定します。次に、これらのローソク足はいくつかの線形フィルターを使用してフィルター処理され、買いまたは売りのシグナルが表示されます。シグナルは、より高い時間枠の方向と組み合わせて、取引量が多い時間帯に取引される場合に最も効果的に機能します。すべてのフィルターはカスタマイズ可能で、独立して動作します。ボタンをクリックするだけで単一方向の信号を表示できます。 このインジケーターには、意思決定プロセスに役立つ最も重要な価格アクションとスマート マネーの概念も組み込まれています。 シグナルとトレードに関する教育をすべて 1 つのツールにまとめました。 特徴: 信号は再描画されません。 飲み込むキャンドル、拒否キャンドル、拡張範囲キャンドル、ピンバーを識別します。 有効なシグナルごとに複数のエントリー、ストップロス、複数のテイクプロフィットレベルを表示します。 大容量セッションでフィルタリングします。 サポート/レジスタンスレベルとローソク足の構造でフィルターします。 MACD ヒ
Thise indicator is up down v6  comes with tradingwiev pinescript. purchased people, after installed on terminal ,contact me on mql5  to get BONUS  TradingView pinescript. up-down indicator is no repaint and works all pairs and lower than weekly time frames charts. it is suitable also 1 m charts for all pairs. and hold long way to signal. dont gives too many signals. when red histogram cross trigger line that is up signal.and price probably will down when blue histogram cross trigger line that
This indicator is very simple. It tracks the trend and leads it until it changes. You can also set or trail a stop using this indicator. The indicator is equipped with the ability to track older trends on lower charts. Optimal use is achieved by using this indicator together on the current and senior charts. Write after purchase to receive personal recommendations.
Black series MT4 - The indicator is designed for trading on binary options with Timeframe M1-M5-M15 Multicurrency (Works on cryptocurrency and currency pairs) The signal appears when the candle opens Up to 90% correct signals There is no signal redrawing at all Can be used with other indicators. Good for scalping! In Settings there is: -Indicator working methods -I Allert Arrow color Red signal down Blue signal up Also watch the video how the indicator works and signals
今、147ドル(いくつかの更新後に499ドルに増加します) - 無制限のアカウント(PCSまたはMac) RelicusRoad ユーザー マニュアル + トレーニング ビデオ + プライベート Discord グループへのアクセス + VIP ステータス 市場の新しい見方 RelicusRoad は、外国為替、先物、暗号通貨、株式、および指数の世界で最も強力な取引インジケーターであり、トレーダーに収益を維持するために必要なすべての情報とツールを提供します。初心者から上級者まで、すべてのトレーダーが成功するためのテクニカル分析と取引計画を提供します。これは、将来の市場を予測するのに十分な情報を提供する重要な取引指標です。意味をなさないチャート上のいくつかの異なる指標ではなく、完全な解決策を信じています.これは、信号、矢印 + 価格アクション情報を表示するオールインワンのインジケーターで、他に類を見ない非常に正確です。 強力な AI に基づいて、RelicusRoad は不足している情報とツールを提供して、あなたを教育し、トレーディングのプロ、成功したトレーダーにします。
Was: $249  Now: $99   Market Profile defines a number of day types that can help the trader to determine market behaviour. A key feature is the Value Area, representing the range of price action where 70% of trading took place. Understanding the Value Area can give traders valuable insight into market direction and establish the higher odds trade. It is an excellent addition to any system you may be using. Blahtech Limited presents their Market Profile indicator for the MetaTrader community. Ins
まず最初に、このトレーディングシステムがリペイントされず、再描画されず、遅延しないことを強調する価値があります。これにより、プロのトレーディングに最適な状態になります。 オンラインコース、ユーザーマニュアル、デモ。 「スマートサポートアンドレジスタンストレーディングシステム」は、新規および経験豊富なトレーダー向けにカスタマイズされた高度なインジケーターです。この包括的なシステムは、7以上の戦略、10のインジケーター、およびデイトレード戦略、スイングトレード戦略、サポートおよびレジスタンス戦略、ローソク足パターン戦略、VWAP戦略、マルチタイムフレームトレンド戦略など、さまざまなトレーディングアプローチを組み合わせています。これは、矢印信号、エントリーポイント、出口ポイント、トレードアラート、より高い時間枠のトレンド分析、リアルタイムのトレードモニタリング、そして洞察力のあるトレンドとボリュームキャンドルの着色を提供します。自動的なサポートとレジスタンスの検出により、さまざまな市況下でトレーダーが的確な決定を下すのを支援する多面的なインジケーターとなっています。 スマートサポートア
OVERVIEW A Lorentzian Distance Classifier (LDC) is a Machine Learning classification algorithm capable of categorizing historical data from a multi-dimensional feature space. This indicator demonstrates how Lorentzian Classification can also be used to predict the direction of future price movements when used as the distance metric for a novel implementation of an Approximate Nearest Neighbors (ANN) algorithm. This indicator provide signal as buffer, so very easy for create EA from this in
作者のその他のプロダクト
TRADING INTRADAY EA- Forex Robot MT4.いくつかの異なる EA を試したことがあるかもしれませんが、すべてが期待どおりに機能したわけではありません。 EA がどのように機能するかを確認するために、システムをチェックアウトしてください。 TRADING INTRADAY EA は、市場で見つけられる最高の外国為替ロボットの 1 つです。購入完了後、ご連絡いただければ、近日中にリリース予定の MT5 用 MetaTrader 4 バージョンで利用可能な TRADING INTRADAY EA の詳細な説明をお送りします。 これは、テスターに​​表示される保留中のシステムを使用して、毎日の結果を取得することにより、長期の価格トレンド条件を利用することに基づく戦略です。オプションで、価格帯に基づくシステムを含めます。使用したい場合は、1 つ変更するだけです。パラメータ。非常に優れているため、ここに含めます。最初のシステムがポジションを開かない場合があることを知っています。これには条件がないためです。時間フィルター (定義された取引時間) もあります。 E
フィルタ:
レビューなし
レビューに返信
バージョン 1.22 2024.05.22
error fix update in the dashboard
バージョン 1.21 2024.05.19
新機能

このアップデートでは、インジケーターが軽量化され、より高速でスムーズなパフォーマンスを実現しました。さらに、すべてのタイムフレームを同時に監視できる総合ダッシュボードを導入し、より効率的で使いやすい体験を提供します。
バージョン 1.2 2024.05.12
What's new? : This is the latest version of the indicator, featuring updated calculations for reentry setups and extreme signals.