• 概要
  • レビュー
  • コメント
  • 最新情報

Real Range Bar and Custom Time Charts

RRBCTC uses real Tick data to create custom Range, Time, Renko and Volume bar charts for MT4. Tick data use is RRBCTC unique feature, which allows highest quality charting of current and historical price movement. Custom inputs provide option to create range bars with sizes from 0.1 pip all the way to 100+ pip and time bars periods from second all the way to a month. Charts are updated with new data in real time, allowing user use of MT4 indicators and advisors (EA). RRBCTC greatly extends MT4 charting options.


LEGEND (acronyms used in description) 

  • RRBCTC - Real Range Bar and Custom Time Charts (MT4 component)
  • DE - Data Extractor (MT5 component)
  • EA - Expert advisor
  • MT4 - MetaTrader4 terminal
  • MT5 - MetaTrader5 terminal


WHY SHOULD YOU CHOOSE TO BUY RRBCTC ?

MT4 by default only provides 9 time periods for displaying market movement. This limited options are simply not good enough for quality market analysis. Even if you were to purchase one of the range, renko or custom timeframe creation tools available to extend MT4 charting options, such tools would still be limited by MT4 build-in restrictions. Existing tools create custom charts by extrating data from 1 minute time chart, a method which does not allow for accurate construction of bars. Faulty chart data leads into inaccurate analysis and improperly placed trades. As former user of charts created in such manner, I have a lot of experience and knowledge with how inaccurate such data really is. RRBCTC was created to solve this problem, by importing tick data and use it to build every (real) bar piece by piece. This process is done quickly and efficiently, so that user want be able to spot a difference between ordinary MT4 chart and a RRBCTC custom chart. Not only does RRBCTC provide you with quality data, it also combines all different charting options into one indicator, eliminating need for any other tool. Create any custom range, time, renko and equal volume charts you can imagine. If you have ever wanted to use some odd time period, like 7 min 30 second, now you can. Beside chart creation, RRBCTC also provides chart management, accessible through on chart user interface. Functions, like opening new custom chart and switching periods are designed to make life easier for the user. Continuous chart updates, make charts suitable for live trading and for use with any standard indicator or EA. Simple put, RRBCTC was designed to be the last chart creation tool for MT4 you will ever need. For more details on individual RRBCTC capabilities, please read section (Features).


FATURES

  • External component - RRBCTC uses external component to retrieve tick data it needs to build charts. Default external component for RRBCTC is called Data Extractor (DE) and is available for free on MT5 market. Experienced users are free to import tick data trough the use of there own tools. DE is free MT5 tool which can be used on any demo or live MT5 account to process and save data RRBCTC needs to function at full capacity. For more details on how this works, please read section (How to use). Link to Data Extractor is listed on the end of description, under section LINKS.
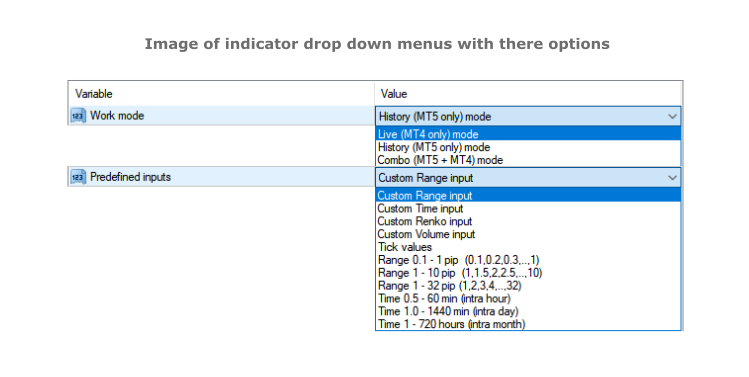
  • Work modes - RRBCTC can operate in 3 different work modes. Live (MT4 only) mode creates charts from data it collects in real time from MT4. History (DE MT5 only) mode uses only external data to create charts. Combo (DE MT5 + MT4) mode uses combination of live data from MT4 and data from external component.
  • Custom input and predefined sequences - Through use of custom input, user can define sequence of values which will be used to create charts. Custom sequences provide user the ability to create only charts it needs and under conditions he chooses. RRBCTC also has a selection of predefined range and time sequences, for users who do no want or need to use custom input.
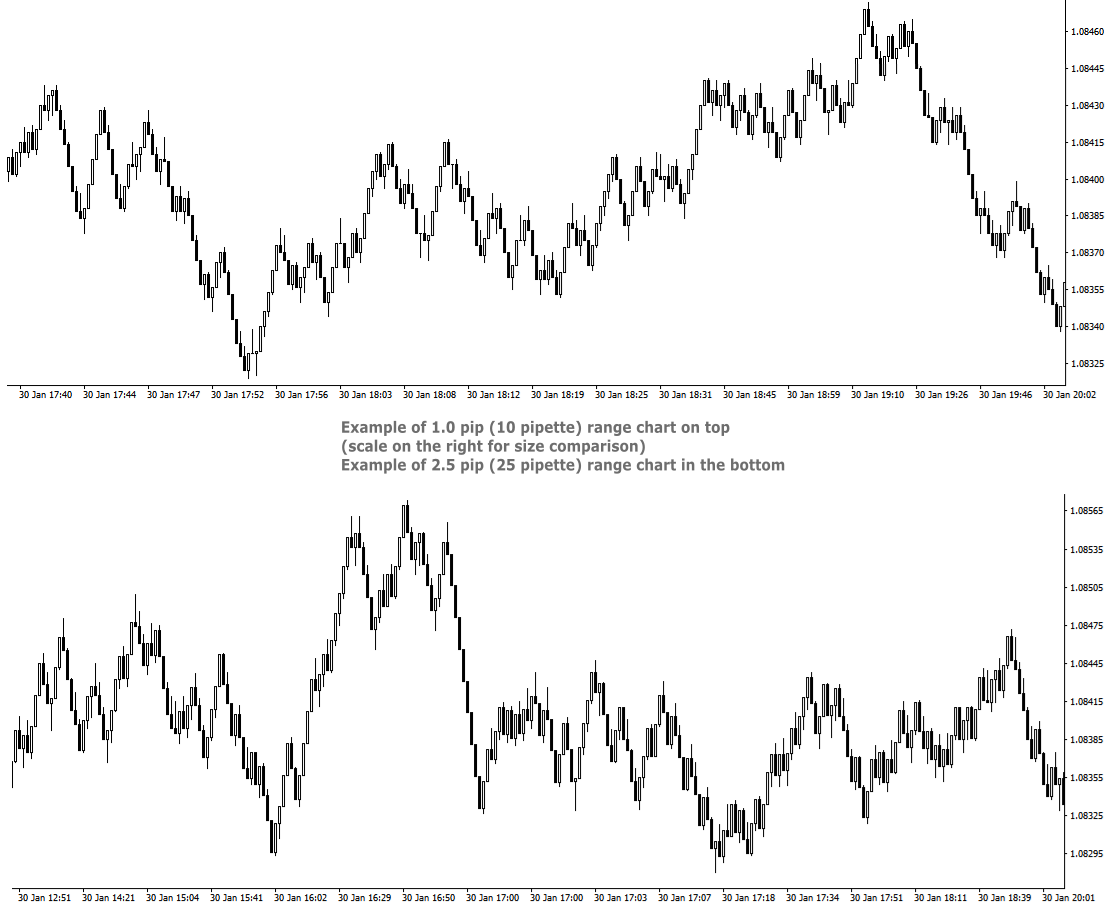
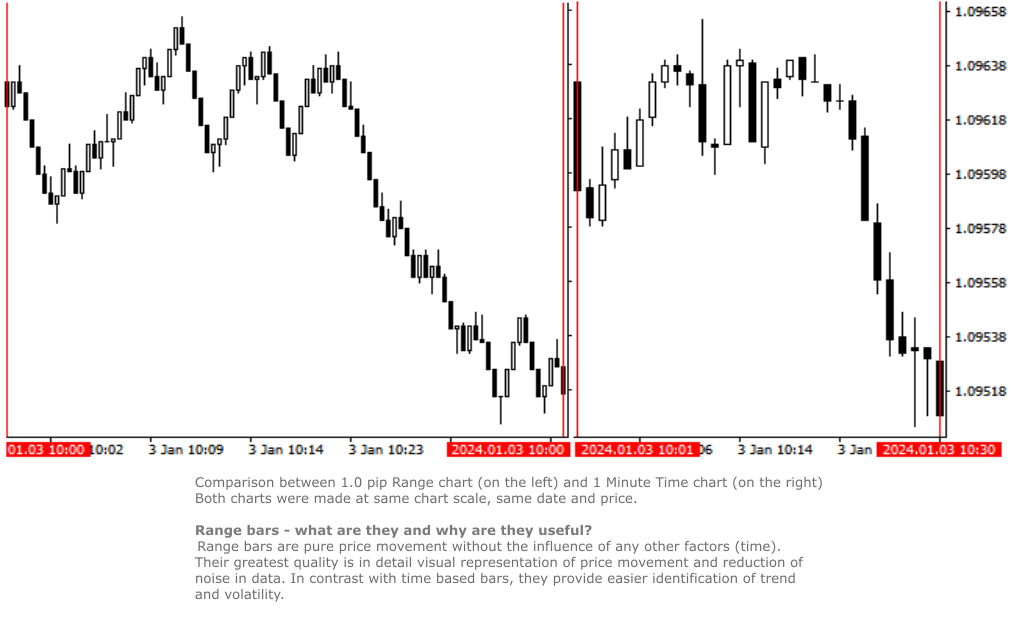
  • Custom Range chart creation - Range bars consider only price, thereby eliminating time from the equation. RRBCTC allows user custom selection of range bar size, starting from 0.1 pip (1 pipette) all the way up to 100 pip or more. Smallest increment is 0.1 pip (Example: 1.2, 1.3, 1.4 pip and so on). Values in pipettes are available for instruments using extra decimal (most of them do). 
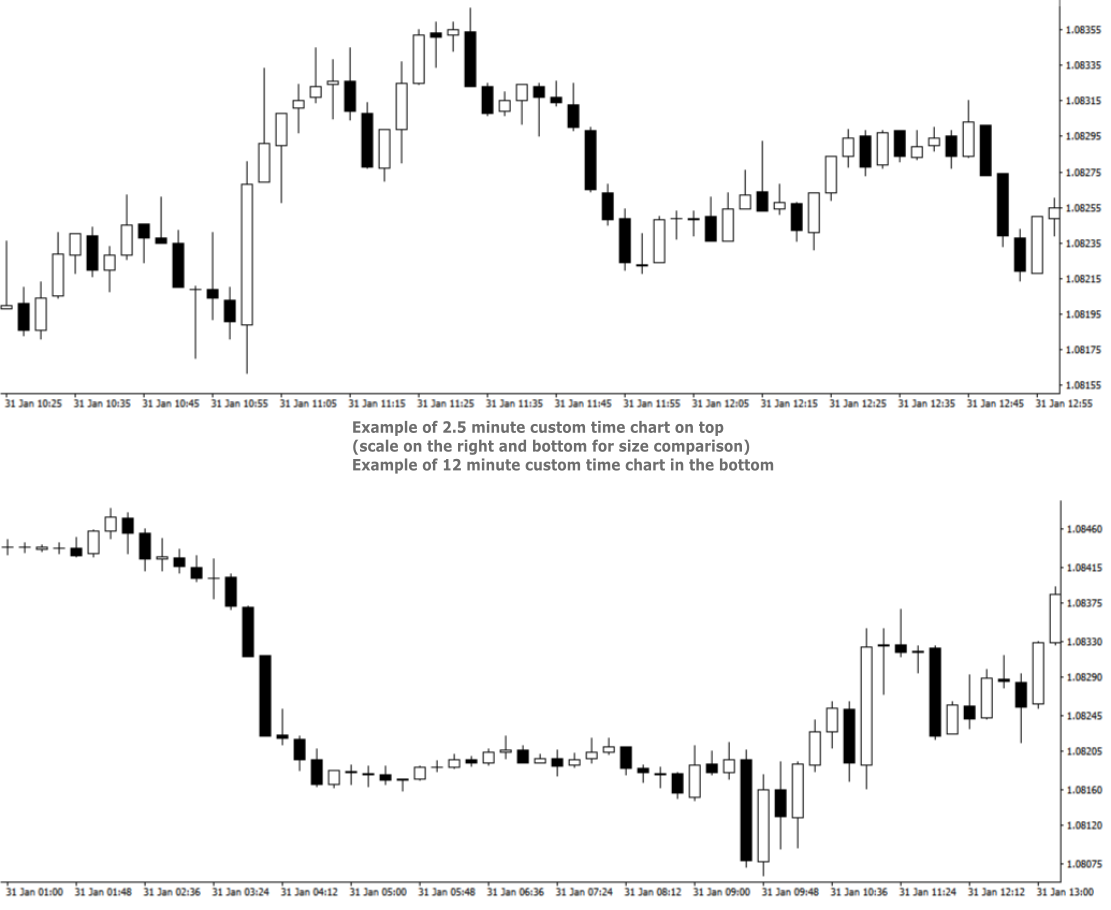
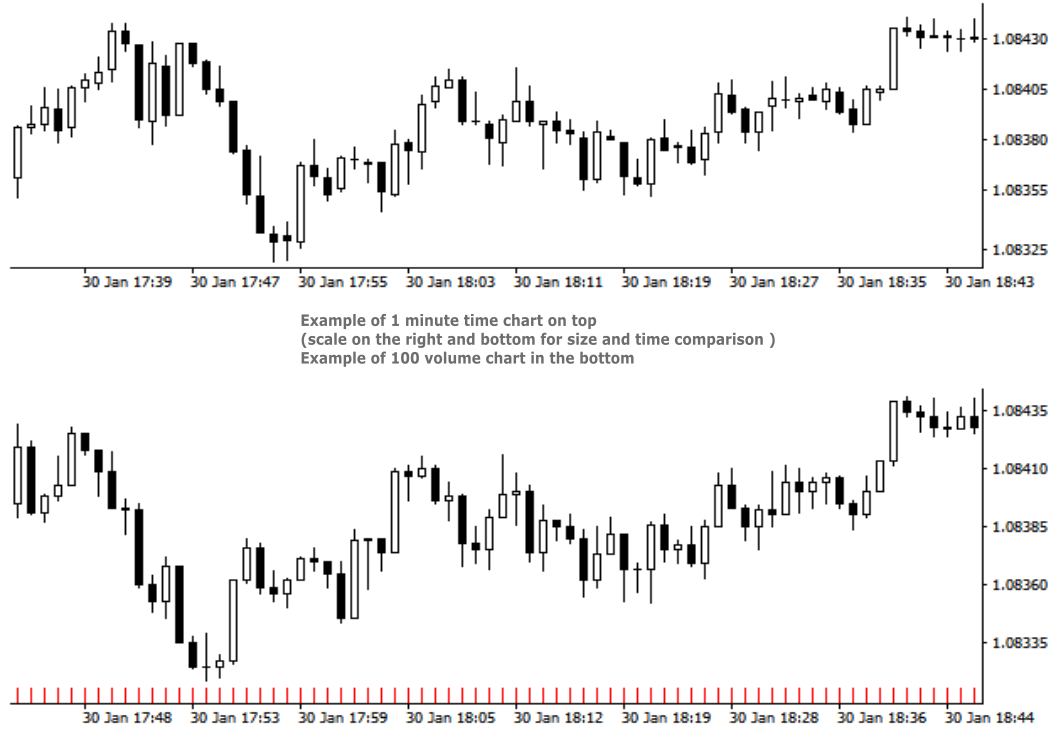
  • Custom Time chart creation - RRBCTC allows user custom selection of time frame size in minutes or/and hours, starting from 0.02 min (1 second) all the way up to 720 hours (30 days). Smallest increment is 0.01 min. Scientific decimal system is used for time values (3.5 minutes = 3 min 30 sec)
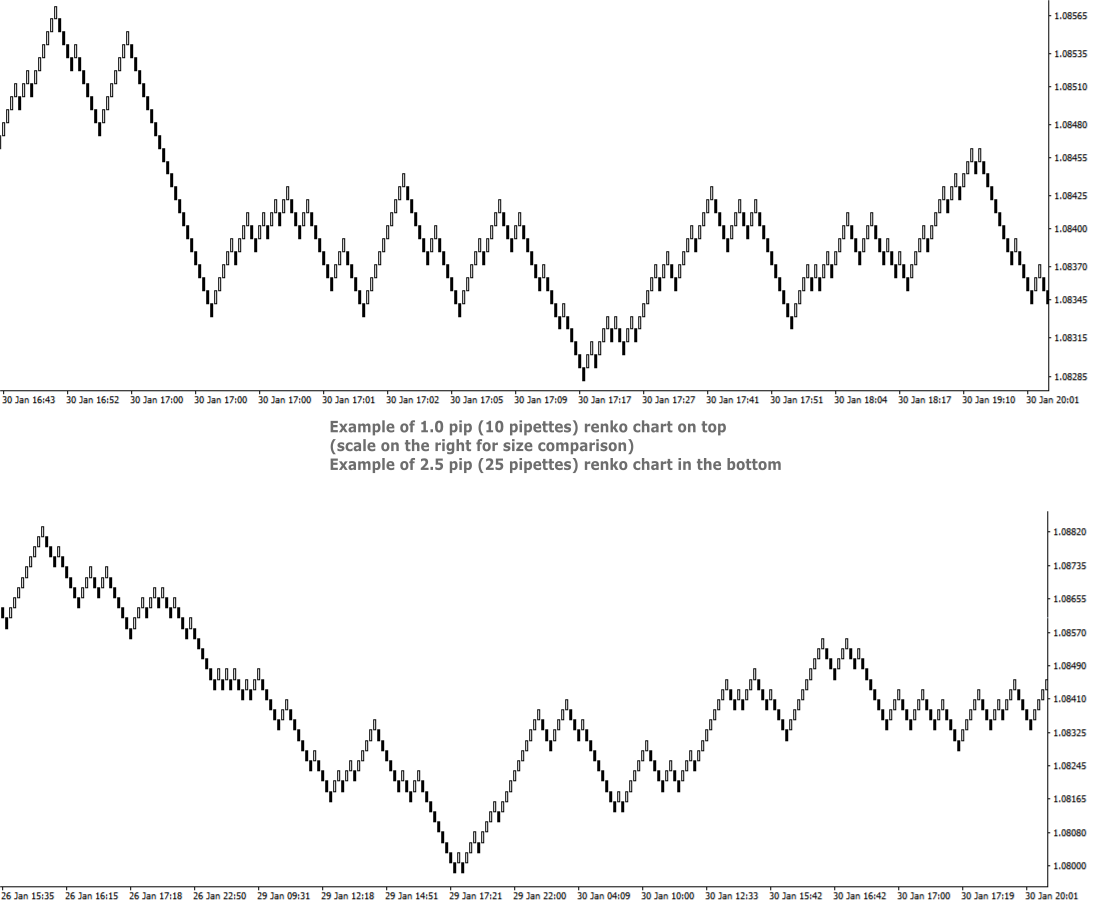
  • Custom Renko chart creation - Renko are bricks created at 45-degree and filter out minor price movements. RRBCTC allows user custom selection of renko bar size, starting from 0.1 pip (1 pipette) all the way up to 100 pip or more. Smallest increment is 0.1 pip. (Example: 1.2, 1.3, 1.4 pip and so on). Values in pipettes are available for instruments using extra decimal (most of them do).
  • Custom Volume chart creation - Volume bars are all created with the same amount of tick volume and represent price movement within that volume value. RRBCTC allows user custom selection of volume bar size, starting from 1 unit of volume all the way up to 100000 units or more. Smallest increment is 1 unit of volume. 
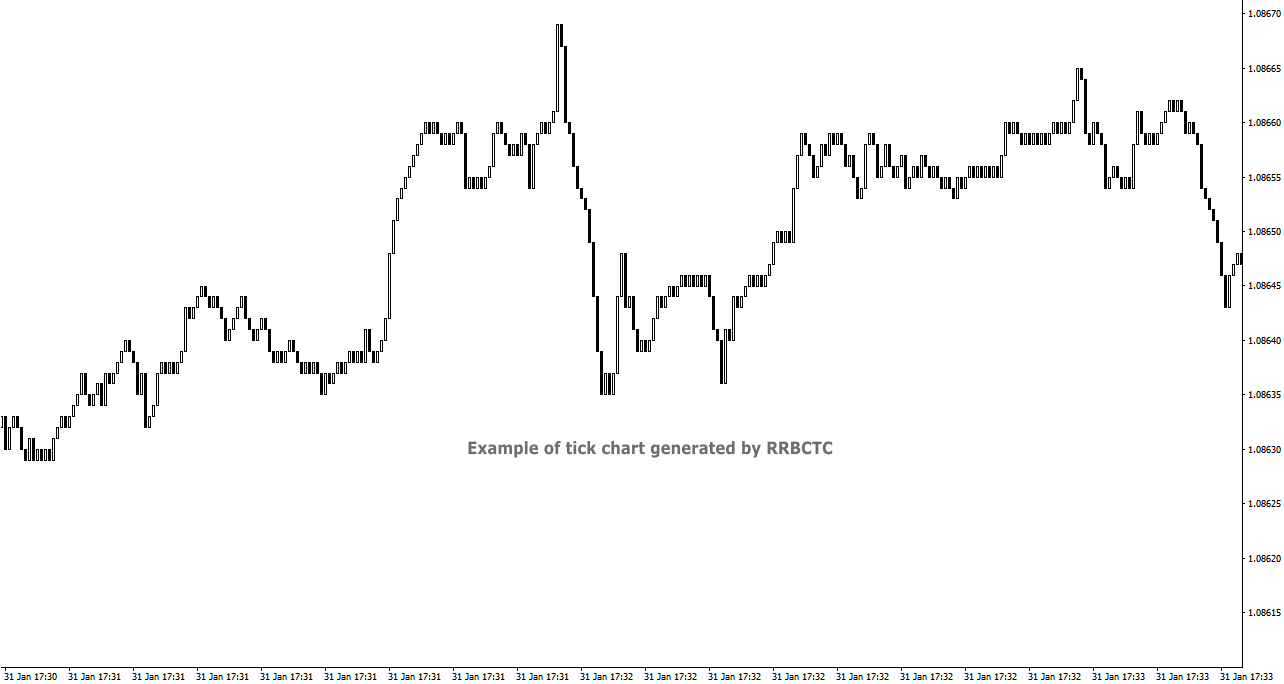
  • Tick chart creation - Tick bars are minimum measurement of price change. RRBCTC allows user display of pure tick bars.
  • Real time chart update - Opened charts are continuously updated (around 20 times a second), displaying new data and allowing MT4 indicators or EAs to function just as they do on regular MT4 charts. User will not be able to notice any delay in market movement. 
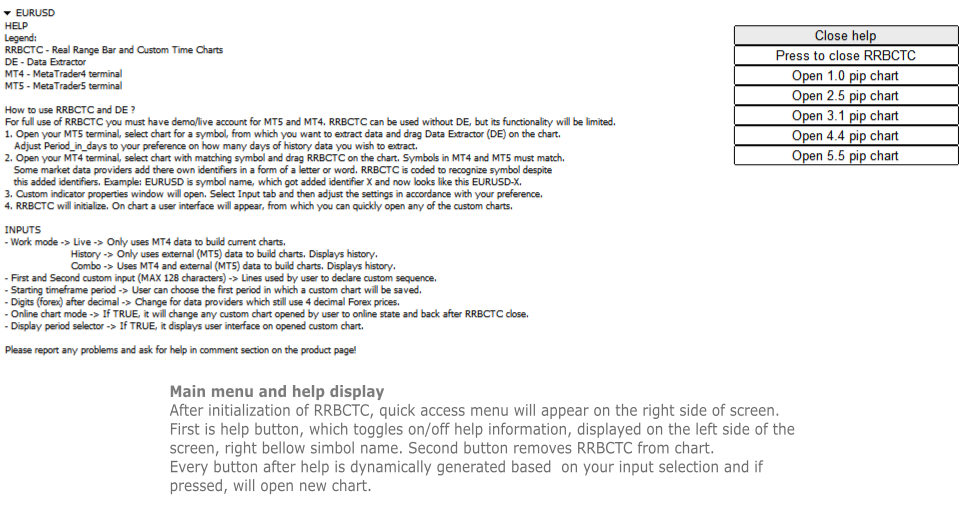
  • User interface - Build in user help and interface. There are 2 versions of on chart interface. The first is displayed on the chart, where indicator was attached to and shows help, close and open chart buttons. Second interface is attached to every custom chart opened and provides user with information about the chart and option to change chart period directly.
  • Chart management - User can choose to use RRBCTC in more manual way or to leave chart management to auto function. In automatic mode RRBCTC will manage charts online/offline state and save data if needed. 
  • Error prevention - Integrated user error prevention functions, which should handle most potential user errors.
  • Compatibility - Designed to work with all types of financial instruments, with automatic symbol recognition build in. 
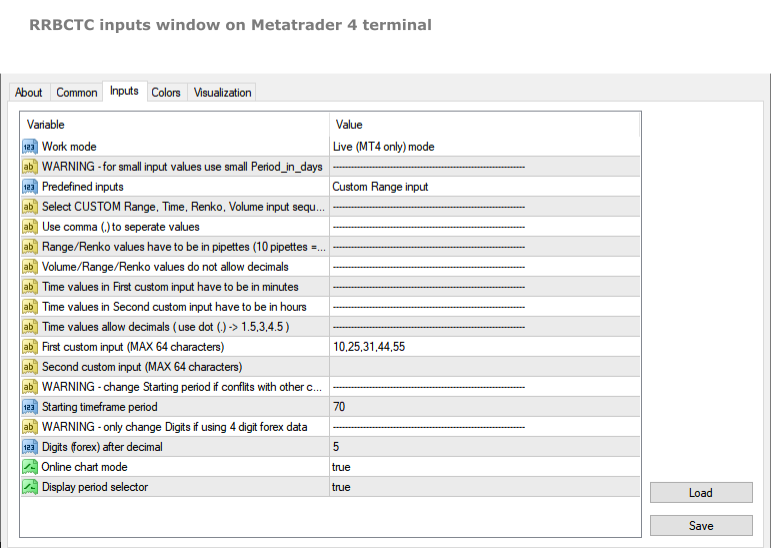

SETTINGS (INPUTS)

  • Work mode 
    • Live -> Only uses MT4 data to build current charts, does not build history past the point of RRBCTC initialization. Recommended work mode for live trading, where past data is not needed. 
    • History -> Only uses external (MT5) data to build charts. History is build for a time interval defined by a user. Recommended work mode for long term chart analysis, where a large quantity of data is needed. 
    • Combo -> Uses MT4 and external (MT5) data to build charts. History is build for a time interval defined by a user. Recommended work mode for live trading and short/medium term chart analysis.
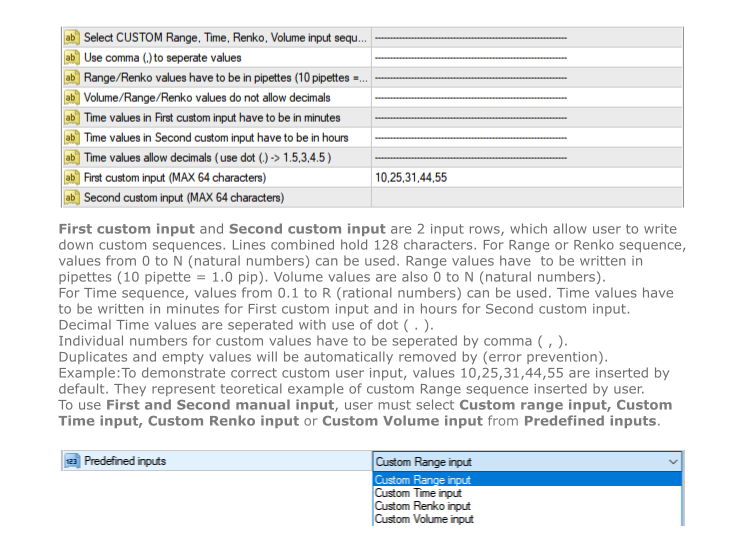
  • Predefined inputs
    • Custom Range input -> Allows use of First and Second custom input lines, where user can define range bar sizes for which charts will be build.
    • Custom Time input -> Allows use of First and Second custom input lines, where user can define time frame sizes for which charts will be build.
    • Custom Renko input -> Allows use of First and Second custom input lines, where user can define renko box sizes for which charts will be build.
    • Custom Volume input -> Allows use of First and Second custom input lines, where user can define volume sizes for which charts will be build.
    • Tick values - Creates only tick chart. Can also be created alongside Range charts, by entering 0 as one of the values in custom input.
    • Range 0.1 - 1 pip -> 1. st predefined sequence. No user input. Creates 10 charts from 0.1 - 1.0 pip, with increments of 0.1 pip.
    • Range 1 - 10 pip -> 2. nd predefined sequence. No user input. Creates 19 charts from 1.0 - 10.0 pip, with increments of 0.5 pip.
    • Range 1 - 32 pip -> 3. rd predefined sequence. No user input. Creates 32 charts from 1.0 - 32.0 pip, with increments of 1.0 pip.
    • Time 0.5 - 60 min -> 4. th predefined sequence. No user input. Creates 15 charts from 0.5 (half) minute - 60.0 min (1 hour), with 1.5x or 2.0x increments. Intra hour time frames.
    • Time 1.0 - 1440 min -> 5. th predefined sequence. No user input. Creates 17 charts from 1.0 minute - 1440.0 min (1 day), with 1.5x or 2.0x increments. Intra day time frames.
    • Time 1 - 720 hours -> 6. th predefined sequence. No user input. Creates 17 charts from 1.0 hour - 720.0 hour (1 month), with 1.5x or 2.0x increments. Intra month time frames.
  • First custom input (MAX 64 characters) -> First line to be used to declare custom sequence. Based on Custom input type, it allows values in pipettes or minutes or volume. 
  • Second custom input (MAX 64 characters) -> Second line to be used to declare custom sequence. Based on Custom input type, it allows values in pipettes or hours or volume. Both lines can be used simultaneously. Instructions, for how to input values correctly, are stated in the settings above the first custom input line.
  • Starting time frame period -> Chart build by RRBCTC need to be saved in selected symbol history. User can choose the first period in which a custom chart will be saved. Charts after the first get assigned period by RRBCTC.
  • Digits (forex) after decimal -> This setting should only be used by users who still receive symbol data with one less decimal spot. Forex example: if your EURUSD price value only has 4 decimals, then you are one of the few, whose forex data provider, still hasn't switched to 5 decimal data.
  • Online chart mode -> If set to true, it will automatically  change any custom chart opened by user to online state and back to offline state after RRBCTC close. Chart must be in online state to allow live trading and updating of indicators and/or EAs attached to custom chart.
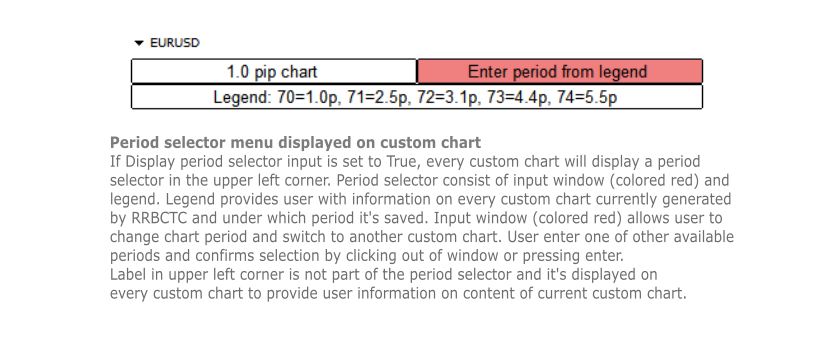
  • Display period selector -> If set to true, it displays user interface on any opened custom chart. The interface allows user to switch between custom charts generated by RRBCTC.


HOW TO USE RRBCTC and Data Extractor

For full use of RRBCTC, you must have demo or live account for MT5 and MT4. RRBCTC can be used without Data Extractor (DE), but its functionality will be limited. Only Live mode will work without it. Once you have downloaded RRBCTC for MT4 and DE for MT5, you must locate them in your terminal market indicator folder.

Recommended procedure on how to use RRBCTC:

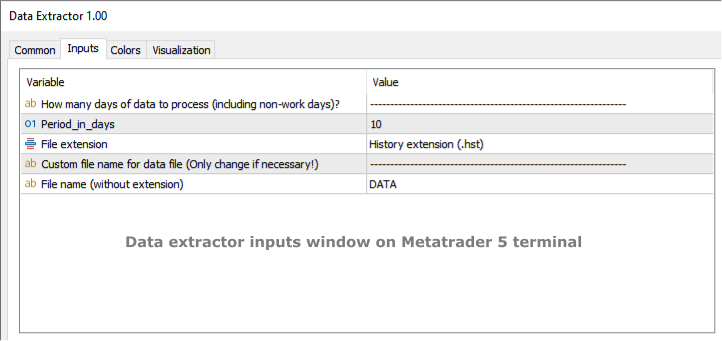
  1. Open your MT5 terminal, select chart for a symbol, from which you want to extract data and drag Data Extractor (DE) on the chart. The only DE setting you might need to adjust according to your preference is called Period_in_days. This setting controls how many days of history data you wish to extract. It's recommended to leave this setting unchanged on your first use of RRBCTC. Other DE setting should never be changed (ignore them).
  2. Open your MT4 terminal, select chart with matching symbol and drag RRBCTC on the chart. Symbols in MT4 and MT5 must match, but they do not need to match perfectly. Some market data providers add there own identifiers in a form of a letter or word. RRBCTC is coded to recognize symbol despite this added identifiers. You as the user only need to match the symbol name. Example: EURUSD is the symbol name, sometimes symbol name get added identifier, which may look like this EURUSD-X. 
  3. When dragged to chart, RRBCTC custom indicator properties window will open. Select Input tab and then adjust the settings in accordance with your preference. For best experience, please follow instructions stated in this product description or in the indicator itself. 
  4. Once settings have been confirmed and properties window closed, RRBCTC will initialize. The length of this process depends on the quantity of data RRBCTC need to process. For most use cases this will only take a couple of seconds. On chart a user interface will appear, from which you can quickly open any of the custom charts.

From this point onwards, you a free to explore custom charts and experiment with changing of RRBCTC input settings. RRBCTC has many user error prevention functions, so there is no need to worry about doing any damage to your existing charts or MT4 terminal. Example of such function: RRBCTC does not allow you to write over any of MT4 default time frames (like M15, H1,..). 


FREQUENTLY ASKED QUESTIONS (recommended reading)

  • Q -> What happens with open custom charts, if user removes (closes) RRBCTC from the chart?

A -> All opened custom charts will remain open. If setting Online chart mode is set to TRUE, then any open online chart will be set to offline state, before RRBCTC closes. If setting Online chart mode is set to FALSE, then charts will remain in the state user manually set them to. By default such charts are in offline state. Objects and indicators attached to open custom chart will be preserved.

  • Q -> What happens with open custom charts, if user closes MT4 terminal without removing RRBCTC from chart?

A -> On next MT4 terminal start up, RRBCTC will initialize and set open custom charts to state they were in before closing of MT4 terminal.

  • Q -> Can user switch between custom charts in the same way one can switch between time frames on normal MT4 time charts?

A -> If setting Display period selector is set to TRUE, every open custom chart will have user interface displayed in the upper left corner of the chart. This interface allows user to switch between custom charts, without opening new chart. Interface displays information about current chart, a legend containing information about other custom charts and input field, where period of other custom chart can be entered. Simply click on the input, write period number of chart you wish to display and confirm input by pressing Enter or clicking out of input field. Chart switch might take a second to happen, this is because MT4 terminal does not prioritize this function. If setting Online chart mode is set to FALSE, all custom charts are in offline state. Period selector will not work in offline state!

  • Q -> Can RRBCTC be used for financial instruments, other than forex?

A -> RRBCTC should be able to recognize all symbols (even more obscure ones) and correctly build custom charts for them. There is a however a chance, RRBCTC might struggle with correct chart construction for some symbols. If you encounter such an example, please inform me, so that error can be fixed.

  • Q -> Can more then one RRBCTC run at the same time?

A -> Several RRBCTC can run simultaneously, but only one can be attached to a unique chart. You can even run 2 or more RRBCTC for one symbol, as long as they are attached to separate chart and periods used for saving custom charts don't overlap. If the periods do overlap, it is likely that will cause error.

  • Q -> How many custom charts can RRBCTC create?

A -> RRBCTC has no theoretical hard limit on how many custom charts it can create, but in practice the number is limited by the length of user defined custom sequence. There are 2 input lines, each can hold 64 characters, so 128 characters combined. The max value depends on the values inserted by the user, but on average you can expect RRBCTC to create maximum of around 32 custom charts. It's advised to only create as many custom charts as is needed. Maintaining custom charts, that will not be used, is a draw on resources.

  • Q -> How safe are RRBCTC created charts for live trading?

A -> Custom charts are as safe as the default MT4 time charts, provided user follows instructions. Live and Custom modes should be used for live trading, because they update current price values directly from MT4. History mode can also be used for live trading, but since it only uses external data, there could potentially be slight differences in price values. If you use quality market data provider, there should be no difference between values. Market data should always be the same, regardless of data provider. If you observe mismatch in charts, there are 2 potential problems. Either you have set up RRBCTC wrong or your market data provider has low quality data.

  • Q -> Is RRBCTC use of external data a potential safety risk?

A -> RRBCTC only uses data needed to construct charts correctly. This data is read-only and processed in very specific order. Any interference with this data would only result in error. RRBCTC does not collect, process or communicate any data related to user account. 

  • Q -> What happens, if user applies template to custom chart and overrides previous custom chart content?

A -> RRBCTC was coded to handle such situation. Users are free to use templates to quickly move chart content to custom chart. After user applies template, RRBCTC will restore its custom chart user interface and  leave content created by template intact. User might notice slight delay and chart switching to 1 hour (H1) period for a moment. This is normal and unavoidable part of how MT4 handles custom online charts.


REQUIREMENTS AND SYSTEM INFORMATION 

  • OS Windows (any version), might work on other OS, but not verified
  • RRBCTC and DE will work with portable version of MT4


DISCLOSURE STATEMENT

Data from different market providers may result in slight differences on some custom charts.

RRBCTC and DE will be supported as long as author has capabilities to do so. Author does not take responsibility for updating software, if external factors beyond his control, prevent it.

Please report any problems and ask questions for more details!


LINKS

Link to Data Extractor:  https://www.mql5.com/en/market/product/112293


おすすめのプロダクト
Linker
Roman Lipatov
5 (1)
"LINKER" is an indicator that links any number of windows of the charts it is running on. A synchronized crosshair is also available, toggled by the (Ctrl) key or the (L) button. The visibility of the trade levels can be toggled on each chart separately using the (Shift) key or the (V) button. The buttons and the crosshair have customizable settings and colors. For instance, you need to analyze a trading instrument on different timeframes, for example, on H1, H4 and D1. Doing this in a single ch
The indicator displays Renko bars on the chart, uses their data to calculate and display the moving average, PriceChannel and generates buy/sell signals. Renko is a non-trivial price display method. Instead of displaying each bar within a time interval, only the bars where the price moved a certain number of points are shown. Renko bars do not depend on a time interval, therefore the indicator works on any timeframe without losing its efficiency. The PriceChannel indicator displays the upper, lo
Introducing the Tether Angle MT4 EA (T-Angle EA)  Unlock the full potential of the forex market with the cutting-edge T-Angle EA . Designed to capitalize on the dynamic movements of the EUR/USD currency pair, this expert advisor combines the power of Tether Line Angle Trend to deliver consistent and optimized trading outcomes. Key Features: EUR/USD Focus: The T-Angle EA is effectively tailored for the EUR/USD currency pair, ensuring a highly specialized approach. By concentrating on this
The Before indicator predicts the most likely short-term price movement based on complex mathematical calculations. Most of the standard indicators commonly used in trading strategies are based on fairly simple calculations. This does not mean that there were no outstanding mathematicians in the world at the time of their creation. It is just that computers did not yet exist in those days, or their power was not enough for the sequential implementation of complex mathematical operations. Nowa
KT Renko Live Chart utility creates the Renko charts on MT4 that can be further used for speculation or live trading. The Renko chart created by this utility supports most of the custom indicators and automated Expert Advisors. Fully compatible with our Renko Patterns indicator and Renko Patterns EA . To use an Expert Advisor on the generated Renko chart, make sure to untick the "Offline Chart" in the chart properties.  Features A simple and straightforward Renko utility that provides the Ren
The indicator calculates and displays renko bars using MA and PSAR data as well as provides buy/sell signals. Renko is a non-trivial price display method. Instead of displaying each bar within a time interval, only the bars where the price moved a certain number of points are shown. Renko bars do not depend on a time interval, therefore the indicator works on any timeframe without losing its efficiency. Buy signal forms when PSAR readings are moving down, MA is moving up, the price is closing ab
Power Renko is an indicator which plots Renko bricks underneath the chart using a histogram. You can select the brick size and the timeframe of the Renko bricks as well as whether or not to use the close price or the high/low price of the candles. Renko bricks are based on price alone, not time, therefor the Renko bricks will not be aligned with the chart's time. They are extremely useful for trend trading and many different strategies can be formed from them. Buffers are provided allowing you t
-25% discount ($149 -> $111) Everything for chart Technical Analysis indicator mt4 in one tool Draw your supply demand zone with rectangle and support resistance with trendline and get alerts to mobile phone or email alert -  Risk reward indicator Video tutorials, manuals, DEMO download   here .  Find contacts on my   profile . 1.   Extended rectangles and trendlines Object will be extended to the right edge of the chart when price will draw new candles on chart. This is rectangle extender or
Trades Extractor
Medilane Bernard Philippe Couratier
Jarfac Trades Extractor Description: Le "Jarfac Trades Extractor" est un script MQL4 conçu pour les traders qui souhaitent exporter et analyser leurs trades historiques. En un seul clic, le script génère un fichier CSV contenant des informations détaillées sur chaque trade exécuté pendant une période spécifiée. Caractéristiques principales : Filtrage par Période : Définissez une période personnalisée pour l'extraction. Possibilité de désactiver le filtrage par période. Filtrage par Commentaire :
FREE
Candle Average
Mahmoud Helmy Sedik Mohamed Mansour
Candlestick patterns have little value without the right   price action   context. If you’ve been studying candlestick formations, you must have heard this principle many times over. You cannot trade patterns in a vacuum. But what do we mean by   context ? It is an overall technical assessment that encompasses: The market’s trend Support and resistance structure Recent price formations Volatility It seems intimidating at first, but a simple trading indicator can help us out here - the   moving a
The indicator calculates and displays Renko bars using PSAR and CCI data as well as provides buy/sell signals. Renko is a non-trivial price display method. Instead of displaying each bar within a time interval, only the bars where the price moved a certain number of points are shown. Renko bars do not depend on a time interval, therefore the indicator works on any timeframe without losing its efficiency. The buy signal is generated when the CCI indicator crosses the 100 level upwards, and the PS
TradeMirrorは、MT4/MT5プラットフォーム用のトレードコピーEAです。 TradeMirrorを選ぶ理由 金融ソフトウェアにはセキュリティ、安定性、プライバシーが重要であることを理解しているため、この3つの要素を細部にわたって固めるために、さらなる努力を重ねています: 操作が簡単なユーザーフレンドリーなグラフィカルインターフェースを提供 プライバシーとセキュリティを重視し、注文の分配にプライバシーが要求される様々な金融シナリオに適していること 注文の正確な複製、ミリ秒単位での配信 フルプラットフォーム、MT4またはMT5をサポート  システム状況のインテリジェントな認識、メール通知で取引の安全性をガード コア機能一覧 フォローアップソフトは、機能が多ければ良いというものではないので、厳密な需要分析の後、プログラムを合理化し、最終的に以下のコア機能を保持しました。 マルチコネクション メール通知機能 ロットスケーリング 信号のフィルタリング 逆指値注文 テイクプロフィット/ストップロスのリセット 無料デモ Trademirrorを購入する前に、いつでも無料のデモを試すこと
Introduction to Smart Renko The main characteristics of Renko Charting concern price movement. To give you some idea on its working principle, Renko chart is constructed by placing a brick over or below when the price make the movement beyond a predefined range, called brick height. Therefore, naturally one can see clear price movement with less noise than other charting type. Renko charting can provide much clearer trend direction and it helps to identify important support and resistance level
Reanimator was made not like an ExpertAdvisor which make deals for taking Big Profit or something like that. His target is - to try to go back from big looses using the formula for Lot calculation. This formula based on our Drawndawn and Target-Price to get Breakeven. Sometime we have situation where we have big drawdawn and the price should go, for example, up. And we are sure, the price will move 100 points higher. For example: "Oh! The price will reach the Target 100 points, for sure!". I
EurUsd Binary Options
Daniel Joseph Kibe Wangewa -
YOU CAN ONLY FOWARD TEST THIS INDICATOR. USE DEMO FOR THIS AND SHARE YOUR RESULTS This indicator is a combination of different strategies that in theory drive the market.  Multi-Currency - Using the separate currencies; Euro and Dollar. RSI - from the separate currencies I get two different RSI values that are used to measure the market strength and direction It is important to note that this is not the Holy Grail and you should use a good money management system.  Two signals will appear from
Classic indicator. The Fractals indicator analyzes the price patterns that form on the candlestick chart and display the reversal points of the market trend. The indicator consists of candles, the middle of which is either the highest (up fractal) or the lowest (down fractal). Highs and lows, indicated by the indicator on the chart, are recommended to be taken as points that form support and resistance lines. Unlike the original indicator, where fractals are formed by five candles (high/low in t
FREE
Random trade Random Buy Random Sell Random profit Random Take profit Random Stoploss Crayzy strategy [Important] 0.01 LOT with 10k balance ------------------------------------------------------------------ Contact Us now Do you want have a EA that trade with your strategy?  We will finish the EA in 1-3 working days  Prime Capital Viet Nam primecapitalvn@gmail.com
Price Trend Light indicator is a beautiful indicator that shows purchasing areas and sales areas. This indicator is designed to follow the movement of the price which rounds on the opening price. It also provides information of trend follow on the break of the minimum and maximum. The indicator has a very simple graphic but effective, above the opening price you will have a light green color and under the opening price there is a red light. On every Break Out of the minimum or maximum sets in in
PipMaster is built using a powerful trend + momentum following algorithm. Made after years of testing and with market noise filtering built-in.  Aggressive traders can enter a trade as soon as an arrow appear. Conservative traders should wait for a visual alert after a closed candle bar. This indicator is a great tool to be used with your most trusted trend/momentum trading strategy and with solid money management rules. Key Benefits: -Super easy to use by following color coded arrow pointing
The oscillator shows trend direction using its own algorithm, which is based on calculating price values ​​by analyzing prices of separate currencies (original valuation of currencies). The histogram shows the average value of physical price change over the selected period. When the histogram has a positive value, the trend is rising, if negative - the trend id falling. The indicator uses standard RSI to determine the current market direction on a selected period as follows: the default value of
The EMA RENKO EA should run in Renko chart to show the best performance. The EA will entry based on 2 EMA line cross. (it is changeable in parameter.) As a result of FT , the best box size for XAUUSD (GOLD) is BOX 60 to 100.  Renko box size should be larger than spread value. Normally 3 times of spread. Please decide your box size with yourself. The EA will place addtional order as Grid if the trend move  to xxx pips from the last order. You can turn on/off in the parameter. T
Immediately plots renko bars in an external/indicator window.  One of the distinctive advantages Renko charts offer is the fact that they are not time dependent. Therefore, the new Renko blocks are only traced when the price moves higher or lower by the specified number of points.  For example, a 10 pip (100 points) Renko chart would plot the blocks when price moves 10 pips higher in an uptrend or 10 pips lower in a downtrend. Renko charts removes "noises" from the Market and i t helps to ident
"Bitcoin indicator" is a ready-made mechanical trading system for Bitcoin. The system is implemented as an indicator that shows the trader on the chart the price reversal points and the current trend direction. This information is enough to effectively trade in the market. The "Bitcoin indicator" consists of a complex analytical block that constantly analyzes the market and shows the trader where the trend is heading. The indicator also shows with dots on the chart, the price reversal points. S
Bigger chart labels would allow the user to be entirely aware of which chart he/she is on.  Each chart window is unique, containing different patterns and economic motives so acknowledging the chart window would be absolutely essential!  There are well known Economic Time Zones included in clear view, by choice!    Simple does it! Use your computing mouse scroller, clicking with the right finger on the label, in order to customize the label properties. From there, choose your preferred color,
FREE
Renko Chart — opens renko charts for MetaTrader 4. Renko charts can be created using this utility with all bars being in the form of Renko "bricks". All bars on the renko chart are the same size, which can be changed to get the desired chart. You can add indicators, EAs and scripts to the resulting chart. You get the completely operational chart which can be processed just like a regular one. The Renko Chart utility is not only history based, but also builds online. At the same time, the data is
Renko HMA
Bogdan Mihail Moise
Renko HMA  Channel is a professional EA the uses Renko charts in combination with the Hull Moving Average. Time Frame :   This expert advisor works on all timeframes; Account balance:   it doesn't matter, but I recommend at least 1000 EUR or 1500 USD; Currency pair :       Doesn't matter ; Warning! Do not use the default settings, always use optimization option in strategy tester to find the best settings for your broker, preferred chart and timeframe! - Multiple user options, for finetun
RSI TrendLine Divergency Message is an indicator for the MetaTrader 4 trading platform. Unlike the original indicator, this three in one version has a system of alerts that inform on market situation changes. It consists of the following signals: when the Main line crosses the levels of extreme zones and 50% level; when the Main line crosses the Trend line in the indicator window; divergence on the last bar. Parameters of levels of extremum, 50-level and divergence are adjustable. Parameters L
Candle GAP
Thushara Dissanayake
ローソク足ギャップ インジケーターは、曜日ごとのローソク足ギャップを自動的に識別するため、 ギャップ取引戦略を 利用するトレーダーにとって不可欠なツールです。ギャップとは、連続する 2 日間の終値と始値の間の価格レベルの差を指します。このインジケーターは、共通、離脱、継続、枯渇の 4 種類のギャップ パターンを認識します。このインジケーターをチャートに組み込むことで、トレーダーはシグナルを検証し、取引の意思決定を強化できます。 ローソク足 GAP インジケーターの重要な特徴の 1 つは、D1 (日次) の下の任意の時間枠および任意のシンボルまたは商品に対して使用できる多用途性です。使いやすいパラメータを提供し、あらゆる経験レベルのトレーダーが利用できるようになります。このインジケーターはチャート上にギャップ パターンを迅速に描画し、迅速な分析と意思決定を可能にします。そのシンプルさにより使いやすさが向上し、簡単で効率的な取引体験が保証されます。 インジケーターのデータ表示パラメーターを使用すると、トレーダーはギャップ情報の外観をカスタマイズできます。ユーザーは、各曜日に関連付けられたテ
BeST_Darvas Boxes is an MT4  Indicator based on the trading method developed in the 50’s by the Hungarian Nicolas Darvas . BeST_Darvas Boxes indicator draws the Top and the Bottom of every Darvas Box  that can be confirmed on the current Chart. draws Buy and Sell Arrows  for every confirmed Upwards or Downwards Breakout of the above levels. draws always only after the bar closing and so is non-repainting or backpainting . Note : Every customer who wants to have the older version v_1.75 with t
What you can do with CandleStick CandleStick is a useful indicator for doing MTF analysis. This indicator displays the CandleStick of another time frame on the chart . By understanding the information in multiple time charts at the same time, it is easier to understand the overall market view. It is also a useful tool for validating and studying past quotes and trades. There are similar products made by others, but I designed and developed it so that it is easy for me to use. Features of Candl
このプロダクトを購入した人は以下も購入しています
Trade Assistant MT4
Evgeniy Kravchenko
4.46 (181)
取引 ごとのリスクの 計算、新規注文 の 簡単 な 設置、部分的 な 決済機能 を 持 つ 注文管理、 7 種類 のトレーリングストップなど 、便利 な 機能 を 備 えています 。 注意、アプリケーションはストラテジーテスターでは機能しません。 Manual, Description, Download demo ライン機能 チャート上にオープニングライン、ストップロス、テイクプロフィットを表示します。この機能により、新規注文を簡単に設定することができ、注文を出す前にその特徴を確認することができます。   リスク計算 リスク計算機能は、設定されたリスクとストップロス注文のサイズを考慮して、新規注文のボリュームを計算します。ストップロスの大きさを自由に設定できると同時に、設定したリスクを守ることができます。 Lot calc ボタン - リスク 計算 を 有効 / 無効 にします 。 Risk フィールドでは 、必要 なリスクの 値 を 0 から 100 までのパーセンテージまたは 預金通貨 で 設定 します 。 設定」 タブで 、 リスク 計算 の 種類 を 選択 します :
価格が一瞬で変わる可能性のある市場では、注文はできるだけ簡単にすべきだと思いますか? Metatraderでは、注文を開くたびに、開始価格を入力し、損失を止めて利益を得るウィンドウと、取引サイズを開く必要があります。金融市場の取引では、初期預金を維持し、それを増やすために資本管理が不可欠です。それで、あなたが注文をしたいとき、あなたはおそらくあなたがどれくらいの大きさの取引を開くべきか疑問に思いますか?この単一の取引であなたの預金の何パーセントを危険にさらすべきですか?この取引からどれだけの利益を得ることができますか?また、リスクに対する利益の比率はどのくらいですか?トレードサイズを設定する前に、トレードサイズがどうあるべきかという質問に対する答えを得るために必要な計算を行います。 これらすべてを自動的に行うツールがあると想像してみてください。チャートを開き、市場分析を行い、エントリーポイント、ディフェンスポイント(ストップロス)、ターゲット(テイクプロフィット)を水平線でマークし、最後にリスクのレベルを定義します。利用可能な資本の%として、このトランザクションで負担することができ、こ
Local Trade Copier EA MT4
Juvenille Emperor Limited
5 (80)
Local Trade Copier EA MT4 による、驚くほど高速な取引コピーを体験してください。1分で簡単にセットアップできるこの取引コピー機は、同じWindowsコンピュータまたはWindows VPS上の複数のMetaTrader端末間で取引をコピーすることができ、0.5秒未満の高速コピースピードを実現します。 初心者であろうとプロのトレーダーであろうと、 Local Trade Copier EA MT4 には、あなたの特定のニーズに合わせてカスタマイズするための幅広いオプションが用意されています。これは、利益の可能性を高めたい人にとって究極のソリューションです。 今すぐ試してみて、これが市場で最も速くて簡単なトレードコピー機である理由を理解してください。 ヒント: デモアカウントで Local Trade Copier EA MT4 デモバージョンをダウンロードして試すことができます: ここ ダウンロードした無料のデモ ファイルを MT4 >> ファイル >> データ フォルダを開く >> MQL4 >> Experts フォルダに貼り付けて、ターミナルを再起動し
Exp COPYLOT CLIENT for MT4
Vladislav Andruschenko
4.66 (68)
MetaTrader4のコピー機を取引します。     それは任意の口座からの外国為替取引、ポジション、注文をコピーします。 それは最高の貿易コピー機の1つです     MT4 - MT4、MT5 - MT4     のために     COPYLOT MT4     バージョン(または     MT4 - MT5  MT5 - MT5     のために     COPYLOT MT5     バージョン)。 MT5のバージョン 完全な説明   +DEMO +PDF 購入する方法 インストールする方法     ログファイルの取得方法     テストと最適化の方法     Expforex のすべての製品 のコピー機 バージョン       MetaTrader 5 ターミナル(   МТ5 - МТ5、МТ4 - МТ5   )-   コピーロットクライアントMT5 独自のコピーアルゴリズムにより、すべての取引がマスターアカウントからクライアントアカウントに正確にコピーされます。 また、動作速度が速いことでも知られています。タフなエラー処理。 強力な機能セット。 プログ
Mentfx Mmanage
Anton Jere Calmes
5 (16)
The added video will show you the full functionality, effectiveness, and simplicity of this trade manager. Drag and Drop Trade Manager. Draw your entry and have the tool calculate the rest. Advanced targeting and close portions of a trade directly available in tool (manage trades while you sleep). Market order or limit order on either side with factored spread. Just draw the entry, the tool does the rest. Hotkey setup to make it simple. Draw where you want to enter, and the stop loss, the tool c
MT4 to Telegram Signal Provider は使いやすく、完全にカスタマイズ可能なツールで、Telegramに信号を送信し、あなたのアカウントを信号提供者に変えることができます。 メッセージのフォーマットは 完全にカスタマイズ可能です! しかし、簡単な使用のために、あらかじめ定義されたテンプレートを選択し、メッセージの特定の部分を有効または無効にすることもできます。 [ デモ ]   [ マニュアル ] [ MT5バージョン ] [ Discordバージョン ] [ Telegramチャンネル ] セットアップ ステップバイステップの ユーザーガイド が利用可能です。 Telegram APIの知識は必要ありません。開発者が必要なものをすべて提供します。 主要機能 購読者に送信される注文の詳細をカスタマイズする機能 例えばブロンズ、シルバー、ゴールドなど、階層型のサブスクリプションモデルを作成できます。ゴールドサブスクリプションでは、すべての信号が得られますなど。 ID、シンボル、またはコメントによる注文のフィルタリング 注文が実行されたチャート
TradePanel MT4
Alfiya Fazylova
4.91 (88)
Trade Panel は、多機能の取引アシスタントです。 このアプリケーションには手動取引用の 50 以上の機能が含まれており、ほとんどの取引アクションを自動化できます。 購入する前に、デモ アカウントでデモ バージョンをテストできます。 デモは こちら から。 詳しい手順は こちら をご覧ください。 アプリケーションは、相互接続された一連のパネルとして設計されています。 取引パネル 基本的な取引操作を実行するように設計されています: 未決の注文とポジションをオープンする 未決の注文とポジションを決済する 立場の逆転。 位置をロックします。 ワンクリックですべてのポジションの部分決済を実行します。 ワンクリックで、すべてのポジションの利食いやストップロスを共通のレベルに設定します。 ワンクリックで、すべてのポジションのストップロスを損益分岐点レベルに設定します。 注文とポジションをオープンするときは、次のことができます。 確立されたリスクに応じて取引量の自動計算を使用します。 ワンクリックで複数の注文を開きます。 計算された数量を複数の注文に分割します(計算された数量が注文あたりの最
Trade copier MT4
Alfiya Fazylova
4.67 (30)
Trade Copierは、取引口座間の取引をコピーして同期するように設計された専門的なユーティリティです。 コピーは、同じコンピューターまたはvps にインストールされている、サプライヤーのアカウント/端末から受信者のアカウント/端末に行われます。 購入する前に、デモ アカウントでデモ バージョンをテストできます。 デモ版 こちら 。 詳細な説明は こちら 。 主な機能と利点: MT5ネッティングアカウントを含む、MT4> MT4、MT4> MT5、MT5> MT4のコピーをサポートします。 高いコピー速度(0.5秒未満)。 ベンダーモードと受信者モードは同じ製品内に実装されています。 チャートから直接リアルタイムでコピーを制御できる、簡単で直感的なインターフェイス。 接続が切断されたり、端末が再起動されたりしても、設定と位置が失われることはありません。 コピーするシンボルを選択できます。また、受信者のシンボルを置き換えることもできます(例:EURUSD> USDJPY)。 バックコピーをサポートします。 特定の注文のみのコピーを有効にする機能。 取引開始価格の最大差と最大遅延時間を
VirtualTradePad mt4 Extra
Vladislav Andruschenko
4.85 (62)
ワンクリックで取引できるトレーディングパネル。ポジションと注文の操作!チャートまたはキーボードから取引。 手動取引用の取引パネル。チャート(チャートウィンドウ)またはキーボードから取引できます。開閉、リバース、ロックポジションと注文を処理する МetaТrader4のメインオーダーのトレーディングコントロールパネル:売買、売却、売却、売却、売却、閉じる、削除、修正、トレーリングストップ、ストップロス、takeproft MT5のバージョン 完全な説明   +DEMO +PDF 購入する方法 インストールする方法     ログファイルの取得方法     テストと最適化の方法     Expforex のすべての製品 シンボルウィンドウからの取引とキーボードからの取引! あなたはMetaTrader 4ターミナル - バーチャルコントロールパネルVirtualTradePadのためのユニークなプラグインを持っています。 Description on English 注意!  ストラテジーテスターの 取引方法を学びたい場合は、無料の TesterPad ユーティリティをチェック
The product will copy all telegram signal to MT4   ( which you are member  ) , also it can work as remote copier.  Easy to set up, copy order instant, can work with almost signal formats, image signal, s upport to translate other language to English Work with all type of channel or group, even channel have "Restrict Saving Content", work with  multi channel, multi MT5 Work as remote copier: with signal have ticket number, it will copy exactly via ticket number. Support to backtest signal. How to
MT4 Alert Signal Trader  is an EA that helps you trade MT4 Alert popup. Some indicators can provide signals by showing an alert popup containing signal texts. This EA will read and trade these signal texts. The alert texts should contain at least 2 elements:  (1) a symbol text   (ex: "EURUSD") and  (2) a command type   (ex: "Buy", "Sell", "Close") that trigger EA's trading activities. Some other contents that may have or not are open price, stop loss, take profit values... The EA needs an aweso
あなたがメンバーである任意のチャンネル(プライベートおよび制限されたチャンネルを含む)からのシグナルを、直接あなたのMT4にコピーします。 このツールは、ユーザーを念頭に置いて設計されており、取引を管理および監視するために必要な多くの機能を提供しています。 この製品は、使いやすく視覚的に魅力的なグラフィカルインターフェースで提供されています。設定をカスタマイズして、数分で製品を使用開始できます! ユーザーガイド + デモ  | MT5版 | Discord版 デモを試したい場合は、ユーザーガイドを参照してください。 Telegram To MT5レシーバーは、ストラテジーテスターでは機能しません! Telegram To MT4の特長 一度に複数のチャンネルからシグナルをコピー プライベートおよび制限されたチャンネルからシグナルをコピー BotトークンやチャットIDは不要です(必要な場合は引き続き使用できます) リスク%または固定ロットを使用して取引 特定のシンボルを除外 すべてのシグナルをコピーするか、コピーするシグナルをカスタマイズするかを選択 すべてのシグナルを認識する
FREE SIGNAL CHANEL:  https://t.me/redfox_daily_forex_signals Time saving and fast execution Whether you’re traveling or sleeping, always know that Telegram To Mt4 performs the trades for you. In other words, Our   Telegram MT4 Signal Trader  will analyze the trading signals you receive on your selected Telegram channels and execute them to your Telegram to MT4 account. Reduce The Risk Telegram To Mt4   defines the whole experience of copying signals from   Telegram signal copier to mt4  p
Tired of complex order placement and manual calculations? Trade Dashboard is your solution. With its user-friendly interface, placing orders becomes effortless, by a single click, you can open trades, set stop loss and take profit levels, manage trade lot size, and calculate risk to reward ratios, allowing you to only focus on your strategy. Say goodbye to manual calculations and streamline your trading experience with Trade Dashboard. Download   demo version  right now. You can find details
The Best One Scalping Trade Panel functional manual trade panel with risk reward, auto SL by candle ( original solution), lot size calculation, one-click trading, scale in and out of trades (partial close),  Works with all symbols not just currency pairs, perfect works on DAX, NASDAQ, GOLD, ...... I earn every day during live stream on ZakopiecFX - join Me Risk by lot Risk by percent SL by points SL by Candle, Renko, RangeBar ( original solution) TP by point TP by Risk/Reward Auto Trailing b
Take a Break
Eric Emmrich
4.93 (28)
The most advanced news filter and drawdown limiter on MQL market NEW: Take a Break can be backtested against your account history! Check the " What's new " tab for details. Take a Break has evolved from a once simple news filter to a full-fledged account protection tool. It pauses any other EA during potentially unfavorable market conditions and will continue trading when the noise is over. Typical use cases: Stop trading during news/high volatility (+ close my trades before). Stop trading when
Trade Manager は、リスクを自動的に計算しながら、取引を迅速に開始および終了するのに役立ちます。 過剰取引、復讐取引、感情的な取引を防止する機能が含まれています。 取引は自動的に管理され、アカウントのパフォーマンス指標はグラフで視覚化できます。 これらの機能により、このパネルはすべてのマニュアル トレーダーにとって理想的なものとなり、MetaTrader 4 プラットフォームの強化に役立ちます。多言語サポート。 MT5バージョン  |  ユーザーガイド + デモ Trade Manager はストラテジー テスターでは機能しません。 デモについてはユーザーガイドをご覧ください。 危機管理 % または $ に基づくリスクの自動調整 固定ロットサイズを使用するか、ボリュームとピップに基づいた自動ロットサイズ計算を使用するオプション RR、Pips、または価格を使用した損益分岐点ストップロス設定 トレーリングストップロス設定 目標に達したときにすべての取引を自動的に終了するための 1 日あたりの最大損失 (%)。 過度のドローダウンからアカウントを保護し、オーバートレードを防ぎま
Grid Manual MT4
Alfiya Fazylova
4.71 (17)
「Grid Manual」は、注文のグリッドを操作するための取引パネルです。 ユーティリティはユニバーサルで、柔軟な設定と直感的なインターフェイスを備えています。 それは、損失を平均化する方向だけでなく、利益を増やす方向でも注文のグリッドで機能します。 トレーダーは注文のグリッドを作成して維持する必要はありません。 すべてが「Grid Manual」によって行われます。 注文を開くだけで十分であり、「Grid Manual」は注文のグリッドを自動的に作成し、非常に閉じるまでそれに付随します。 ユーティリティの主な機能と機能 ユーティリティは、モバイル端末から開かれた注文を含め、あらゆる方法で開かれた注文を処理します。 「制限」と「停止」の2種類のグリッドで機能します。 グリッド間隔の計算には、固定と動的(ATRインジケーターに基づく)の2つの方法で機能します。 オープンオーダーグリッドの設定を変更できます。 チャート上の各注文グリッドの損益分岐点を表示します。 各注文グリッドの利益率を表示します。 ワンクリックでグリッドから収益性の高い注文を閉じることができます。 ワンクリックで各注文
あなたの外国為替ポートフォリオを管理してください。あなたが立っている場所、何が働いているのか、そして何があなたに痛みを引き起こしているのかを即座に見てください! ここで利用可能なMT5バージョン:https:// www.mql5.com/en/market/product/58658 Trade Managerダッシュボードは、外国為替市場での現在の各ポジションが一目でわかるように設計されており、リスク管理と通貨へのエクスポージャーを理解しやすくします。 複数のポジションで徐々に市場に参入するトレーダー、またはそれらのトレーディンググリッドとバスケット戦略にとって、これは重要な情報です。ターミナル内の複数の位置を監視することは、管理が難しいことがよくあります。 不十分なリスクの活用と使用:報酬は、新しいトレーダーや一部の経験豊富なトレーダーが直面する主要な問題です。トレードマネージャーは、各通貨へのエクスポージャーを個別に示し、一度に両方向に取引しないようにします。 特徴: オープントレード-通貨ペアでソートされた現在のオープントレードをすべて表示します。ペアだけでなく
The top-selling EAs on the market cost a lot and one day they are suddenly gone. This is because one strategy will not work in the forex market all the time. Our product is unique from all others in the MQL Marketplace because our EA comes with 34+ built-in indicators that allow adding more strategies every time.  You build your strategy and keep updating it. If one strategy does not work, simply build another all using only one EA. This is All-In-One EA in this market place. You can use as trad
-25% discount ($199 -> $149) Advanced trading tool: One click smart orders that execute under your conditions Developed by trader for trading community:  position size calculator (lot size), open position after price action, strategy builder, set and forget trading, mobile notifications... Risk Management -  Risk percentage position size calculator, gain percentage, target risk reward ratio, spread and commissions are included in calculations 7 Advanced order types   - Set and forget trading
Equity Shield
Vladimir Stepanov
4.63 (8)
Expert Advisor は、資産を常に監視し、パラメーターの入力に従ってルールに従うことで、予期しない損失からアカウントを保護します。 ルールに違反すると、EA はすべての取引を終了します。 特定のパーセンテージまたは金銭的損失ですべての取引をクローズするか、特定のパーセンテージまたは金銭的利益でクローズするように EA を設定できます。 このユーティリティは、プロップ トレーディング チャレンジでドローダウンを低く抑え、エクイティを保護するのに非常に役立ちます。 私の信号と他の製品はここにあります 応援、プレゼントは購入後ご連絡ください。 パラメーター: 1ペア限定:運用したいペアにEquity Guardを貼る アカウントのすべてのペアについて: Equity Shield は端末のすべてのペアを制御します (Equity Shield を任意のペアに配置します)。 TPアットマネー(0:OFF):TPインマネー SL アット マネー (0: オフ): SL アット マネー TP at % at account Equity: TP は、口座の X パーセントの利益で取
This trade copy utility allows you to instantly and seamlessly replicate and synchronize unlimited orders from multiple master accounts to multiple slave accounts on your local machine. You can create custom channels (or portfolios) with advanced filtering capabilities to copy from multiple master accounts to multiple slave accounts. Moreover, you can tailor these channels with a range of lot sizing and trade condition options to ensure that copied trades outperform the original source. You can
This EA Utility allows you to manage (with advanced filtering) unlimited open orders (manual or EA) with 16 trailing stop methods: fixed, percent, ATR Exit, Chandelier Exit, Moving Average, Candle High Low Exit, Bollinger Bands, Parabolic, Envelope, Fractal, Ichimoku Kijun-Sen, Alligator, Exit After X Minutes or Bars, RSI and Stochastic. The trailing stop can be either real or virtual, and you can exit fully or with a partial close percent on touch or bar close.  Moreover, you can add (overr
MT4端末のための事前設定された注文と自動ロット計算と取引パネル。 注意:ストラテジーテスターではトレーディングパネルは機能しません(トレーリングストップのテストのみ)。 マニュアル, 説明, ライトデモのダウンロード. 成功したトレーダーは、自己規律と有能なお金の管理によって区別されます。 固定ロットを使用すると、危険にさらされます。 結局のところ、異なる時間枠には異なる距離があり、1つの不採算取引がいくつかの収益性の高い取引をカバーすることができます。 各トランザクションのストップロスが預金の1%を超えないように自動ロットを使用する場合は、この問題を解決します。 また、トレーダーは部分的な閉鎖、損益分岐点への取引の移転、トレーリングストップを使用し、チャート上の過去の取引を分析します。 十分なニュアンスがあるので、私は取引パネルを書くことにしました。 私の好みのために、それは非常に機能的で快適であることが判明しました。 取引パネルの機能 。 任意のアカウントと通貨での作業 。 ロット計算のための注文の視覚的なプリセット 。 ロット計算のための保留中の注文の視覚的なプリセット 。
MT4 to Discord Signal Provider は、Discord へ直接トレーディングシグナルを送信するために設計された、使いやすく完全にカスタマイズ可能なユーティリティです。このツールは、あなたのトレーディングアカウントを効率的なシグナルプロバイダーに変えます。 スタイルに合わせてメッセージフォーマットをカスタマイズ!利便性を考え、事前にデザインされたテンプレートから選択し、メッセージのどの要素を含めるか除外するかを選択できます。 [ デモ ] [ マニュアル ] [ MT5 バージョン ] [ Telegram バージョン ] セットアップ 簡単なセットアップのために、私たちの詳細な ユーザーガイド に従ってください。 Discord API の事前知識は必要ありません。必要なツールはすべて提供されます。 主な特徴 購読者の更新のための注文詳細をカスタマイズ。 ブロンズ、シルバー、ゴールドなど、各レベルで異なるシグナルアクセスを提供する階層的サブスクリプションモデルを実装。 注文が実行されたチャートのスクリーンショットを添付。 これらのスクリーンショットに表
Comprehensive on chart trade panel with the unique ability to be controllable from mobile as well. Plus has a library of downloadable configuration, e.g. exit rules, extra panel buttons, pending order setup and more. Please see our product video. Works with all symbols not just currency pairs. Features On chart panel plus controllable from free app for Windows, iPhone and Android Built-in script engine with library of downloadable configuration, e.g. add 'Close All Trades in Profit' button, exit
-  Version MT5  (Coming soon) An instrument capable of instantly calculating position size or risk based on a specified stop-loss level is critically important for both professional traders and beginners. Trading utility  TRADE PRO   provides fast and accurate calculations, helping you make decisions in conditions of limited time and increased market volatility. Main functions: Original. Simple. Effective. Original and convenient opening of the main trading panel: Simply hover your mouse over th
The program is use to copy trading from MT4   to MT4 and MT5  on local PC or copy  over the Internet.   Now you can easy copy trades to any where or share to friends. Only run one Flash Server on VPS, also need allow the apps if you turn on Windows Firewall. Can not add more than 20 account copier to server, include both  MT4 and MT5 Get free Copier EA for MT4 and MT5 (only  receive signal),   download here Instants copy, speed smaller 0.1 seconds, easy to setup How to setup and guide Let read a
EA Hedger
Sergej Chukhista
4.67 (3)
トレーディングアドバイザーを購入したり、シグナルをサブスクライブしたり、手動でトレードしたりしましたか?!リスク管理を忘れないでください。 EA Hedger は、ヘッジを使用してリスクを管理できるようにする多くの設定を備えたプロのトレーディングユーティリティです。 ヘッジは、すでに開いているポジションとは反対のポジションを開くことを含む取引手法です。ヘッジの助けを借りて、ポジションを完全にまたは部分的にブロック(ロック)することができます。 この製品を購入することが有益なのはなぜですか。 信頼性 -アドバイザーは徹底的にチェックされ、テストされています 有用性 -Expert Advisorは実際の取引で使用され、その作業に効果的です パフォ ーマンス-ヘッジを使用した取引の結果は、ヘッジなしの取引の結果よりも大幅に優れています 可用性 -アドバイザーのコストは1か月あたりわずか4.91ドルまたは1日あたり0.17ドルです-これは1〜2スプレッドです サポート –ディスカッションでは、販売者に質問したり、アドバイスを受けたりすることができます 開発 -製品への希望を書くことが
作者のその他のプロダクト
Data Extractor (DE) is designed to extract symbol price movement data and save it to file. It's a simple tool, designed to be used in combination with other software. SETTINGS (INPUTS) Period_in_days - How many days of data for Data Extractor to process (including non-work days).  File extension - Defines the type of file in which data will be saved. CSV is readable for a human, HST and BIN are binary data intended for machine reading. File name (without extension) - User defined part of file
FREE
フィルタ:
レビューなし
レビューに返信
バージョン 1.10 2024.02.04
Fixed Period selector - Now works when online custom charts are inactive.
Fixed Custom Time input - First value of user input in the Second custom input wasn't counted correctly.