Session Range Highlight 4 Price Action SMC
- インディケータ
- Pham Tien Thanh
- バージョン: 1.2
- アップデート済み: 3 1月 2024
- アクティベーション: 5
🌟 Session Range Highlight インジケーター紹介 🌟
Session Range Highlight インジケーターで、外国為替取引の精密な力を解き放ちましょう。このツールは、取引体験をシンプルにすることを目的としており、セッションの高値と安値を手軽に見つける鍵です。
主な特徴:
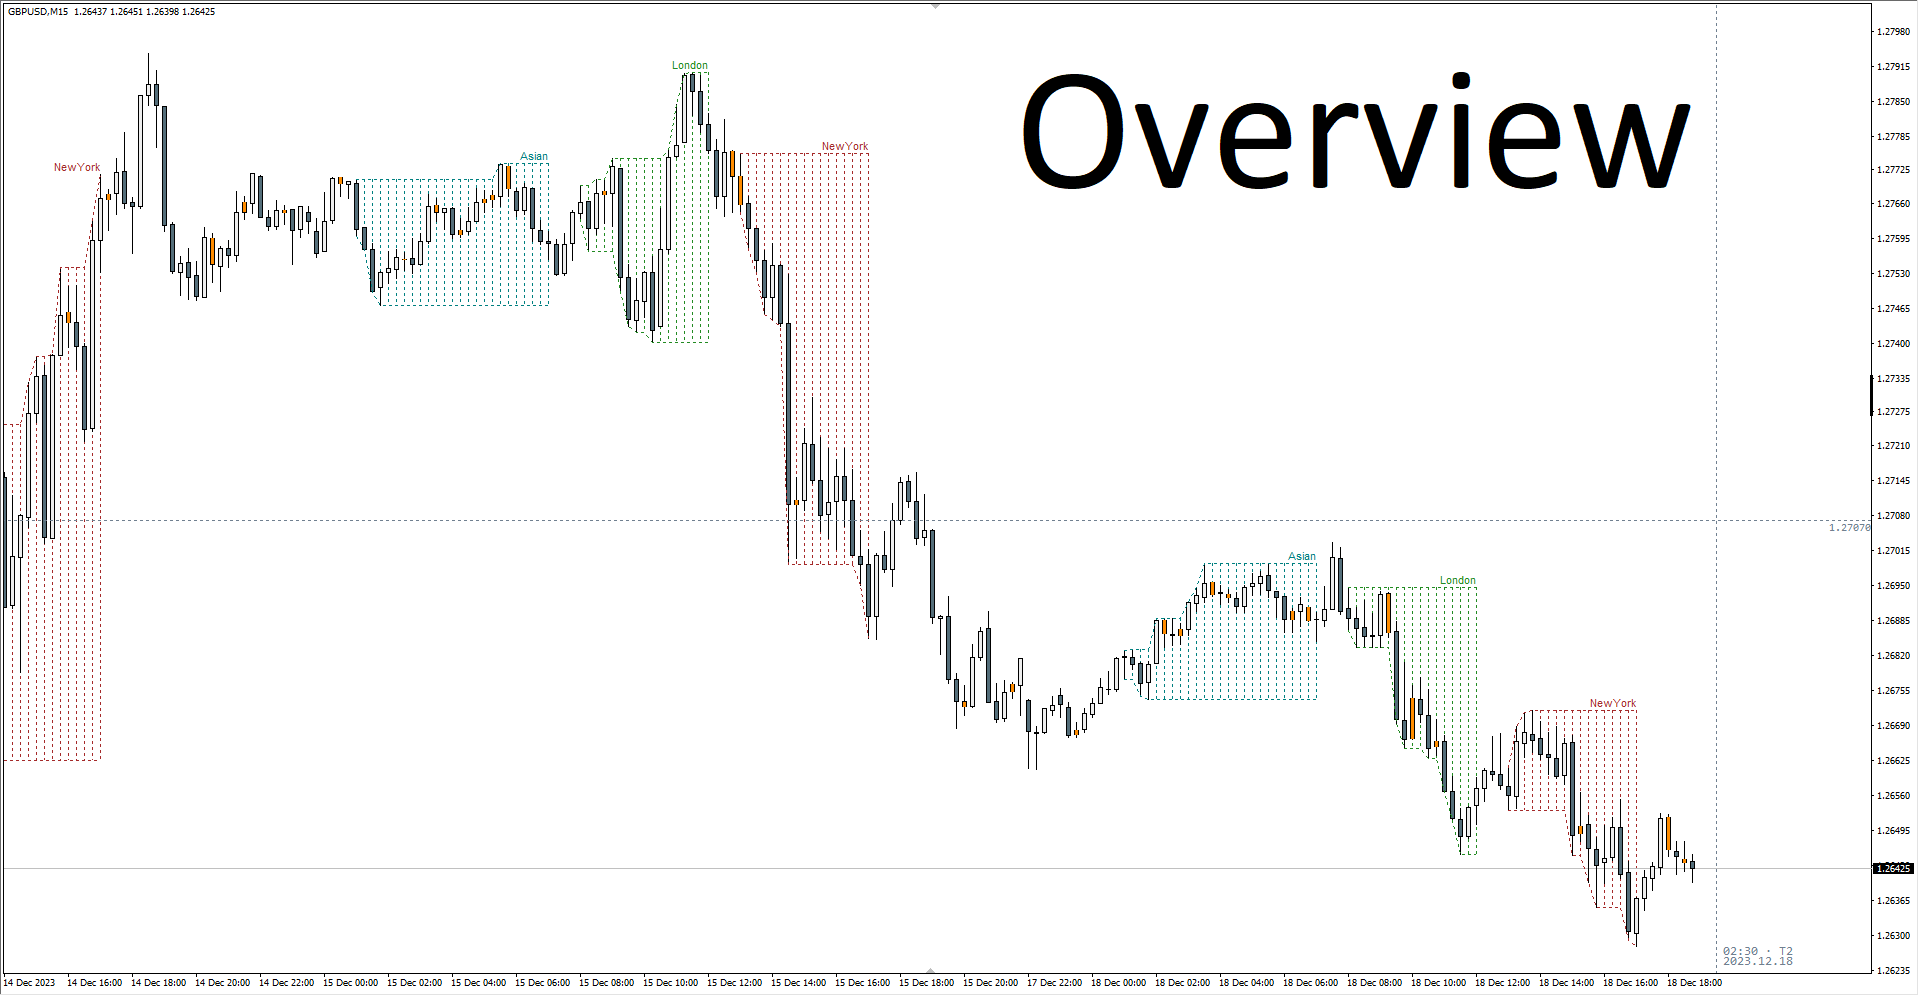
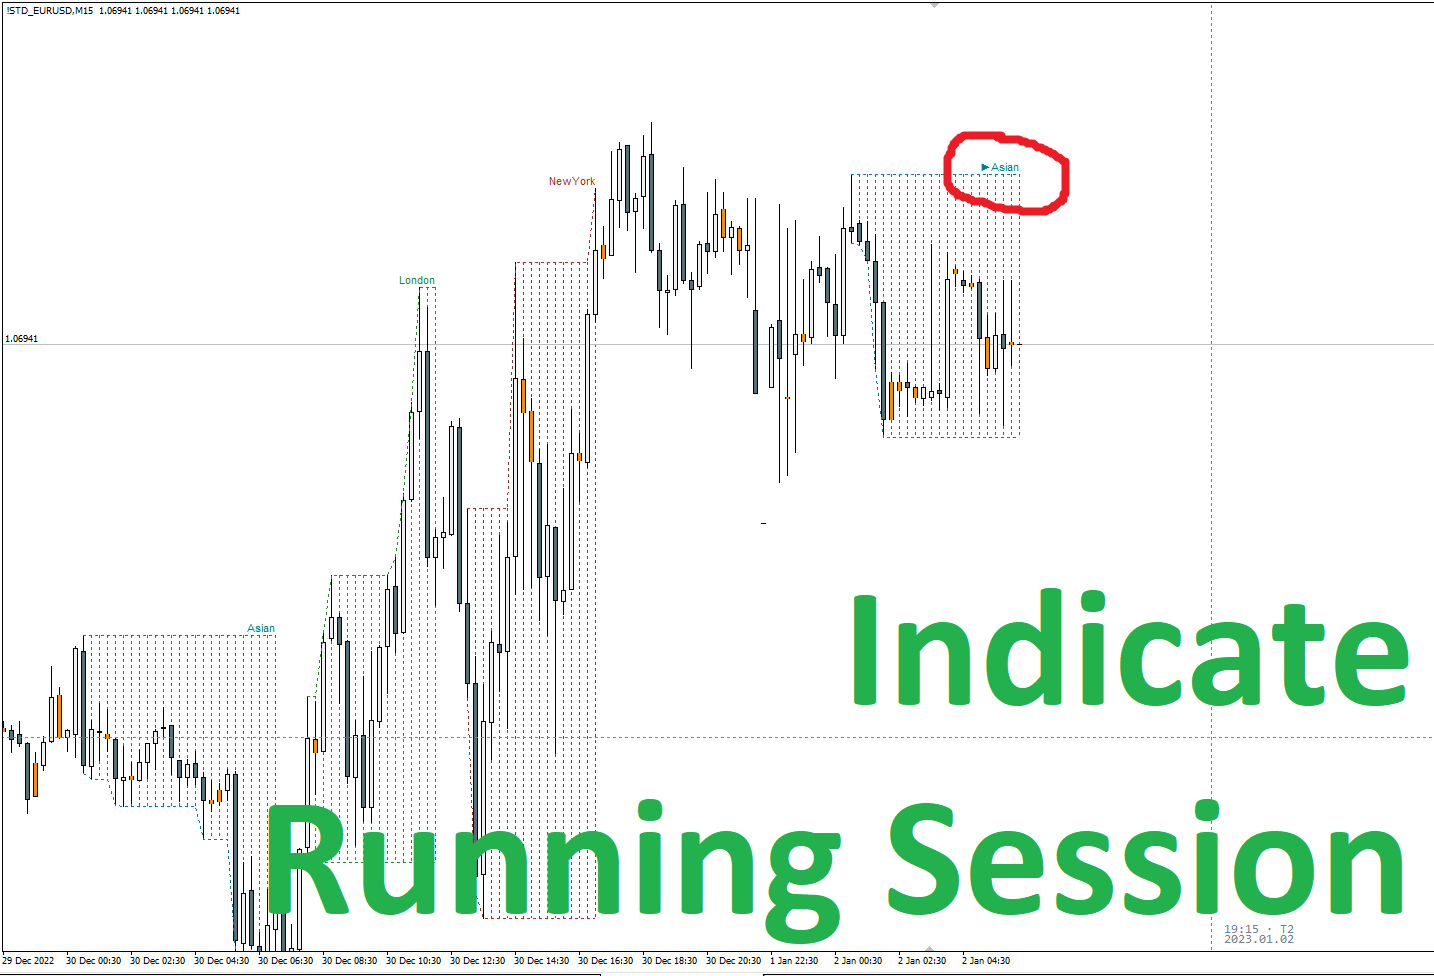
📊 明瞭なセッションの視覚化:
- チャート上でセッションの範囲を簡単に識別し、視覚化します。
- 特定の市場セッション中の重要な価格水準をピンポイントで把握し、トレード戦略を向上させます。
🎨 シンプルで洗練されたデザイン:
- シンプルな美しさ - 当社のインジケーターは洗練されたユーザーフレンドリーなデザインを誇ります。
- 機能性を損なうことなく、セッションの範囲を視覚的に魅力的に表示します。
📈 簡単にセッションの極値を見つける:
- 各取引セッション内で最高値と最安値を即座に認識します。
- 強調表示されたセッションの範囲を一目で見て、情報を基にトレードの決断を行います。
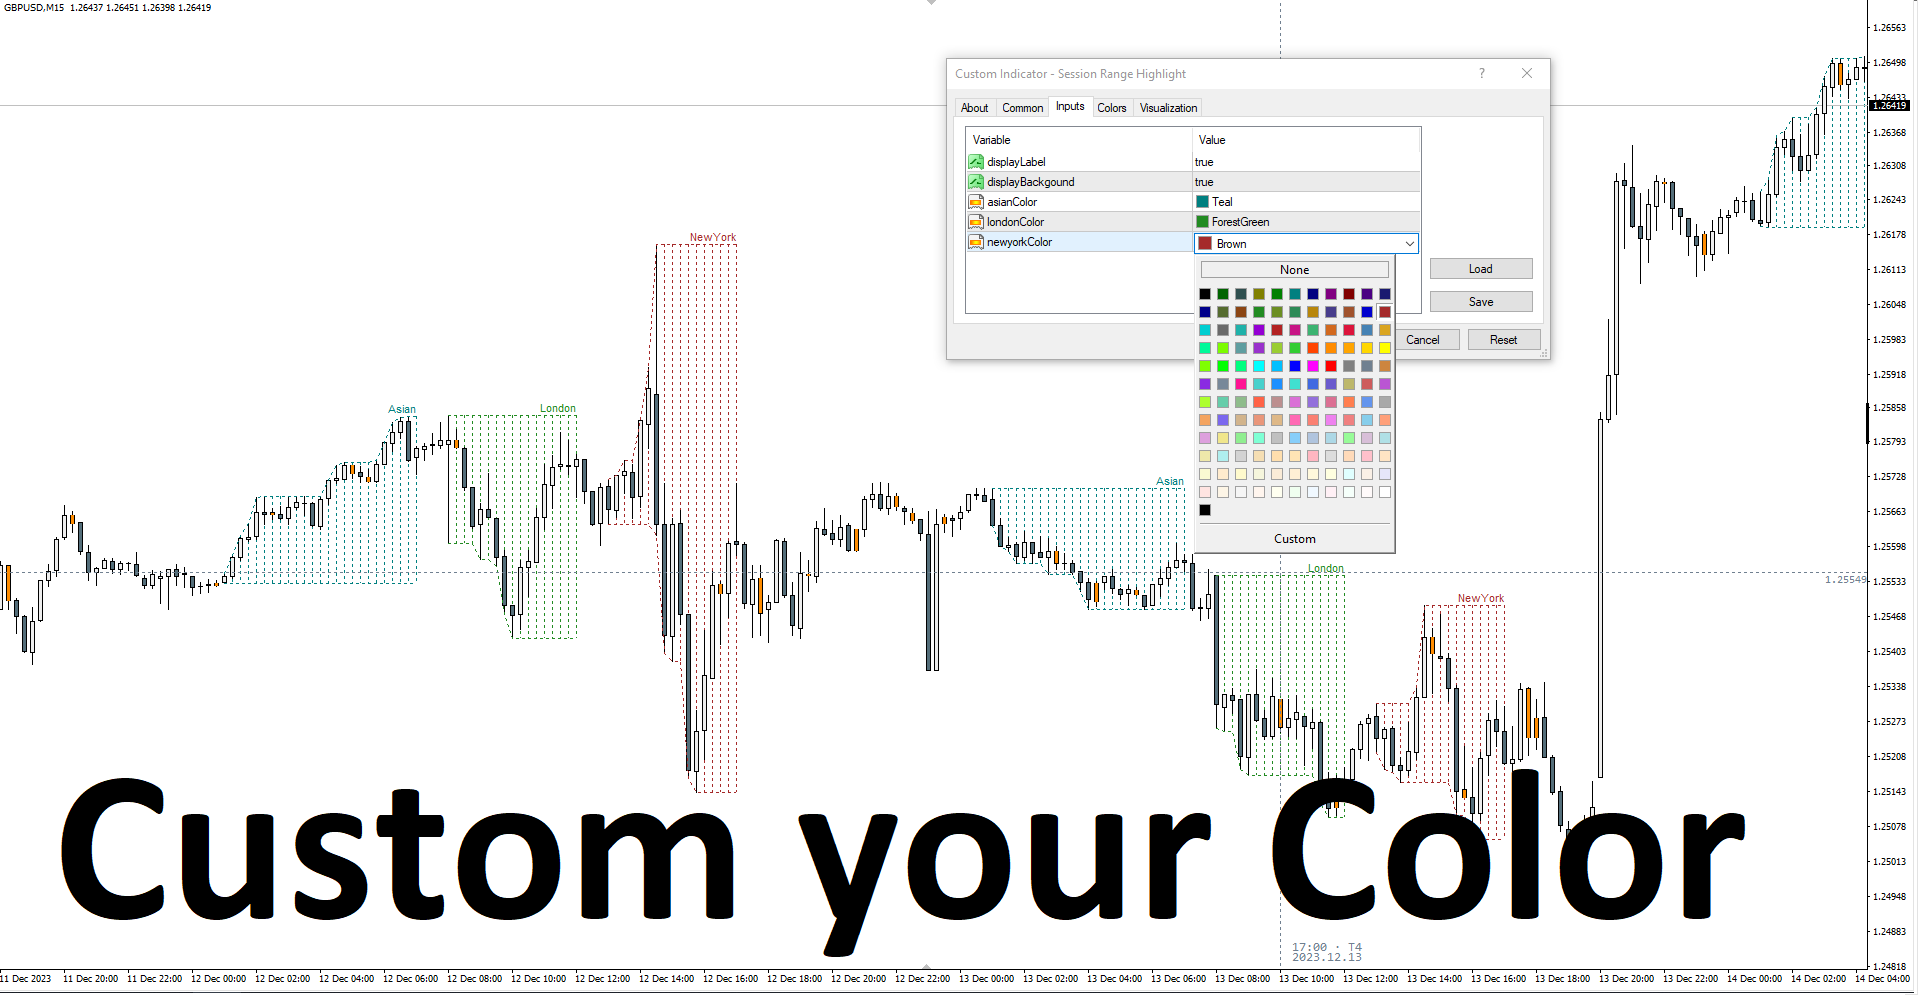
🛠️ 簡単なカスタマイズ:
- カスタマイズ可能な設定でインジケーターを自分好みに調整します。
- お好みに合わせた色やスタイルを選択します。
🌐 互換性:
- 人気のある取引プラットフォームとのシームレスな統合で、ストレスのない取引体験を提供します。
Session Range Highlight インジケーターで取引戦略の潜在力を引き出しましょう。これは単なるインジケーターではなく、セッション分析のマスタリーに向けたビジュアルガイドです。
🛒 Meta Market で今すぐ入手して、取引体験を向上させましょう!
🙏 Session Range Highlight をお選びいただき、誠にありがとうございます。ハッピートレード!