Major Support and Resistance Indicator
- インディケータ
- Ahmad Ar Abedalaziz Alazaizeh
- バージョン: 1.0
This indicator filters the Zigzag indicator to calculate the main support and resistance
levels.
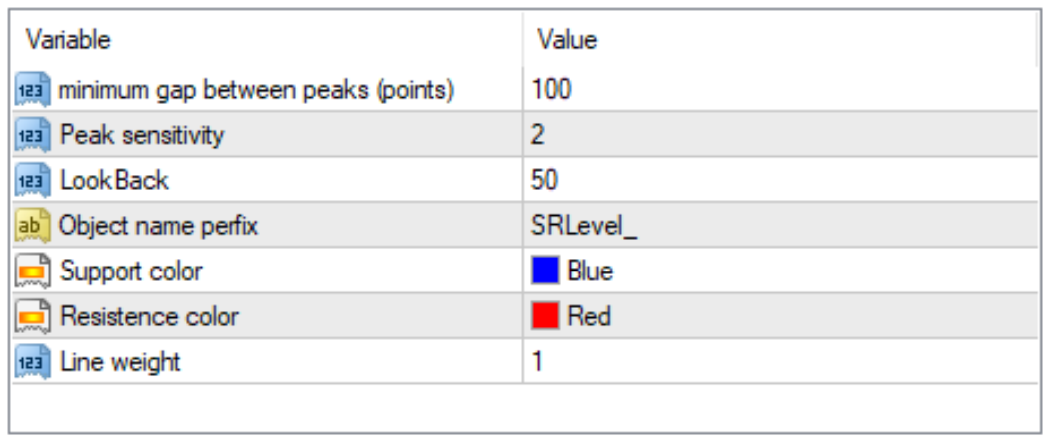
Variables
● minimum gap between peaks : is the distance (GAP) between the peaks of
the Zigzag
● peaks sensitivity : Minimum number of nearby peaks
● look back: it means that it has to test the last 50 peaks in the Zigzag
● object name perfix: a prefix for level’s line name on chart
levels.
Variables
● minimum gap between peaks : is the distance (GAP) between the peaks of
the Zigzag
● peaks sensitivity : Minimum number of nearby peaks
● look back: it means that it has to test the last 50 peaks in the Zigzag
● object name perfix: a prefix for level’s line name on chart