TradeighT
- Indicatori
- Lorenzo Monari
- Versione: 17.12
- Aggiornato: 4 gennaio 2024
- Attivazioni: 5
⭐ Lo strumento identifica il movimento reale che il mercato utilizza, con veri e propri calcoli matematici sulla base delle variazioni di prezzo.
⭐ L'esecuzione di commerciotto si basa proprio su questa relazione matematica che esiste da sempre.
⭐ La maggior parte degli investitori guarda le stesse cose, e studia le stesse informazioni, motivo per cui la maggioranza è in perdita.
⭐ E' un prodotto basato non sulle idee della maggioranza ma sulle 4 basi reali che reggono il mercato.
⭐ Lo strumento è uno strumento visivo, facile da capire e semplice da usare, disponibile per tutti i simboli backtestabili.
Esclusiva per MT4.
L'indicatore usa livelli di prezzo ad alta reazione:
☆ fornisce i prezzi dei take-profit attuali
☆ fornisce livelli da utilizzare con l'analisi tecnica
☆ fornisce zigzag
☆ fornisce il trend attuale
☆ fornisce obiettivi ad alta % di successo
________________________________________________________________________________________________________________________________________________
TRENDLINE (selezionabili)
Trendline Orizzontale Non Permanente Buy
- numerate da 1 a 5
- colore modificabile da Proprietà Indicatore
- prezzo da utilizzare come takeprofit in un'ordine Buy
Trendline Orizzontale Non Permanente Sell
- numerate da 1 a 5
- colore modificabile da Proprietà Indicatore
- prezzo da utilizzare come takeprofit in un'ordine Sell
Trendline Orizzontale Permanente
- da utilizzare come supporto o resistenza
Trendline Verticale
- da utilizzare come riferimento temporale per l'inizio di una Trendline Orizzontale Non Permanente
METRICA GENERALE
Ogni Numero è legato a una candela.
Ogni Numero ha la propria Trendline Orizzontale Non Permanente.
Ogni Trendline Orizzontale Non Permanente ha la propria Trendline Verticale.
Quando la Trendline Orizzontale Non Permanente viene toccata dal prezzo, scompare.
Quando scompare una Trendline Orizzontale Non Permanente, il Numero e la Trendline Verticale legata a quella Trendline Orizzontale Non Permanente, scompariranno.
Se una Trendline Orizzontale Non Permanente scompare prima di essere toccata dal prezzo, nella direzione opposta comparirà una nuova Trendline Orizzontale Non Permanente con il Numero successivo.
________________________________________________________________________________________________________________________________________________
LINEE VERTICALI
Linea Verticale Buy
- colore della Trendline Orizzontale Non Permanente Buy
- indica un Trend Buy
Linea Verticale Sell
- colore della Trendline Orizzontale Non Permanente Sell
- indica un Trend Sell
________________________________________________________________________________________________________________________________________________
OPERATIVITÀ
Lo strumento fornisce tutte le informazioni necessarie per individuare con estrema precisione i futuri movimenti del prezzo,
con la possibilità di analizzare lo storico per ricerca e statistica.
Oltre a fornire tutti i dettagli necessari per un'analisi completa, lo strumento genera segnali ad alta % di successo.
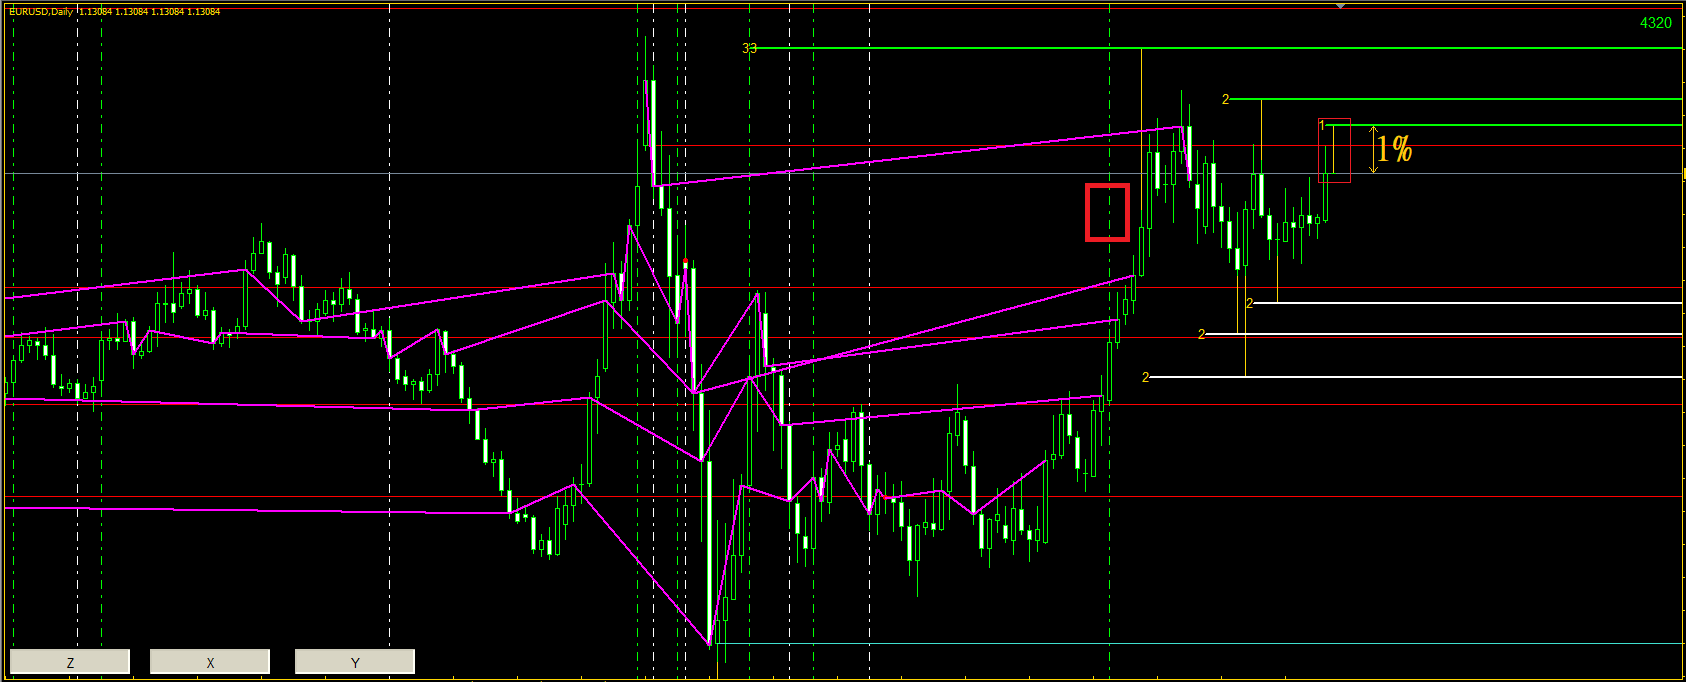
L'ultima Linea Verticale indica l'attuale Trend.Segnale Buy
Se Trend Buy,
se la Trendline Verticale attuale ha solo una Trendline Orizzontale Non Permanente Buy 1 (TP1), utilizzare il TP1 Segnale Buy come obiettivo.
Calcolare il volume dell'investimento in base alla portata del movimento, per un valore monetario del movimento, dell' 1% del capitale.
Esempio nelle immagini.
Se il TP1 Segnale Buy dovesse scomparire prima di essere stato toccato dal prezzo, scegliere se:
- cambiare direzione all'investimento usando il TP2 come nuovo obiettivo
- interrompere la serie e aspettare un nuovo TP1 Segnale Buy
- chiudere l'investimento
La gestione monetaria gioca un ruolo importante, dove l' investitore ha la possibilità di scegliere se:
- recuperare la perdita del TP1 Segnale Buy con i TP successivi di quella candela (TP2,TP3..)
- recuperare la perdita del TP1 Segnale Buy con il successivo TP1 Segnale Buy
- incassare la perdita
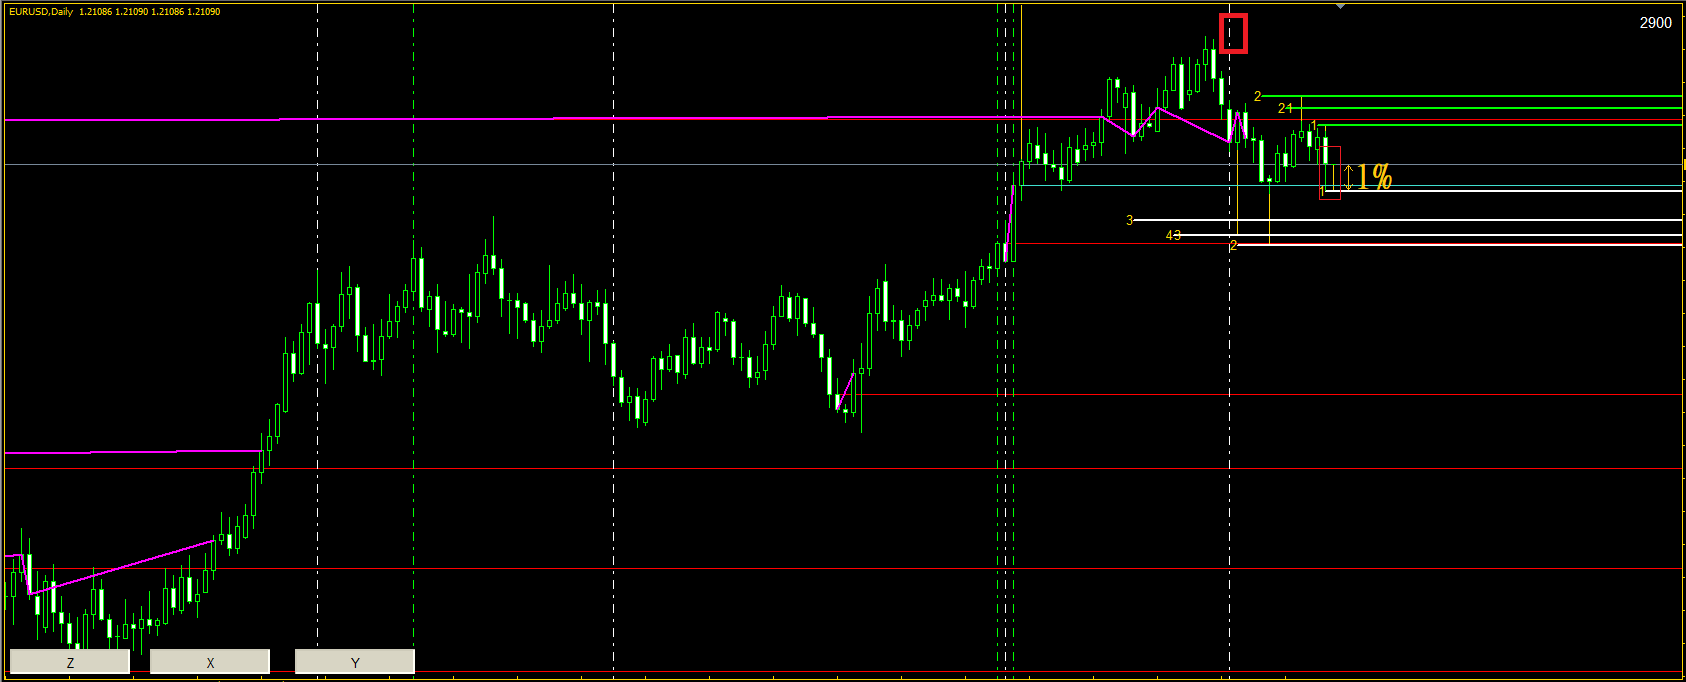
Segnale Sell
Se Trend Sell,
se la Trendline Verticale attuale ha solo una Trendline Orizzontale Non Permanente Sell 1 (TP1), utilizzare il TP1 Segnale Sell come obiettivo.
Calcolare il volume dell'investimento in base alla portata del movimento, per un valore monetario del movimento, dell' 1% del capitale.
Esempio nelle immagini.
Se il TP1 Segnale Sell dovesse scomparire prima di essere stato toccato dal prezzo, scegliere se:
- cambiare direzione all'investimento usando il TP2 come nuovo obiettivo
- interrompere la serie e aspettare un nuovo TP1 Segnale Sell
- chiudere l'investimento
La gestione monetaria gioca un ruolo importante, dove l' investitore ha la possibilità di scegliere se:
- recuperare la perdita del TP1 Segnale Sell con i TP successivi di quella candela (TP2,TP3..)
- recuperare la perdita del TP1 Segnale Sell con il successivo TP1 Segnale Sell
- incassare la perdita
________________________________________________________________________________________________________________________________________________
IMPOSTAZIONI
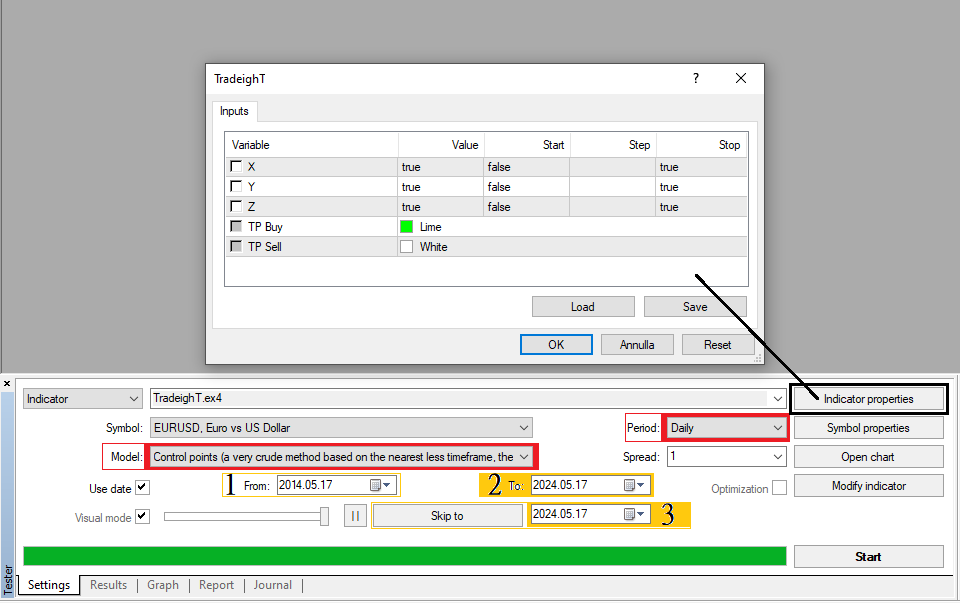
Possibilità di attivare e disattivare oggetti, prima del backtest da Proprietà Indicatore, dopo e durante il backtest tramite i Pulsanti sul grafico:
- X = Trendline Orizzontali Permanenti
- Y = Linee Verticali
- Z = ZigZag
Per avere lo stesso Formato ad ogni backtest, aprire un nuovo simbolo, modificare colori e caratteristiche, e salvare il Formato come tester.tpl
-(1)- Per un'analisi completa, usare come data di inizio backtest 10 anni prima rispetto alla data attuale.
-(2)- Aggiungere 1 mese in più alla data attuale, e utilizzarla come data di fine backtest.
-(3)- Per velocizzare il backtest premere il pulsante Saltare a, inserendo la data uguale a quella di fine backtest.
Consulta le immagini per ulteriori dettagli.
________________________________________________________________________________________________________________________________________________
L'utente non ha lasciato alcun commento sulla valutazione.