TradeighT
- 指标
- Lorenzo Monari
- 版本: 17.12
- 更新: 4 一月 2024
- 激活: 5
⭐ 该工具根据价格变化,利用真实的数学计算方法识别市场真实走势。
⭐ Tradeight 的执行基于一直存在的数学关系。
⭐ 大多数交易者看到相同的事物,研究相同的信息,这就是大多数人亏损的原因。
⭐ 该产品不是基于大多数人的想法,而是基于支配市场的4个真正基础。
⭐ 该工具是一个可视化工具,易于理解,简单易用,适用于所有可回测的符号。
专为 MT4 打造。
该指标使用高反应价格水平:
☆ 提供当前获利价格
☆ 提供用于技术分析的水平
☆ 提供锯齿形走势
☆ 提供当前趋势
☆ 提供高成功率的目标
________________________________________________________________________________________________________________________________________________
趋势线 (可选)
水平非永久性买入趋势线
- 编号从1到5
- 可从指标属性编辑颜色
- 用作 买入 订单的获利价格
水平非永久性卖出趋势线
- 编号从1到5
- 可从指标属性编辑颜色
- 用作 卖出 订单的获利价格
水平永久性趋势线
- 用作支撑或阻力
垂直趋势线
-
用作 水平非永久性趋势线 开始的时间参考
________________________________________________________________________________________________________________________________________________
一般指标
每个 数字 与一根蜡烛线相关。
每个 数字 都有自己的 水平非永久性趋势线 。
每条 水平非永久性趋势线 都有自己的 垂直趋势线 。
当价格触及 水平非永久性趋势线 时,该 趋势线 消失。
当一条 水平非永久性趋势线 消失时,与该 水平非永久性趋势线 相关的 数字 和 垂直趋势线 也会消失。
如果 水平非永久性趋势线 在价格触及之前消失,则下一个 数字 的新 水平非永久性趋势线 将出现在相反方向。
________________________________________________________________________________________________________________________________________________
垂直线
买入垂直线
- 买入水平非永久性趋势线 的颜色
- 表示 买入趋势
卖出垂直线
- 卖出水平非永久性趋势线 的颜色
- 表示 卖出趋势
________________________________________________________________________________________________________________________________________________
操作性
该工具提供所有必要的信息,以极高的精度识别未来价格走势,
并且可以对历史数据进行研究和统计分析。
除了提供完整分析所需的所有细节外,该工具还可生成高成功率的信号。
最后一条 垂直线 表示 当前趋势。
买入信号
如果买入趋势,
如果当前 垂直趋势线 只有买入 水平非永久性趋势线1(TP1) ,使用 TP1买入信号 作为目标。
根据波动的大小计算投资量,波动的货币价值为资本的1%。
示例见图片。
如果 TP1买入信号 在价格触及之前消失,选择是否:
- 使用 TP2 作为新目标改变投资方向
- 中断序列并等待新的 TP1买入信号
- 平仓投资
资金管理发挥重要作用,投资者可选择是否:
- 用该蜡烛线的后续TP(TP2,TP3..)来弥补 TP1买入信号 的损失
- 用后续的 TP1买入信号 来弥补 TP1买入信号 的损失
- 接受损失
卖出信号
如果 卖出趋势,
如果当 前垂直趋势线 只有 卖出水平非永久性趋势线1(TP1) ,使用 TP1卖出信号 作为目标。
根据波动的大小计算投资量,波动的货币价值为资本的1%。
示例见图片。
如果 TP1卖出信号 在价格触及之前消失,选择是否:
- 使用TP2作为新目标改变投资方向
- 中断序列并等待新的 TP1卖出信号
- 平仓投资
资金管理发挥重要作用,投资者可选择是否:
- 用该蜡烛线的后续TP(TP2,TP3..)来弥补 TP1卖出信号 的损失
- 用后续的 TP1卖出信号 来弥补 TP1卖出信号 的损失
- 接受损失
________________________________________________________________________________________________________________________________________________
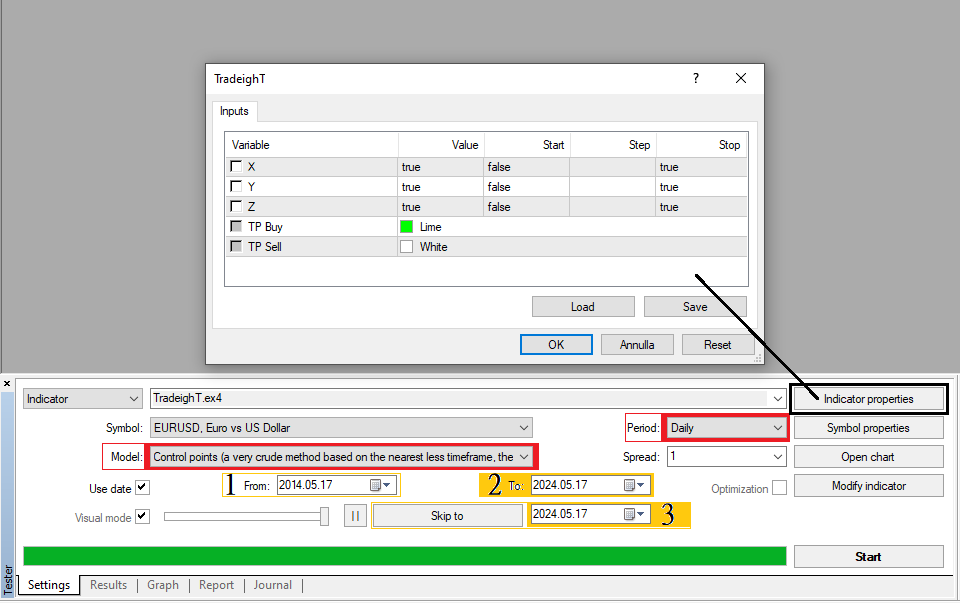
设置
在回测之前,可通过 指标属性 启用和禁用对象。在回测期间和之后,可通过图表上的 按钮 进行操作:
-
X = 水平永久性趋势线
-
Y = 垂直线
-
Z = 锯齿形走势
为了在每次回测时都使用相同的模板,请打开新符号,更改颜色和特性,并将 模板 保存为 tester.tpl
-(1)- 为了进行完整分析,请使用比当前日期早10年的日期作为回测开始日期。
-(2)- 在当前日期基础上再增加1个月,并将其用作回测结束日期。
-(3)- 要加快回测速度,请按 跳转 到按钮,并输入等于回测结束日期的日期。
更多详细信息请参见图片。
🛎️ https://t.me/tradeightrading


用户没有留下任何评级信息