TradeighT
- Göstergeler
- Lorenzo Monari
- Sürüm: 17.12
- Güncellendi: 4 Ocak 2024
- Etkinleştirmeler: 5
⭐ Araç, fiyat değişikliklerine dayalı gerçek matematiksel hesaplamalarla piyasanın kullandığı gerçek hareketi tanımlar.
⭐ Tradeight uygulaması, her zaman var olan bu matematiksel ilişkiye dayanır.
⭐ Çoğu tüccar aynı şeylere bakar ve aynı bilgileri inceler, bunun nedeni çoğunluğun para kaybetmesidir.
⭐ Çoğunluğun fikirlerine değil, piyasaya hükmeden 4 gerçek temele dayanan bir üründür.
⭐ Araç, anlaşılması kolay ve kullanımı basit, tüm geriye dönük test edilebilir semboller için kullanılabilen görsel bir araçtır.
MT4'e özel.
Gösterge, yüksek reaksiyon fiyat seviyeleri kullanır:
☆ Mevcut kar alma fiyatlarını sağlar
☆ Fiyat-işlem yöntemi, teknik/grafik analizi ile kullanım için seviyeler sağlar
☆ zikzak sağlar
☆ mevcut eğilimi sağlar
☆ Yüksek başarı yüzdesi ile fiyat hedefleri sağlar
________________________________________________________________________________________________________________________________________________
GENEL METRIKLER
Her Sayı bir mumla bağlantılıdır.
Her Sayının kendi Yatay Kalıcı Olmayan Eğilim Çizgisi vardır.
Her Yatay Kalıcı Olmayan Trend Çizgisinin kendi Dikey Trend Çizgisi vardır.
Yatay Kalıcı Olmayan Trend Çizgisine fiyat dokunduğunda kaybolur.
Kalıcı Olmayan Yatay Trend Çizgisi kaybolduğunda, bu Yatay Kalıcı Olmayan Trend Çizgisine bağlı Sayı ve Dikey Trend Çizgisi kaybolacaktır.
Yatay Kalıcı Olmayan Trend Çizgisi, fiyata dokunmadan önce kaybolursa, ters yönde bir sonraki Sayıya sahip yeni bir Yatay Kalıcı Olmayan Trend Çizgisi görünecektir.
________________________________________________________________________________________________________________________________________________
Yatay Kalıcı Olmayan Trend Çizgisi Alımı (mql5.com)TRENDLINE (seçilebilir)
- 1'den 5'e kadar numaralandırılmıştır
- Gösterge Özellikleri'nden renk düzenlenebilir
- Alış emrinde TP olarak kullanılacak fiyat
- 1'den 5'e kadar numaralandırılmıştır
- Gösterge Özellikleri'nden renk düzenlenebilir
- Satış emrinde TP olarak kullanılacak fiyat
Yatay Kalıcı Trend Çizgisi (mql5.com)
- destek veya direnç olarak kullanılmak üzere
Dikey Trend Çizgisi (mql5.com)
- Yatay Kalıcı Olmayan Trend Çizgisinin başlangıcı için bir zaman referansı olarak kullanılmak üzere
________________________________________________________________________________________________________________________________________________
DİKEY ÇİZGİLER (Gösterge Özelliği: Mod)
1.
Dikey Çizgi Satın Al (mql5.com)
- Yatay Kalıcı Olmayan Trend Çizgisinin Rengi Satın Al
- Yatay Kalıcı Olmayan Trend Çizgisi Satın Alma Sayısını vurgular
- Uzun yönde eğilim
Dikey Çizgi Satış (mql5.com)
- Yatay Kalıcı Olmayan Trend Çizgisi Satışının rengi
- Yatay Kalıcı Olmayan Trend Çizgisi Satışının Sayısını vurgular
- Kısa Yönde Trend
2.
Dikey Çizgi
- Yatay Kalıcı Trend Çizgisinin rengi
- Yatay Kalıcı Olmayan Trend Çizgisinin Sayısını vurgular
________________________________________________________________________________________________________________________________________________
SİNYAL
1.
Mevcut mumun Dikey Trend Çizgisi aşağıdakilerle bağlantılıysa:
- Mevcut olandan önce mum üzerinde bulunan Dikey Çizgi ile vurgulanan 1 Numaralı Yatay Kalıcı Olmayan Trend Çizgisi
- Dikey Çizgi ile vurgulanan 2 Numaralı Yatay Kalıcı Olmayan Trend Çizgisi
- Dikey Çizgi ile vurgulanan 3 Numaralı Yatay Kalıcı Olmayan Trend Çizgisi
Dikey Çizgi ile vurgulanan 3 Numaralı Yatay Kalıcı Olmayan Trend Çizgisinin fiyatını hedef olarak kullanın.
3 Numaralı Yatay Kalıcı Olmayan Trend Çizgisi, fiyat tarafından dokunulmadan önce kaybolursa,
Bir sonraki Sayı ile Yatay Kalıcı Olmayan Trend Çizgisini kullanarak yatırımın yönünü değiştirmeyi veya yatırımı iptal etmeyi seçin.
Resimlerdeki örnekleri görüntüleyin.
- Seçilen yönde 0,01(1000) olan bir pozisyon açın
- Seçilen trend çizgisinin kârdaki fiyatı⟶ fiyatı olarak girin.
- Hareketin parasal değerini 0,01 ile görüntüleyin
- Hareketin büyüklüğüne göre yatırımın büyüklüğünü seçin
2.
Dikey Çizgi ile vurgulanan Kalıcı Olmayan Yatay Trend Çizgisinin fiyatını hedef olarak kullanın.
Seçilen Yatay Kalıcı Olmayan Trend Çizgisi, fiyat tarafından dokunulmadan önce kaybolursa,
Bir sonraki Sayı ile Yatay Kalıcı Olmayan Trend Çizgisini kullanarak yatırımın yönünü değiştirmeyi veya yatırımı iptal etmeyi seçin.
Resimlerdeki örnekleri görüntüleyin.
- Seçilen yönde 0,01(1000) olan bir pozisyon açın
- Seçilen trend çizgisinin kârdaki fiyatı⟶ fiyatı olarak girin.
- Hareketin parasal değerini 0,01 ile görüntüleyin
- Hareketin büyüklüğüne göre yatırımın büyüklüğünü seçin
________________________________________________________________________________________________________________________________________________
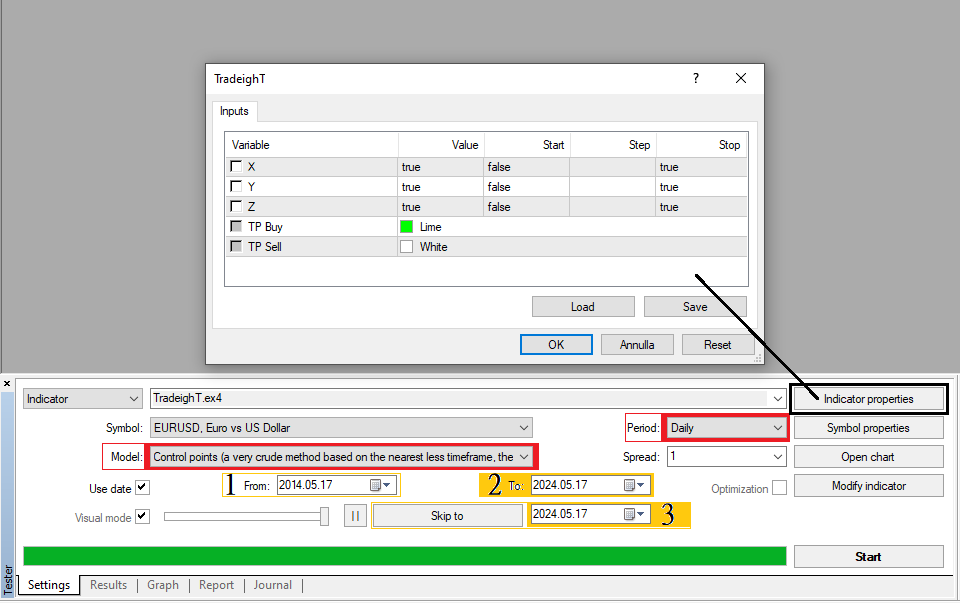
AYARLAR
- X = Yatay Kalıcı Eğilim Çizgisi
- Y = Dikey Çizgi
- Z = ZigZag
Geriye dönük testten önce Dikey Çizgilerin türünü Gösterge Özelliklerinden seçme imkanı:
- Y. = 1 : Dikey Çizgi Satın Al , Dikey Çizgi Sell
- Y. = 2 : Dikey Çizgi
Her geriye dönük testte aynı Şablona sahip olmak için yeni bir sembol açın, renkleri ve özellikleri değiştirin ve Şablonu tester.tpl olarak kaydedin
Tam bir analiz için, geriye dönük test başlangıç tarihi olarak geçerli tarihten 10 yıl öncesini kullanın.
Geçerli tarihe 1 ay daha ekleyin ve bunu geriye dönük testin bitiş tarihi olarak kullanın.
Geriye dönük testi hızlandırmak için Atla düğmesine basın ve geriye dönük testin bitiş tarihine eşit bir tarih girin.
Daha fazla ayrıntı için resimlere bakın.
________________________________________________________________________________________________________________________________________________


Kullanıcı incelemeye herhangi bir yorum bırakmadı