VR MULTI PRICES ANALYSIS
- Indicatori
- Vladimir Pastushak
- Versione: 21.80
- Aggiornato: 28 agosto 2021
- Attivazioni: 20
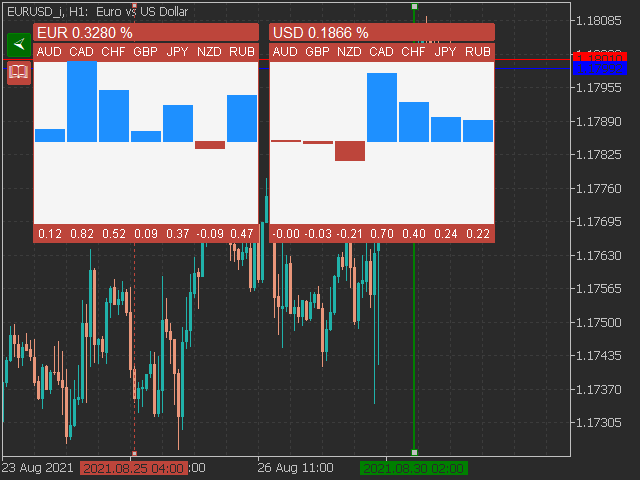
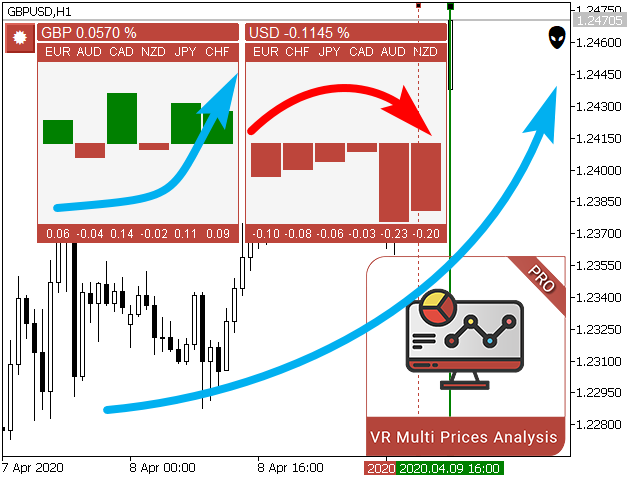
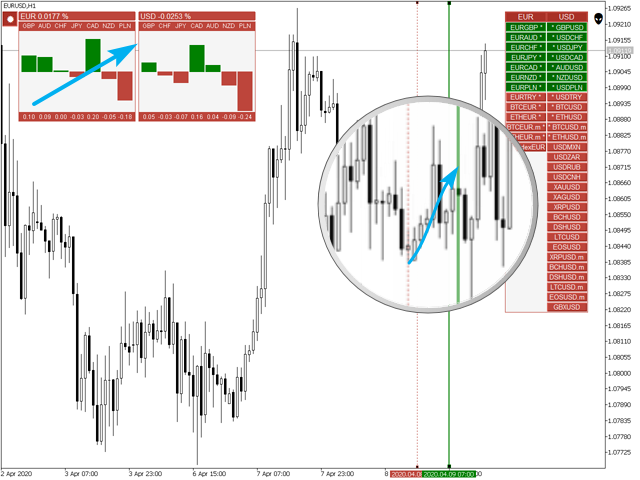
VR MultiPrice Analysis is an indicator that determines the strength of a currency in a currency pair. Let's take the EUR / USD pair as an example. How can we determine which currency is currently weak and which is strong?
The easiest and most reliable way is to compare the EUR against other currencies, excluding the USD.
The variants of power distribution:
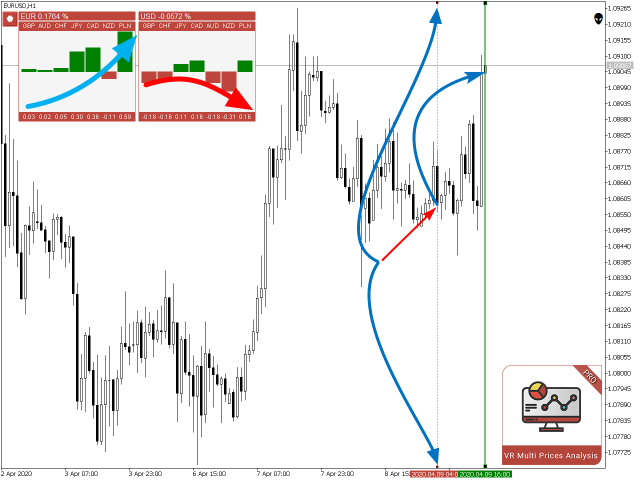
- The EUR is rising against other currencies - this is a sign that the currency has become more attractive to traders and investors, or good news has come out.
- The EUR is falling against other currencies - this is a sign that most traders and investors are getting rid of the EUR and buying other currencies or bad news has come out.
- The indicator shows different values for different currencies -it is a sign of uncertainty in the market for the EUR currency.
As for the EUR currency, the indicator analyzes the USD in relation to other currencies.
As a result, using VR MultiPrice Analysis, a trader receives a synthetic analysis of the EUR / USD currency pair, and sees the whole picture of the entire currency pair.
The indicator can analyze the currency pair it is installed on or the pair that is specified in the settings.
With the help of the indicator you increase the chances of a more accurate market entry at the beginning of a strong movement.
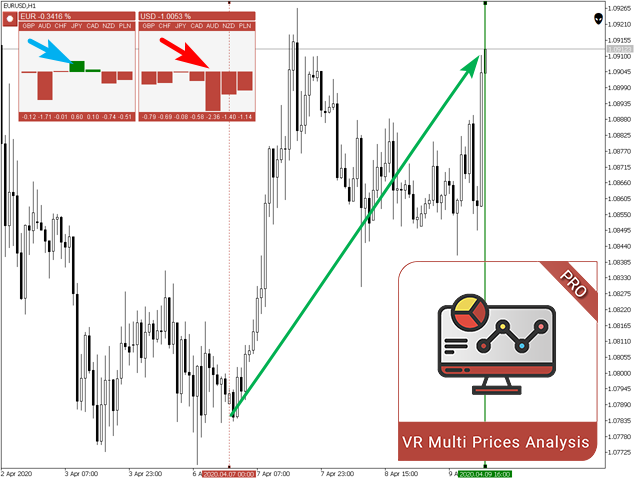
You will be able to analyze the strength of the currency in history. You need to move the two vertical levels to the desired dates to do this.
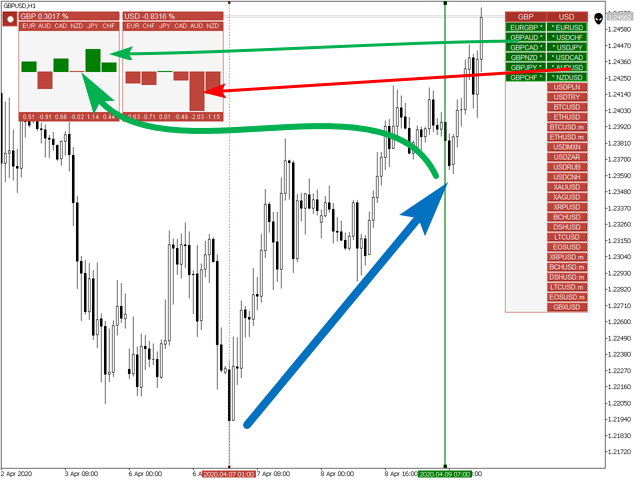
All indicator management is done on the chart, you can select currency pairs to analyze the first currency and to analyze the second currency, the indicator will automatically prompt for synchronous pairs.
For example, for EUR / USD = EUR / GBP and GBPUSD, that means that each currency will be analyzed relative to GBP.
H2 ~ Recommendations
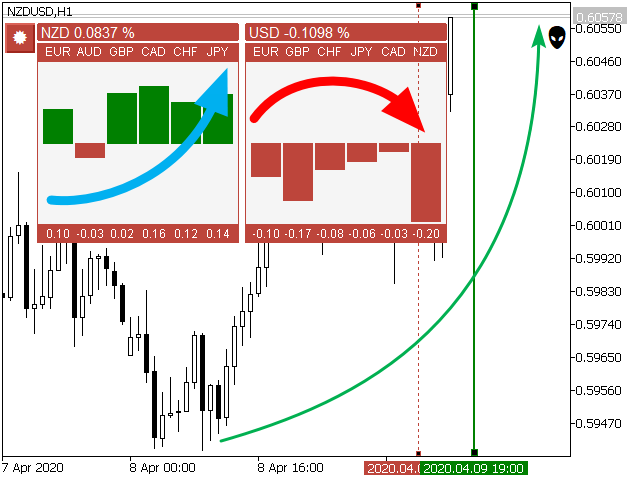
- Expect the main currency to rise against other currencies for purchases.
- The most accurate and qualitative indicator is the growth of columns for the first currency and the fall of columns for the second one.
- Drag the right vertical level to the right to change the reading live online.
- Use the indicator in conjunction with your trading strategy.
- Use the hide info windows buttons to hide the indicator temporarily.
- Use color settings to make the indicator visually clear and convenient.
Versions: MetaTrader 5
Your feedback is the best gratitude for us! Leave feedback.
Technical support, configurations, set files and trial period can be requested in chat group




















К сожалению очень сильно разочарован...продукт не соответствует тому о чем говорит автор в видео. в торговле абсолютно без полезный ни чего не показывает просто столбики растут уменьшаются рынку совсем не соответствует не берите не тратьте деньги.
Обновитесь пожалуйста! Версия 21.80 2021.08.28
Исправление ошибок
Оптимизация кода
Теперь программа работает стабильно
Индикатор скомпилирован в последней версии терминала