ADR Reversal Indicator MT5
- Indicatori
- LEE SAMSON
- Versione: 1.40
- Aggiornato: 24 settembre 2022
- Attivazioni: 10
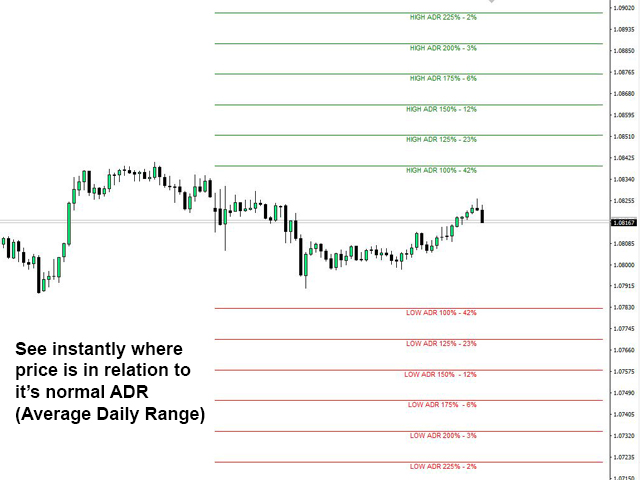
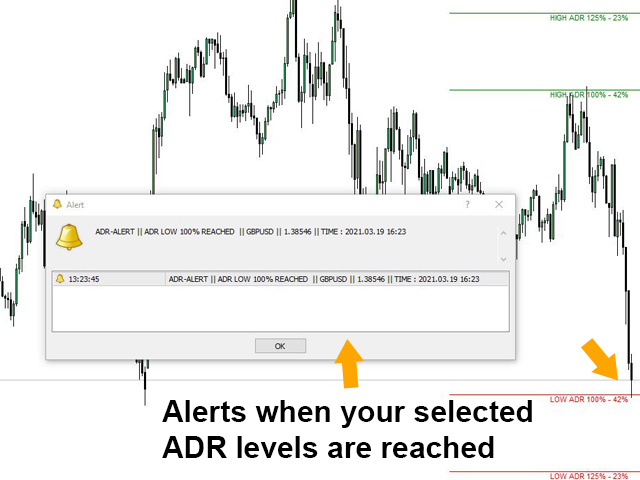
L'indicatore di inversione ADR ti mostra a colpo d'occhio dove il prezzo è attualmente scambiato in relazione al suo normale intervallo medio giornaliero. Riceverai avvisi istantanei tramite pop-up, e-mail o push quando il prezzo supera la sua gamma media e livelli superiori a tua scelta in modo da poter saltare rapidamente a pullback e inversioni. L'indicatore disegna linee orizzontali sul grafico agli estremi dell'intervallo medio giornaliero e anche estensioni al di sopra di quei livelli a cui sono associate probabilità matematiche di prezzo che li supera. Maggiori dettagli su quello qui sotto...
DASHBOARD ADR ALERT PER COMPLEMENTARE L'INDICATORE E MONITORARE TUTTE LE COPPIE DISPONIBILI ANCHE QUI: https://www.mql5.com/en/market/product/66316
Versione MT4 disponibile anche qui: https://www.mql5.com/en/market/product/62757
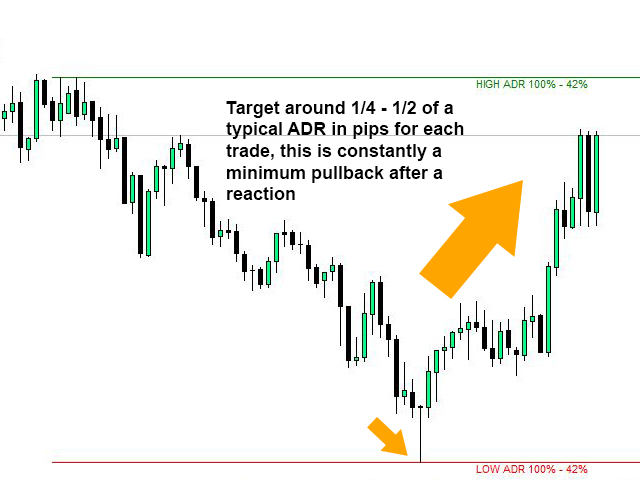
Circa il 60% delle volte il prezzo viene scambiato all'interno del suo normale intervallo giornaliero medio (ADR) e le spinte al di sopra di questi livelli sono solitamente un indicatore di un forte movimento di prezzo che in genere avrà un movimento di ritiro (presa di profitto) che lo segue. Puoi trarre vantaggio da queste mosse brusche scambiando il pullback dalla parte superiore o inferiore dell'intervallo giornaliero al livello più recente di supporto o resistenza.
Sono stati raccolti oltre 20 anni di dati storici per trovare le possibilità percentuali medie che il prezzo si sposti oltre i livelli ADR specifici per le principali coppie forex e una selezione di incroci. Questi dati hanno indicato che il prezzo si è spostato solo oltre il 200% del suo ADR il 3% delle volte, il che significa che le tue probabilità di un'inversione o un ritiro a quel livello sarebbero del 97%!!!
Queste le medie di estensione ADR mostrate dai dati:
Il prezzo ha superato il 100% di ADR10 circa il 42% delle volte.
Il prezzo ha superato il 125% di ADR10 circa il 23% delle volte.
Il prezzo ha superato il 150% di ADR10 circa il 12% delle volte.
Il prezzo ha superato il 175% di ADR10 circa il 6% delle volte.
Il prezzo ha superato il 200% di ADR10 circa il 3% delle volte.
Il prezzo ha superato il 225% di ADR10 circa il 2% delle volte.
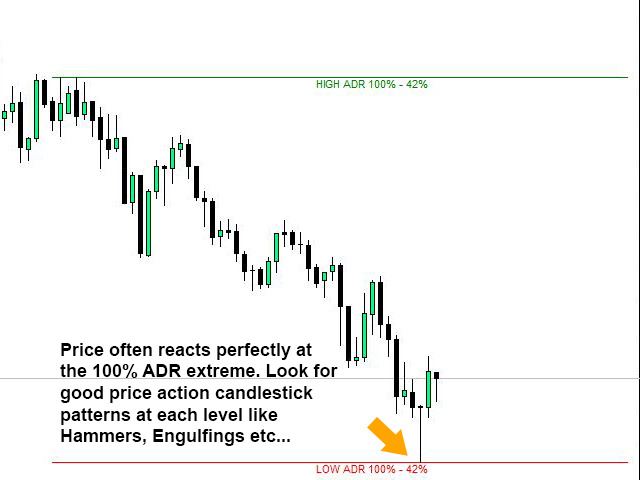
Come puoi vedere dai livelli sopra, se il prezzo arriva al 150% del suo normale ADR, le probabilità che vada oltre sono solo del 12%, dandoti un enorme vantaggio. Attendi che l'azione dei prezzi ti mostri i segni di una svolta a quel livello e salta sul pullback!
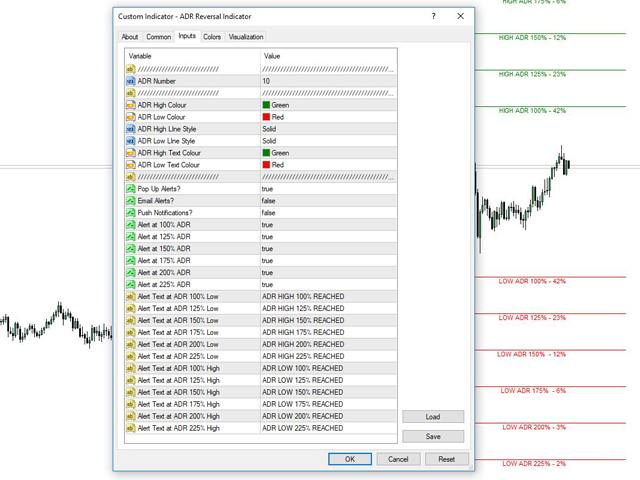
Impostazioni dell'indicatore:
Seleziona il numero ADR con cui vorresti lavorare. NOTA: le statistiche di cui sopra si basano sui dati ADR10.
Scegli i colori e lo styling delle linee per i livelli ADR.
Seleziona il tipo di avvisi che desideri ricevere da popup, e-mail o avvisi push.
Opzione per attivare o disattivare ogni livello se desideri ricevere avvisi solo a specifici estremi ADR.
Scegli il testo per gli avvisi che desideri per ogni livello.
Idea per la strategia di ingresso:
Attendi che il prezzo raggiunga un livello specifico e ricevi un avviso. Più alto è il livello, maggiori sono le possibilità di inversione, ma meno avvisi riceverai. Quando ricevi un avviso puoi aspettare che si formi un buon pattern di candele con azione sui prezzi (inghiottimento, martello, stella cadente ecc...) oppure potresti voler usare un EMA stretto come EMA9 e saltare dentro. M5 o M15 sono i tempi migliori da utilizzare.
Queste operazioni dovrebbero essere operazioni di scalping, quindi idealmente mirano al massimo o al minimo più recente che potrebbe fungere da livello di supporto o resistenza. Spesso questi avvisi ADR si verificano nelle sessioni di Londra o di New York, quindi è spesso una buona idea prendere di mira gli alti e bassi della sessione asiatica.
Livelli ADR di Grid Trading:
Molte persone fanno trading in rete utilizzando l'ADR. Inserisci piccole posizioni a livelli ADR selezionati (100%, 150%, 200% ecc.) e poi quando il prezzo si sposta sopra i livelli guadagni una posizione con una media più alta ogni volta che si attiva un nuovo trade. Ciò consente quindi di ottenere maggiori profitti dal pullback e un ingresso di prezzo medio più elevato rispetto alla sola prima posizione presa.


I made many tests, and it worked like magic, if you have a strategy or an indicator and you want to make sure about your next move this tool will help you, I don't always write reviews for the many indicators that I bought, because I always felt that there is something missing, this tool helped me with the missing link for all the indicators that I bought, they are not bad at all as I thought ( with the confirmation from ADR). 5 BIG STARS