Smart Confluence Candlesticks
- Indicatori
- Versione: 1.62
- Attivazioni: 5

“Spotting a pinbar is easy. Checking its size, the nearest swing levels, yesterday’s high and low, round numbers and the higher-timeframe trend — on every candle — is not. Smart Confluence Candlesticks does all of it for you and shows only the patterns that matter.”
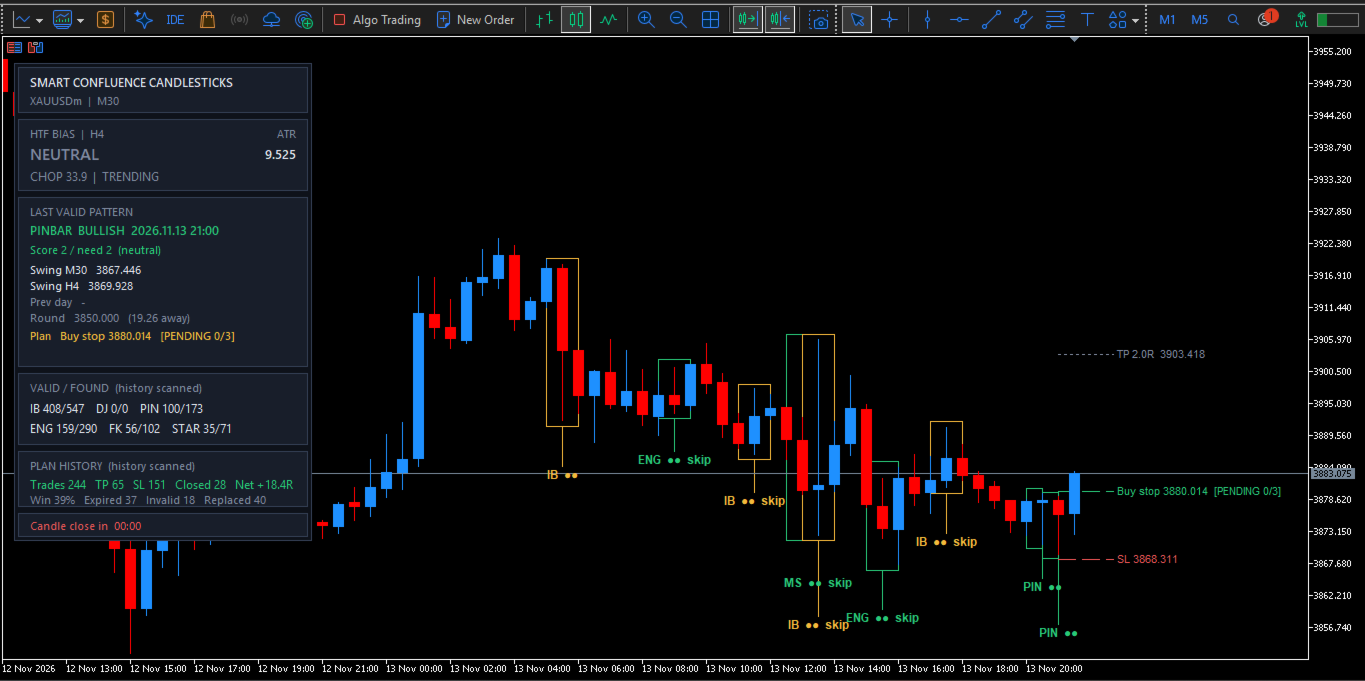
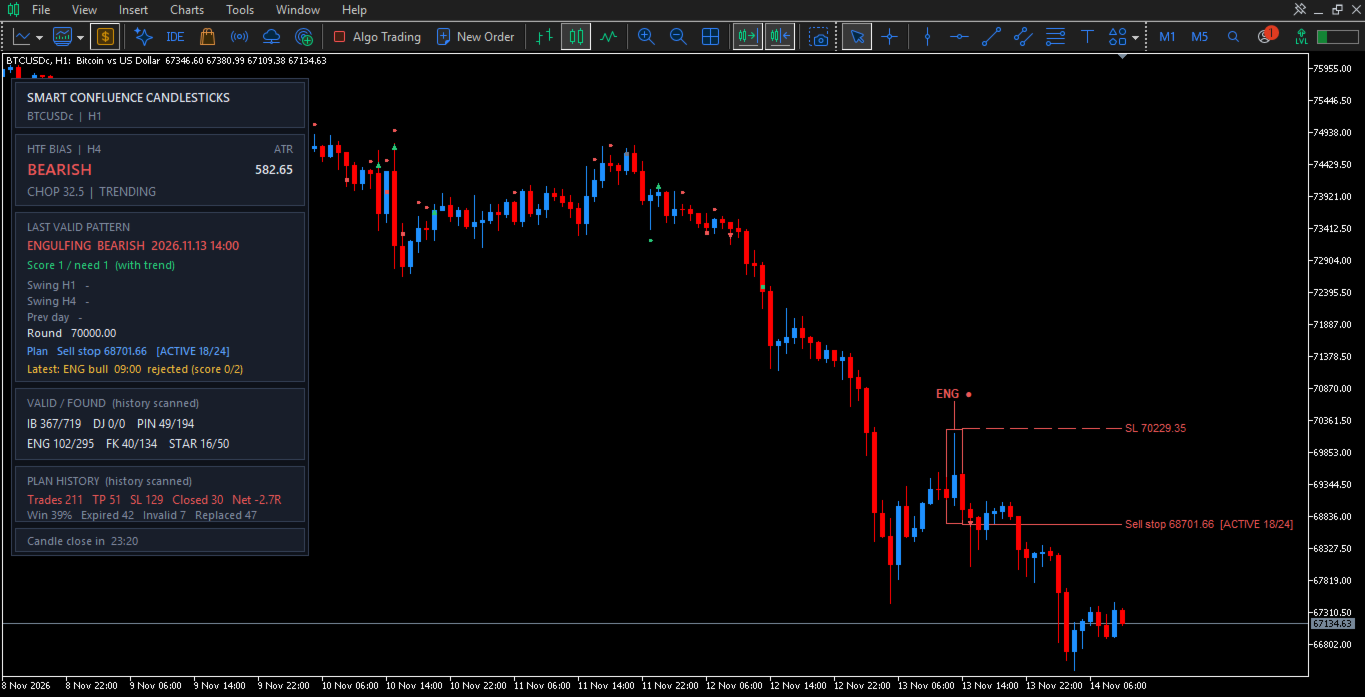
Smart Confluence Candlesticks finds classic price-action patterns and keeps only the ones that form at a meaningful price level. A pattern in the middle of nowhere is ignored. A pattern at a swing high, the previous day's low or a round number is shown with its score, its levels and a complete trade plan.
Everything is calculated on closed candles only. Levels and bias use only data that was available when the pattern closed, so what you see in history is what you would have seen live.
Patterns detected
- Inside bar (traded both ways with an OCO buy stop / sell stop)
- Pinbar
- Engulfing
- Fakey (false break of an inside bar)
- Morning star / evening star
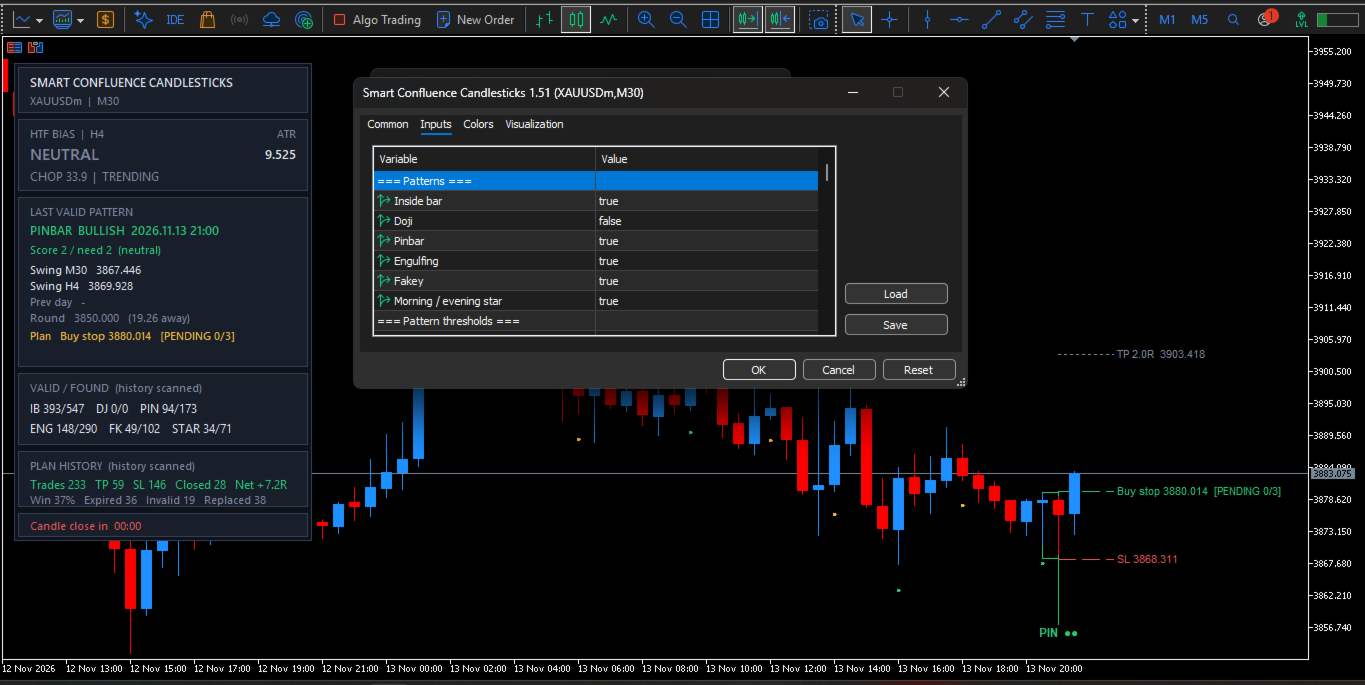
- Doji (off by default, can be enabled)
Each pattern uses ATR-based thresholds, so it adapts to the volatility of the symbol and timeframe. Every pattern can be switched on or off.
Location score
Each pattern gets one point for every type of level near its extreme:
- Swing high / low on the chart timeframe
- Swing high / low on the higher timeframe
- Previous day high / low
- Round number
The required score depends on the higher-timeframe bias. With the trend, 1 point is enough. Against the trend, 2 points are needed. When the bias is neutral or ranging, 2 points are needed.
Higher-timeframe bias
The bias comes from market structure on the higher timeframe (H4 by default). A trend is confirmed after consecutive breaks in the same direction. A change of character makes it neutral. A Choppiness filter marks the market as ranging when price moves sideways.
Trade plan on the chart
For every valid pattern the indicator draws a ready plan:
- Entry: stop order beyond the pattern plus a small ATR buffer
- Stop loss: behind the pattern
- Take profit: a fixed R multiple (2R by default)
- The pending order expires after a set number of candles
The plan label shows its live status: PENDING, ACTIVE, TP HIT, SL HIT, EXPIRED, INVALID or CLOSED. While a position runs, the label also counts candles toward the time limit, for example ACTIVE 5/24.
Three position-handling modes
- Follow the system (default): one position at a time. New patterns are skipped while it runs. A same-direction pattern can tighten the stop loss.
- Follow the system + exit on opposite pattern: same as mode 1, but a valid opposite pattern closes the position and starts a new plan.
- New plan for every valid pattern: built for manual traders. Every valid pattern gets its own entry, SL and TP, and nothing is skipped.
History statistics
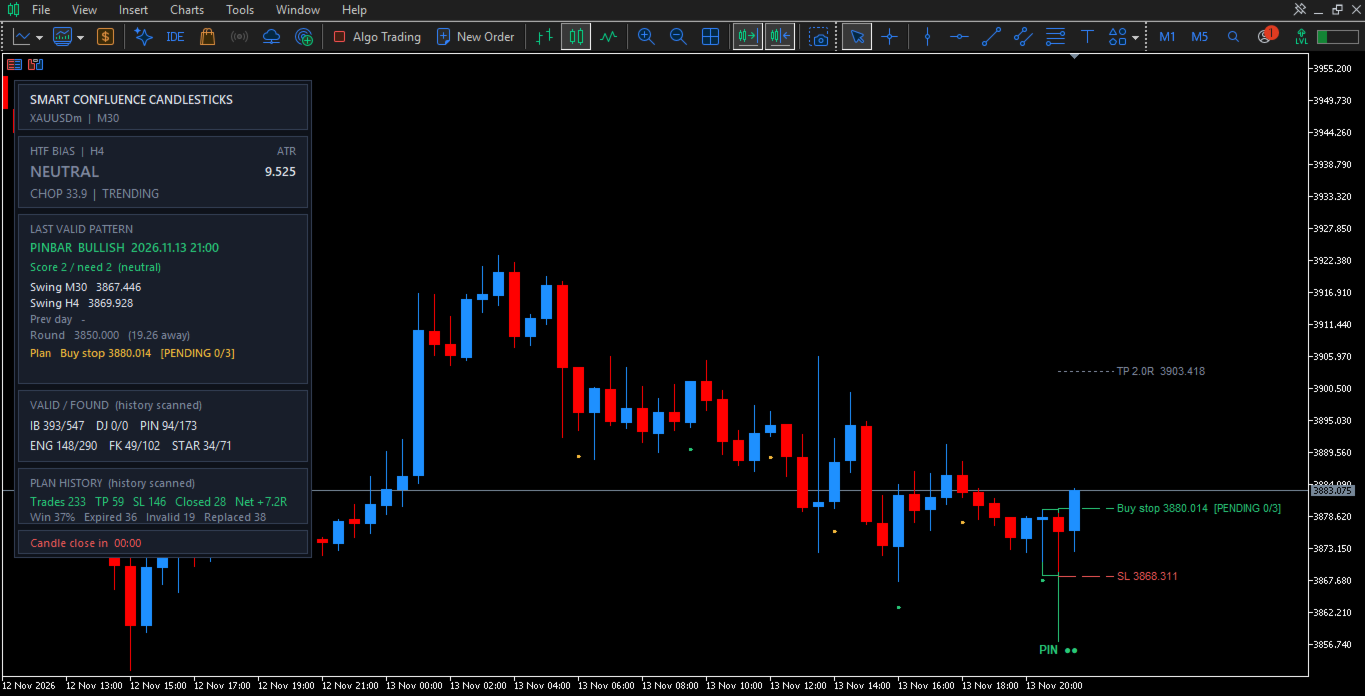
The indicator replays its own plans over the scanned history and shows the result on the panel: trades, TP, SL, closed, expired, invalid, win rate and net result in R. Small markers on the chart show where each past order filled and closed. Hover any marker or pattern to see its details.
These statistics are a simulation on candle data. They do not include spread, commission, slippage or weekend gaps. When stop loss and take profit are both touched inside one candle, the stop loss is counted first.
Panel
- Higher-timeframe bias, Choppiness and ATR
- Last valid pattern with its score and the level found in each of the four categories
- Current plan and its status
- The newest skipped or rejected pattern
- Valid / found count for each pattern
- Plan history statistics
- Countdown to the candle close
The panel can be placed in any corner and stays in front of the chart. Popup and push alerts are available for new valid patterns.
Main input parameters
The defaults were tuned on XAUUSD M30 with an H4 bias. Pattern thresholds, colors and panel position can also be changed.
| Parameter | Default | What it does |
|---|---|---|
| Patterns on/off | All on, doji off | Choose which patterns are detected |
| Round number step | 50 | Distance between round levels, in price units |
| Near a level | 0.25 x ATR | How close the pattern extreme must be to a level |
| Swing lookback | 100 bars | How far back swing levels are searched |
| Min score: with / against / neutral | 1 / 2 / 2 | Points needed before a pattern is valid |
| Bias timeframe | H4 | Timeframe for structure bias and HTF swings |
| Choppiness max | 61.8 | Above this value the market counts as ranging |
| History bars to scan | 5000 | Bars used for drawing and statistics |
| Entry / SL buffer | 0.1 x ATR | Distance added beyond the pattern |
| TP (R multiple) | 2.0 | Take profit as a multiple of the risk |
| Pending order expiry | 3 candles | Unfilled plan expires after this |
| Position handling | Follow the system | One of the three modes above |
| Same-direction pattern moves SL | On | Tightens the SL only; not used in every-pattern mode |
| Close after N candles | 24 | Time limit for an open position (0 = off) |
| Show history | On | Past trade markers and statistics |
| Alerts / push | Off | Notify on a new valid pattern |
Recommended use and notes
- Recommended: XAUUSD on M30 with H4 bias. It works on any symbol and timeframe because thresholds are ATR-based.
- Round number step is in price units. For gold, 50 means every $50. For other symbols, set a step that fits the price, for example 0.0050 for EURUSD, 0.50 for USDJPY, or 500 for US30.
- The indicator does not read your trading account. In "Follow the system" mode the plan follows its own simulated position, even if you closed your real trade earlier. Use "New plan for every valid pattern" if you manage positions yourself.
- The indicator does not open trades. It does not repaint closed-candle results.
Disclaimer
Trading involves risk. Past and simulated results do not guarantee future results. The statistics on the panel exclude spread, commission, slippage and gaps. Always test on a demo account first and use your own risk management.