Aurex Automatic SR
- Indicatori
- Versione: 1.11
- Attivazioni: 5

Cleaner Charts. Smarter Levels. Automatic Support & Resistance.
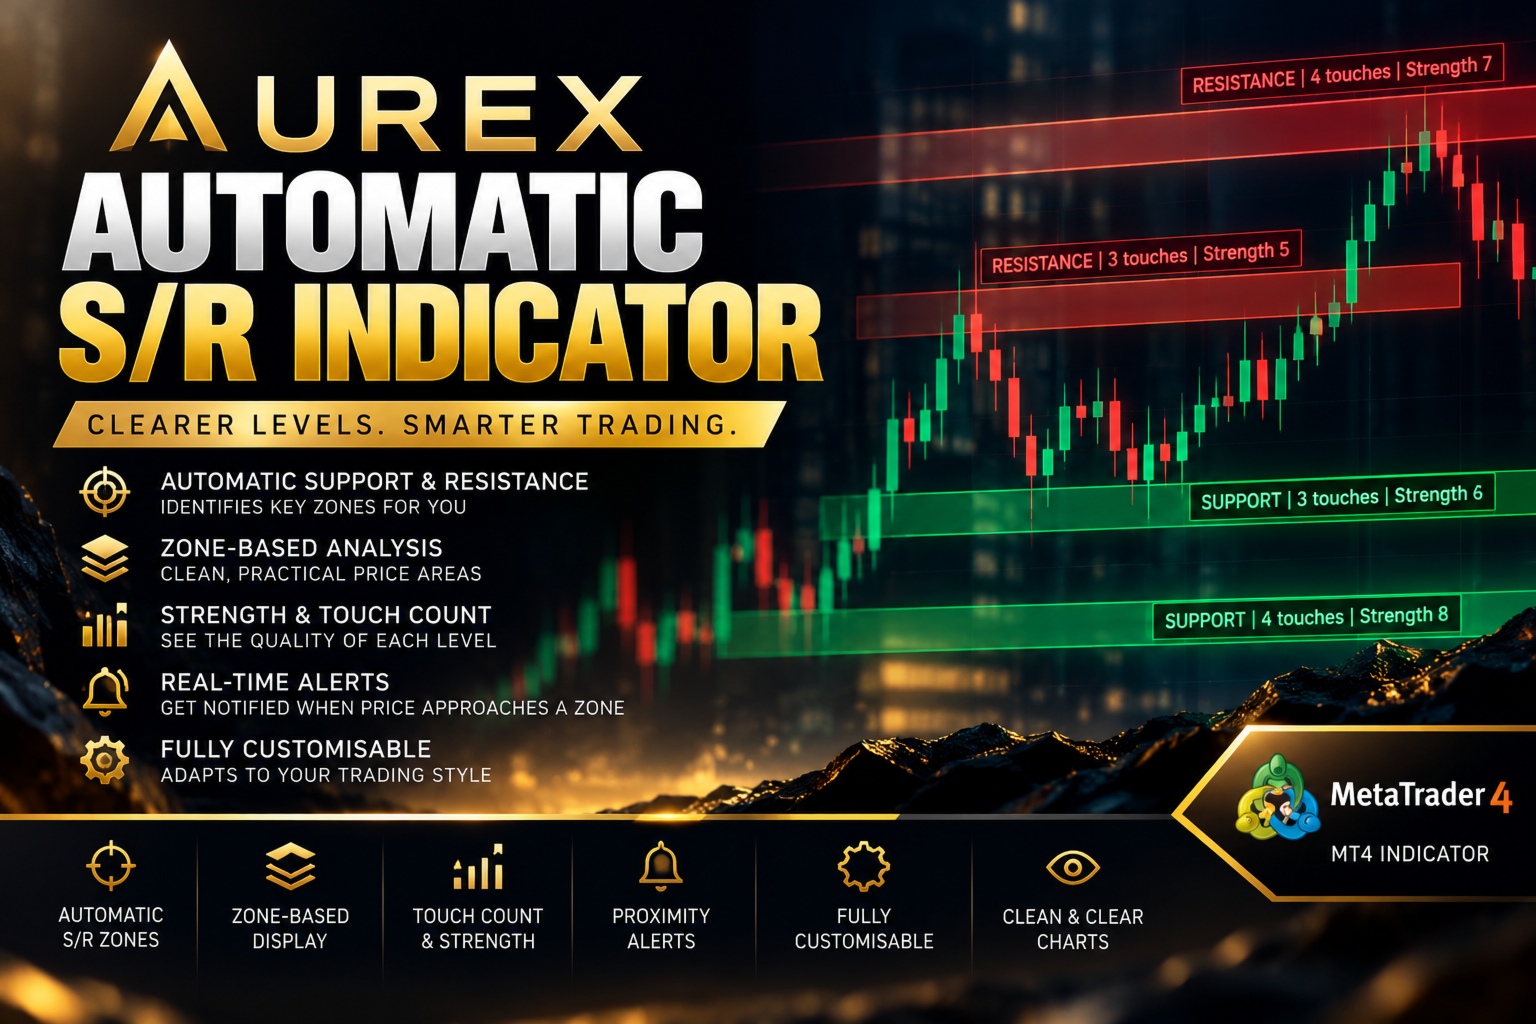
Aurex Automatic S/R is a custom MetaTrader 4 indicator designed to automatically identify and display significant support and resistance zones directly on your trading chart.
Instead of manually searching through historical price action and drawing levels yourself, Aurex Automatic S/R analyses confirmed swing highs and swing lows, groups nearby price levels together and displays the most relevant areas as clearly defined Support and Resistance zones.
The indicator has been designed specifically to avoid overwhelming your chart with dozens of unnecessary levels. By default, it prioritises the nearest relevant Support and Resistance zones, helping you focus on the areas most likely to matter to current price action.
Automatic Support & Resistance
The indicator continuously analyses historical price action for significant swing highs and swing lows.
Repeated reactions around similar prices are grouped together to create clearly defined Support and Resistance zones.
Zone-Based Analysis
Markets rarely react to one exact price.
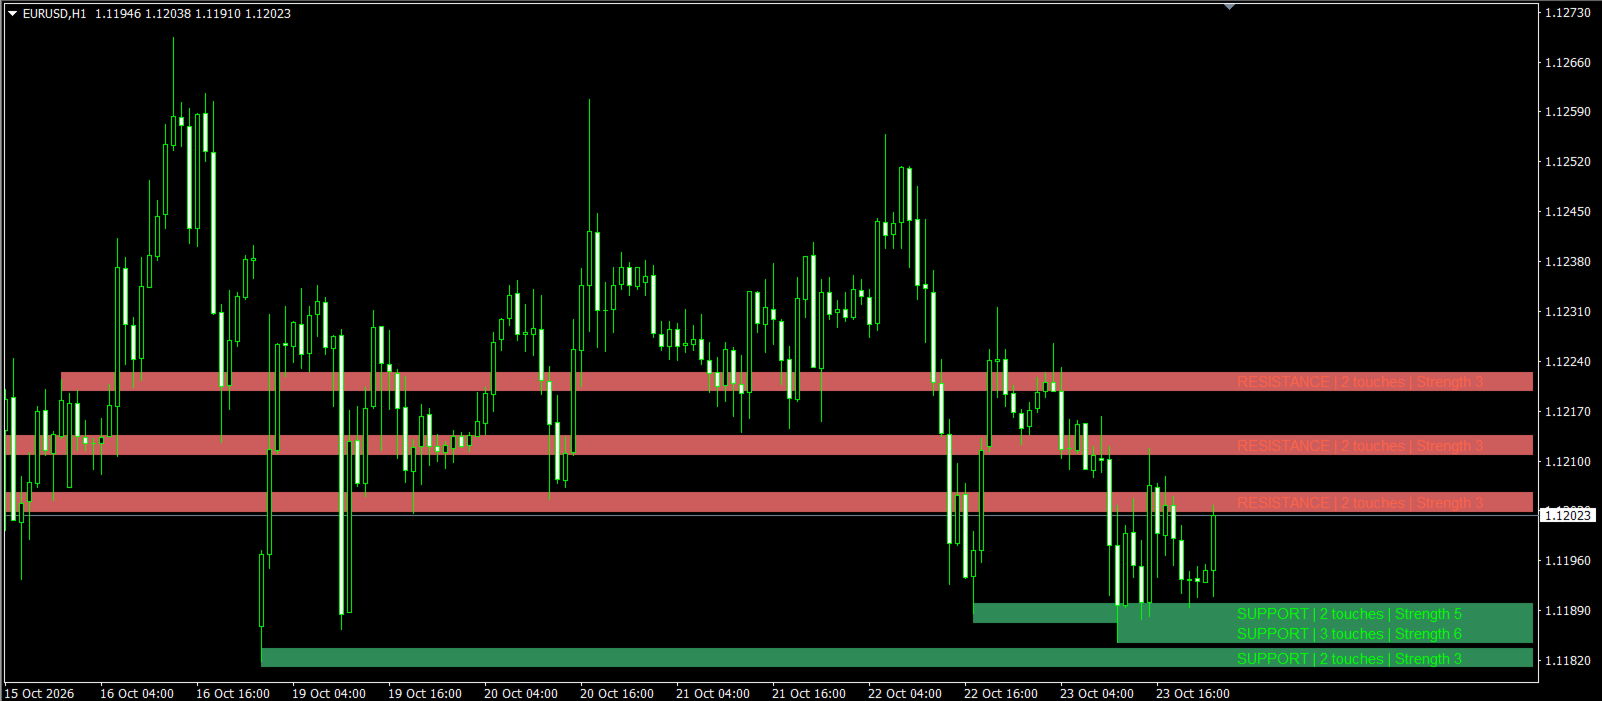
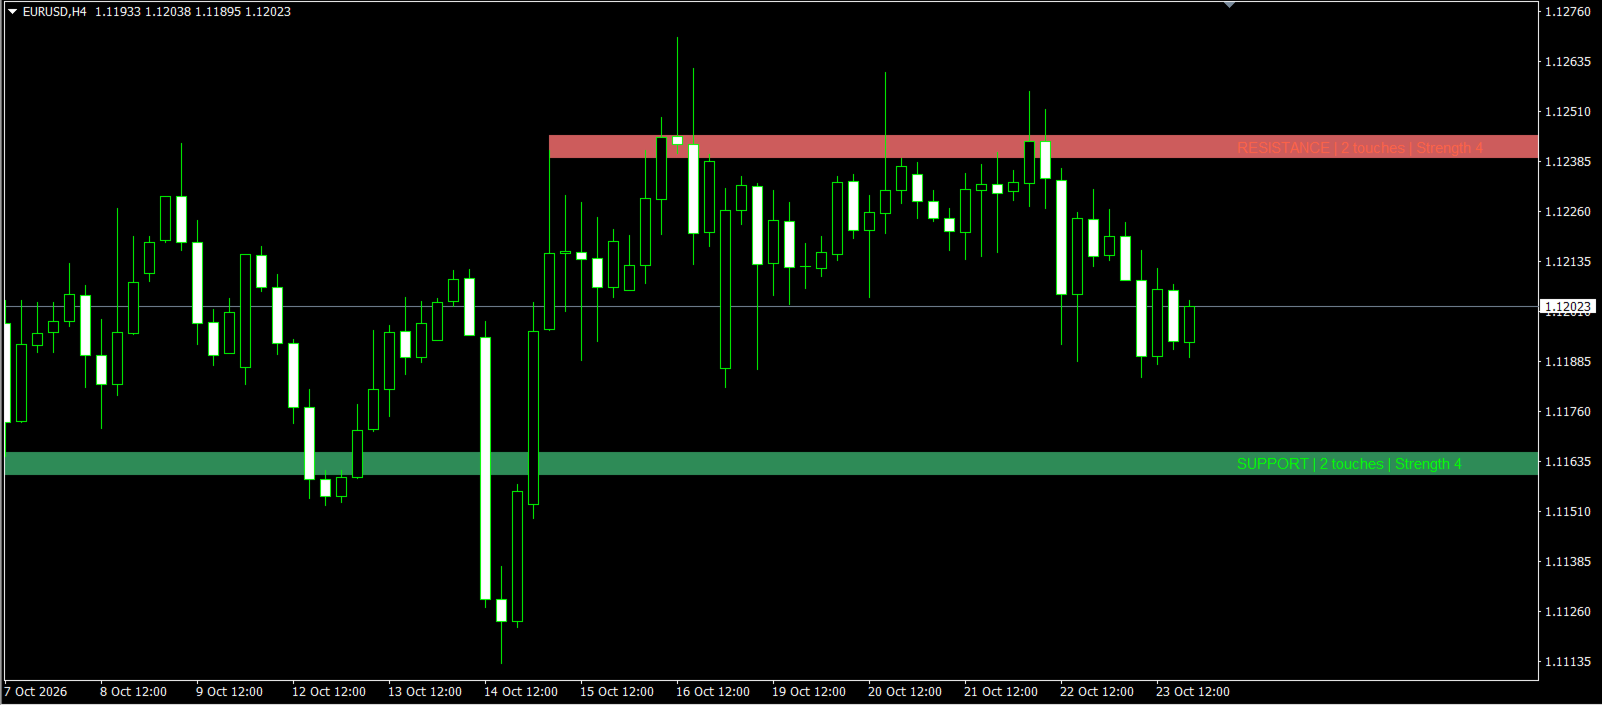
Rather than displaying Support and Resistance as a collection of thin horizontal lines, Aurex Automatic S/R identifies price zones, providing a more practical representation of areas where buyers or sellers have previously reacted.
Intelligent Zone Merging
Swing levels occurring around similar prices are automatically combined into a single zone.
This helps reduce chart clutter and prevents several almost-identical levels from being displayed.
Nearest-Zone Prioritisation
Aurex Automatic S/R can prioritise the Support and Resistance zones closest to current market price.
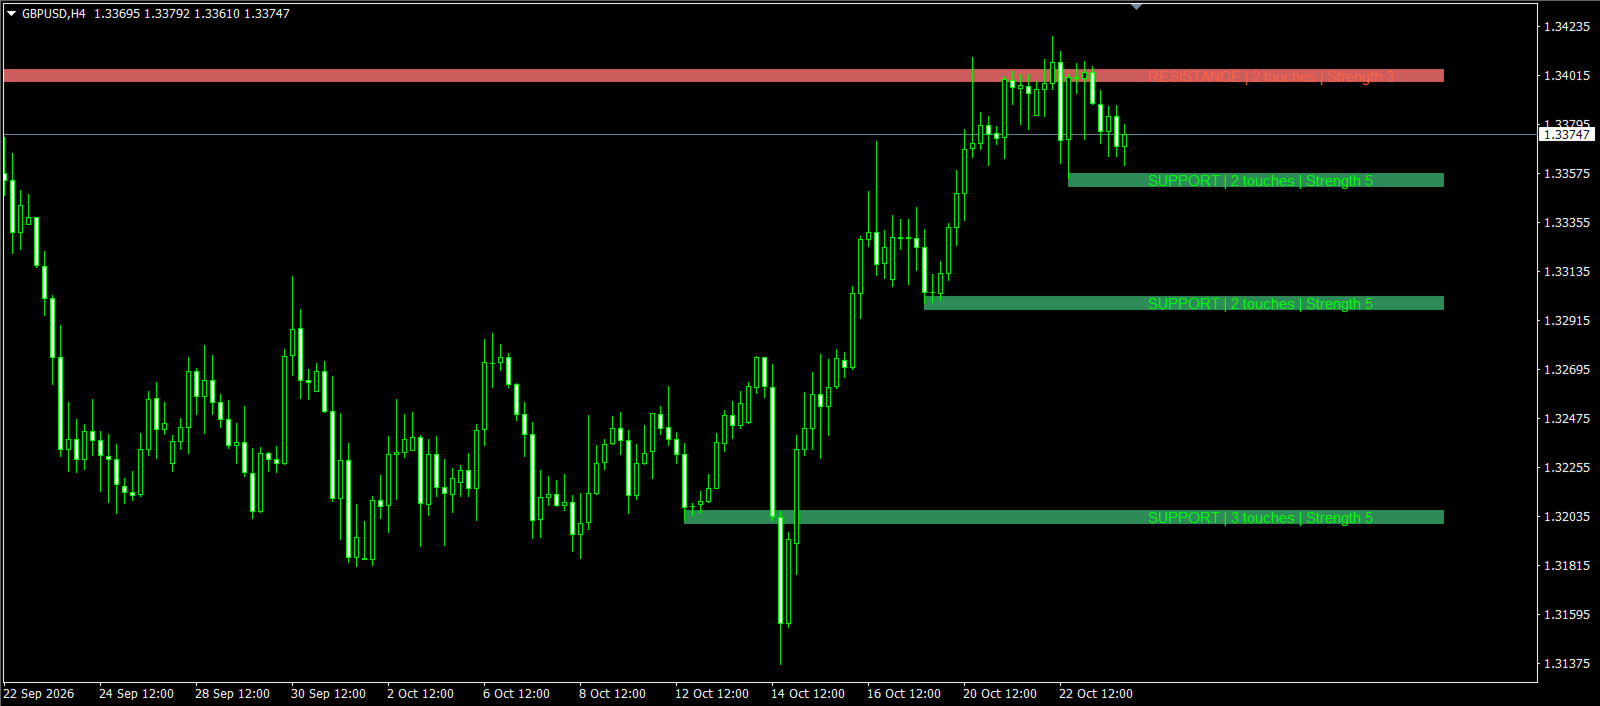
The default configuration displays up to:
3 Support Zones
3 Resistance Zones
Traders who prefer an even cleaner chart can reduce this to one or two zones on either side of price.
Zone Strength Scoring
Not every Support or Resistance area is equally significant.
The indicator assigns each detected zone a strength score based on factors including the number of detected reactions and the recency of those reactions.
This provides additional context when comparing multiple levels.
Touch Counter
Each displayed zone can show how many detected swing points contributed to its creation.
Repeated reactions can help identify areas that have historically attracted significant market activity.
Volatility-Adaptive Zones
When ATR mode is enabled, the width of each zone automatically adjusts according to current market volatility.
Higher volatility can produce wider zones, while quieter market conditions can result in narrower zones.
A fixed-width mode is also available.
Broken Zone Detection
The indicator can automatically identify Support or Resistance zones that have been broken by price.
Broken zones can be hidden automatically, helping keep the chart focused on currently relevant areas.
Customisable Chart Display
Support and Resistance zones have separate colours, while labels use independent text colours for improved visibility.
Users can customise:
Support colour
Resistance colour
Support label colour
Resistance label colour
Font size
Zone width
Maximum number of zones
Zone extension length
Labels and information displayed
Proximity Alerts
Optional alerts can notify the trader when market price approaches a detected Support or Resistance zone.
Available alert methods include:
Popup alerts
Sound alerts
MetaTrader push notifications
The alert distance is fully configurable.
Aurex Automatic S/R begins by identifying confirmed swing highs and swing lows.
Swing highs are used to identify potential Resistance.
Swing lows are used to identify potential Support.
Nearby swing points are then compared and grouped into common price areas.
When several qualifying swing points occur around a similar price, they contribute toward the same zone.
The indicator then evaluates these zones according to their number of reactions, recency, distance from current market price and configured strength requirements.
The final result is a limited selection of relevant Support and Resistance zones rather than every historical turning point being displayed on the chart.
Lookback Bars
Determines how much historical price action the indicator analyses.
A larger value considers more historical candles, while a smaller value focuses more heavily on recent market structure.
Default: 500
Swing Strength
Determines how significant a swing high or swing low must be before it can contribute to a zone.
Increasing Swing Strength generally produces fewer, more significant swing points.
Default: 5
Minimum Touches
Determines the minimum number of qualifying swing reactions required before an area can be displayed.
Increasing this value makes zone selection more restrictive.
Default: 2
Maximum Support Zones
Controls the maximum number of Support zones displayed below current market price.
Default: 3
Maximum Resistance Zones
Controls the maximum number of Resistance zones displayed above current market price.
Default: 3
Use ATR Zone Width
When enabled, zone thickness is calculated using the Average True Range indicator.
This allows zones to adapt automatically as market volatility changes.
ATR Period
Determines the calculation period used for ATR.
Default: 14
ATR Zone Multiplier
Controls the thickness of ATR-based zones.
Increasing the value creates wider zones. Reducing it creates narrower zones.
Default: 0.12
Fixed Zone Width
Determines zone width in pips when ATR-based sizing is disabled.
Merge Distance Multiplier
Controls how close two detected swing levels must be before they can be grouped into the same zone.
Increasing this value causes more nearby levels to be combined.
Maximum Distance Filter
Prevents historical zones that are excessively far away from current market price from cluttering the chart.
Maximum Distance ATR
Determines the maximum distance a zone can be from current price, measured using ATR.
Prefer Nearest Zones
When enabled, the indicator prioritises valid Support and Resistance zones closest to current price.
When disabled, stronger zones can instead be prioritised.
Strength Filter
Allows weak zones to be automatically excluded.
Minimum Strength Score
Determines the minimum calculated strength required before a zone can be displayed.
Weight Recent Touches
When enabled, recent reactions receive additional weighting when the zone's strength is calculated.
Hide Broken Zones
Automatically removes zones that the indicator determines have been broken.
Break Confirmation Bars
Determines how many completed candle closes beyond a zone are required before it is considered broken.
Users can independently configure:
Show Support
Show Resistance
Show Labels
Show Touch Count
Show Strength
Support Zone Colour
Resistance Zone Colour
Support Text Colour
Resistance Text Colour
Label Font Size
Zone Border Width
Zone Border Style
This allows the indicator to be adapted to both light and dark MetaTrader chart themes.
Start From Latest Touch
When enabled, displayed zones begin from their most recent detected reaction rather than extending across unnecessary historical price action.
This helps produce a much cleaner chart.
Extend Bars Right
Controls how far each zone is projected beyond current price action.
Enable Alerts
Activates proximity notifications.
Popup Alert
Displays a MetaTrader popup notification.
Sound Alert
Plays the configured MetaTrader alert sound.
Push Notification
Can send an alert through MetaTrader's configured mobile notification system.
Alert Distance
Determines how close price must come to a Support or Resistance zone before an alert can be generated.
Aurex Automatic S/R can be used as an additional technical-analysis tool for:
Forex
Gold / XAUUSD
Indices
Intraday Trading
Swing Trading
Breakout Analysis
Reversal Analysis
Trend Pullbacks
Stop Loss and Take Profit Planning
Because the calculations use the chart's current timeframe, traders can also compare Support and Resistance across different timeframes.
MetaTrader 4 (MT4)
Aurex Automatic S/R is a custom technical indicator and does not automatically place trades.
It is designed to provide additional market information that traders can incorporate into their own analysis and trading decisions.
Support and Resistance areas represent historical price behaviour and do not guarantee that price will reverse, hold or break at any displayed zone.
No technical indicator can predict future market movements with certainty.
Forex and CFD trading involves substantial risk, and historical market behaviour does not guarantee future results.
Aurex Automatic S/R should therefore be used as an analytical tool alongside appropriate risk management and the trader's own analysis.
Aurex Automatic S/R — important price levels, without the chart clutter.