Nexus Trend Pulse
- Indicatori
- Versione: 1.10
- Attivazioni: 5

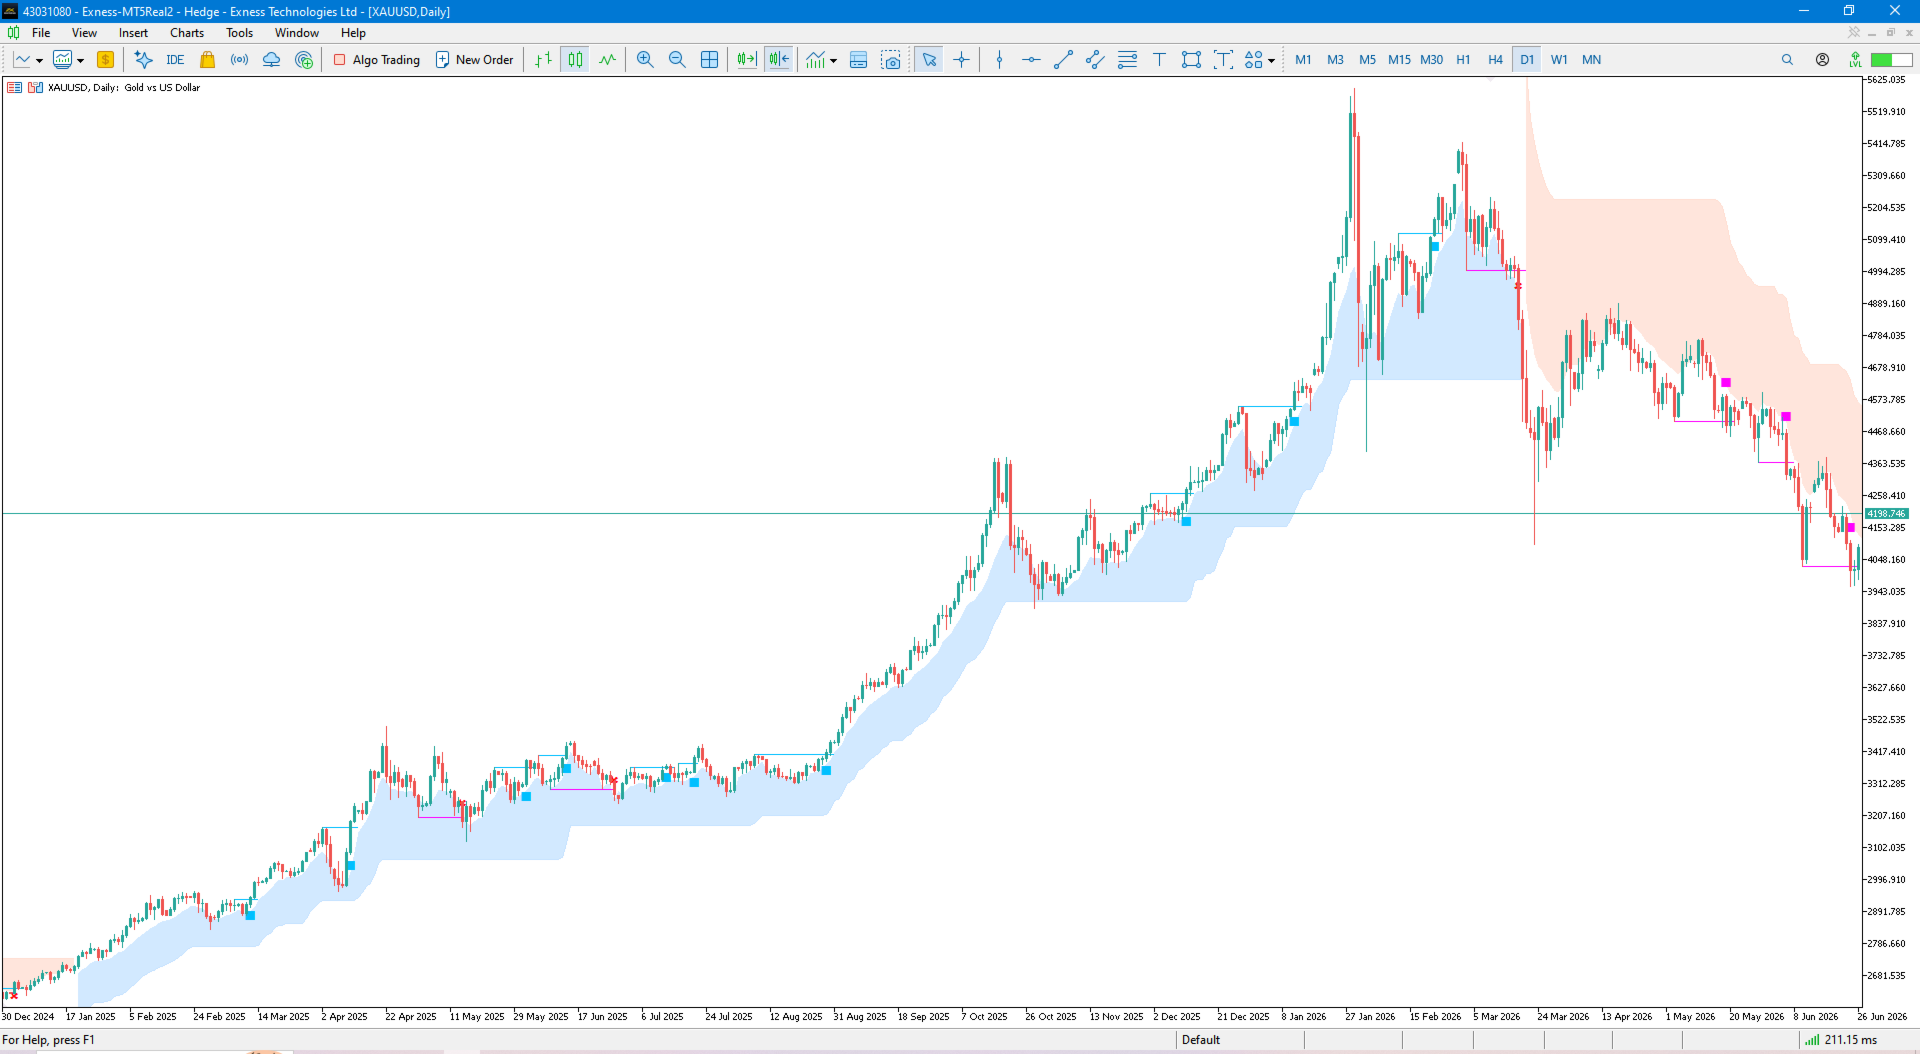
Nexus Trend Pulse is a visual trend analysis and trading signal indicator developed for MetaTrader 4/5. It combines dynamic trend zones, directional signals, stop reference lines, and entry level visualization in one chart interface.
Designed for traders who prefer a clear and organized trading environment, Nexus Trend Pulse helps identify market direction, observe price reactions, and recognize potential trading opportunities without overcrowding the chart.
The indicator presents market information through color-coded zones, BUY/SELL arrows, and price-level segments, allowing traders to follow market developments directly from the main price chart.
Key Features
Dynamic Trend Zones
Identify bullish and bearish market phases through automatically updated colored zones. The visual boundaries help traders recognize the prevailing trend and observe changes in market direction.
BUY & SELL Signal Arrows
Display directional signal markers directly on the chart when qualifying price events occur. Signals aligned with the current trend and counter-trend signals use different visual styles for easier identification.
Dynamic Stop Reference Lines
Visualize adaptive price boundaries that follow market conditions. These lines provide additional context for monitoring trend development and potential changes in price direction.
Entry Level Visualization
Display horizontal entry-level segments associated with detected price structures and breakout events. These segments help traders identify relevant price areas without extending indefinitely across the chart.
Multi-Timeframe Trend Analysis
Analyze trend direction using the current chart timeframe or a selected higher timeframe. This allows traders to view chart-level signals alongside broader market direction.
Customizable Chart Appearance
Adjust trend colors, zone transparency, signal colors, and display options to suit different chart themes and individual preferences.
Flexible Signal Notifications
Receive signal notifications through terminal pop-up alerts, email, or mobile push notifications, depending on the selected settings and terminal configuration.
Unified Historical Display
Control the visible historical range through a single setting. Trend zones, stop lines, signals, and entry segments share the same display range for consistent chart presentation.
Designed for Practical Chart Analysis
Nexus Trend Pulse brings multiple visual elements together to support everyday technical analysis.
Traders can use the indicator to:
-
Recognize bullish and bearish market phases.
-
Observe potential trend transitions.
-
Identify chart-based BUY and SELL signal events.
-
Distinguish trend-aligned signals from counter-trend signals.
-
Monitor relevant price levels and dynamic stop boundaries.
-
Compare chart signals with higher-timeframe trend direction.
-
Maintain a customizable and organized trading workspace.
The indicator can be used as a standalone chart analysis tool or alongside an existing trading strategy.
Settings and Customization
The indicator includes a focused set of user-adjustable parameters:
Trend and History: Trend timeframe and historical display range.
Trend Zone: Zone visibility, bullish and bearish colors, and transparency.
Signals and Entry: Signal visibility, entry segment visibility, and BUY/SELL colors.
Notifications: Terminal alerts, email alerts, and mobile notifications.
Default settings are provided for initial use, while visual and notification preferences can be adjusted from the indicator properties.
Important Information
Nexus Trend Pulse is a technical analysis indicator, not an automated trading system. It does not open, modify, or close trading positions.
Signals are based on market data and may change while a candle is forming or when recent price structures are updated. Signal appearance does not guarantee a particular market outcome.
The indicator is intended to assist market analysis and should be used together with appropriate risk management and independent trading decisions.