Volume Divergence Scanner
- Indicatori
- Versione: 1.14
- Aggiornato: 22 settembre 2026
- Attivazioni: 5

Volume Divergence & RSI HTF Scanner
Short Description: Advanced counter-trend indicator detecting price and volume divergences filtered by RSI momentum and Multi-Timeframe S/R levels.
Full Description: Volume Divergence & RSI HTF Scanner is a powerful trading assistant designed to identify high-probability counter-trend reversals and exhaustion points in real-time. By combining Price-to-Volume divergence with RSI momentum filtering and High-Timeframe (HTF) Support & Resistance levels, this indicator eliminates market noise and isolates high-quality trade setups.
Key Features:
-
Volume Divergence Engine: Detects hidden volume exhaustion when price hits new highs/lows on declining tick volume.
-
Smart RSI Filter: Filters out weak signals during strong trending moves, confirming entries only in overbought/oversold zones.
-
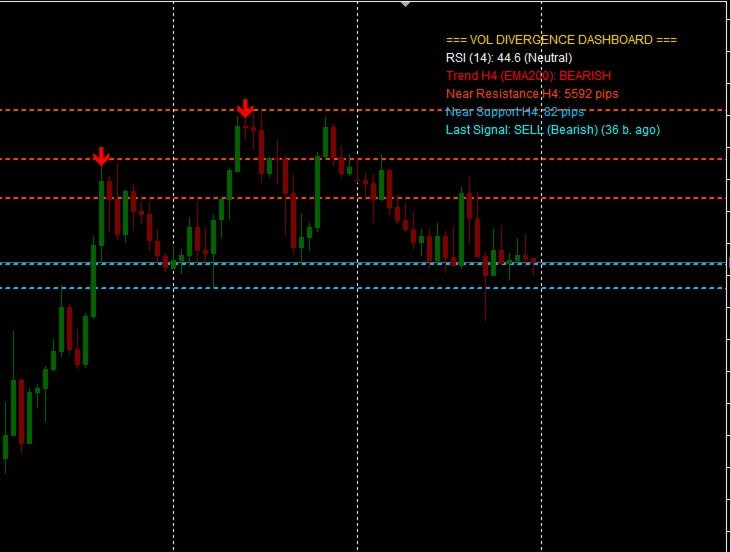
Multi-Timeframe (HTF) S/R Levels: Automatically plots key H1/H4 support and resistance lines directly on lower timeframe charts (M1-M15).
-
Live Dashboard: Displays real-time RSI values, HTF trend direction (EMA200), distance to nearest levels, and last signal statistics.
-
Multi-Language Support: Full support for both English and Russian languages (switchable in settings).
-
No Repainting: Signals and arrows appear strictly on closed bars and never repaint.
-
Alert System: Standard pop-up alerts with sound upon confirmed signal completion.
Parameters:
-
Language: Interface language (English / Русский).
-
Extremum Lookback: Bars to search for local peaks/troughs.
-
Min Distance Bars: Minimum bar distance between two extrema.
-
Use RSI Filter / Overbought / Oversold: Parameters for momentum confirmation.
-
Show HTF Levels / HTF Timeframe: Enable visual Support & Resistance lines from H1, H4, or D1.
-
Show Dashboard: Toggle the live info panel on the chart.
Important Note on Signal Confirmation (100% Non-Repainting):
-
Zero Repainting Guarantee: Once a signal arrow appears, it NEVER disappears or shifts its position.
-
Confirmation Mechanism: To mathematically confirm a true price peak or trough without guessing or repainting, the indicator analyzes a 2-bar fractal pattern. As a result, the arrow appears 2 bars after the actual peak (strictly upon the close of the confirming bar).
-
Trading Strategy: This slight confirmation delay ensures total reliability. Use limit orders or wait for a minor M1 pullback toward the fractal high/low for optimal entry price.