MultiFibo Fts Zzb MultiFrame Harmonics
- Indicatori
- Versione: 5.36
- Attivazioni: 10

Multi-timeframe Fibonacci and harmonic analysis for MetaTrader 5
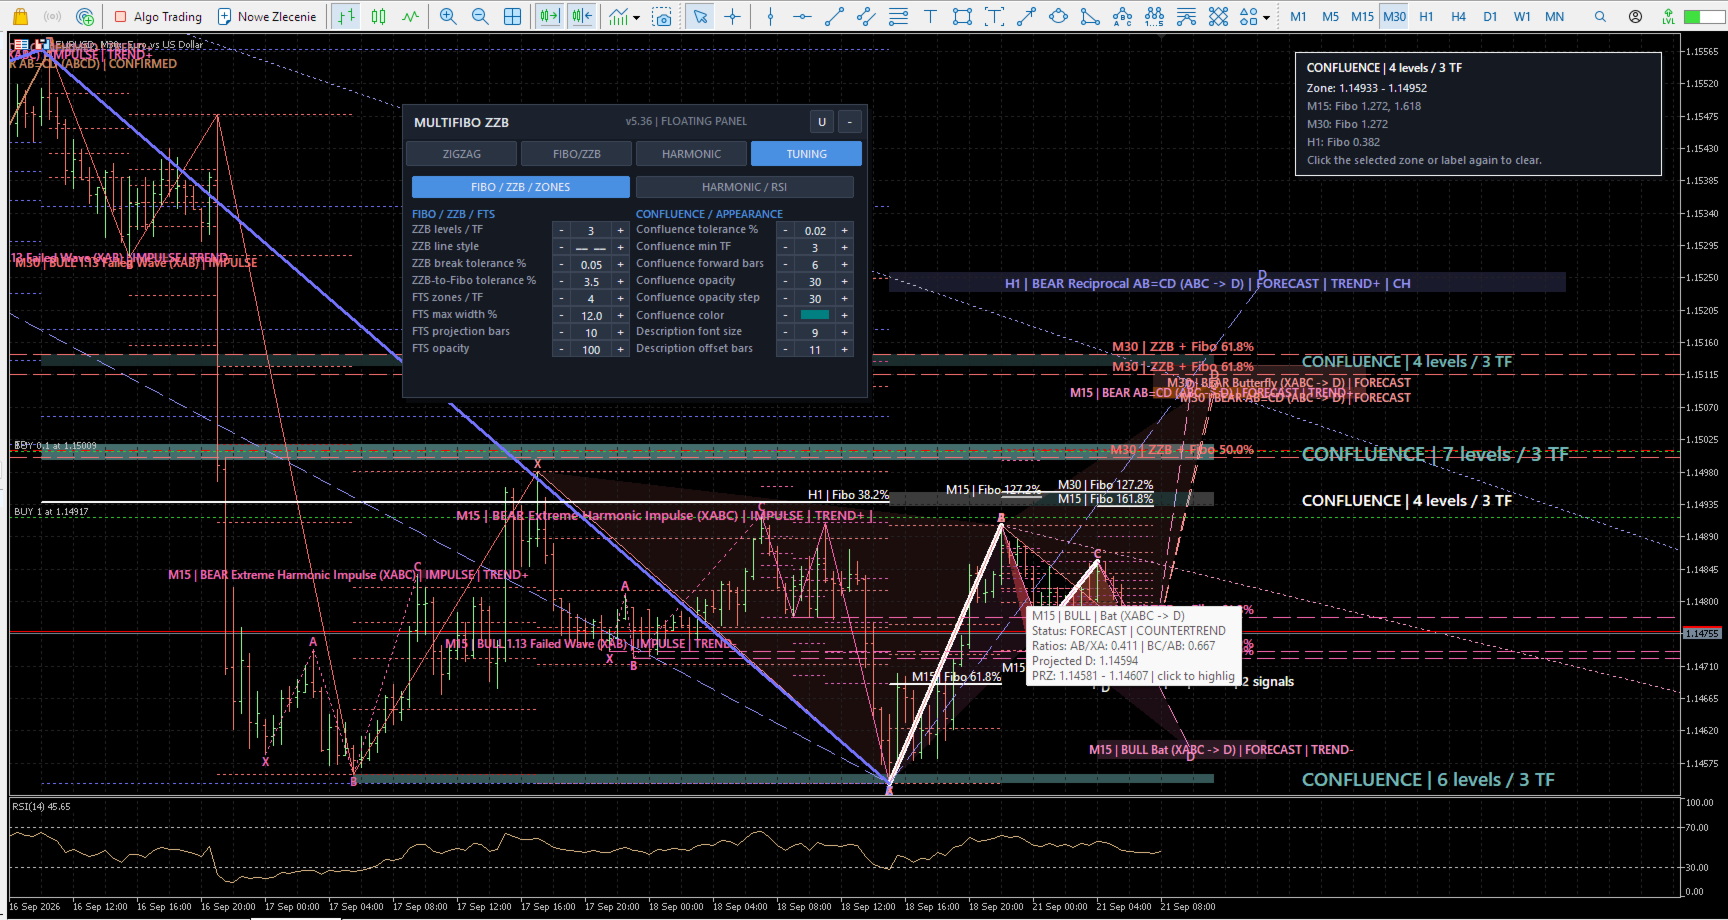
MultiFibo Fts Zzb MultiFrame Harmonics is an interactive chart-analysis indicator for MetaTrader 5. It combines independent multi-timeframe ZigZag structure, Fibonacci levels, polarity levels, FTS PHI + phi zones, confluence areas and harmonic-pattern analysis in one floating on-chart panel.
The indicator is designed for discretionary technical analysis. It does not open, modify or close trades.
Why use it?
- View market structure from several timeframes on one chart.
- Keep each timeframe visually distinct with its own color, ZigZag depth, line width and visible swing range.
- Combine Fibonacci relationships, harmonic geometry and projected reversal areas without changing charts.
- Control the display directly from a compact floating panel instead of repeatedly opening indicator inputs.
- Select a swing, Fibonacci level, FTS zone, confluence zone or harmonic structure to see its related geometry clearly.
Core features
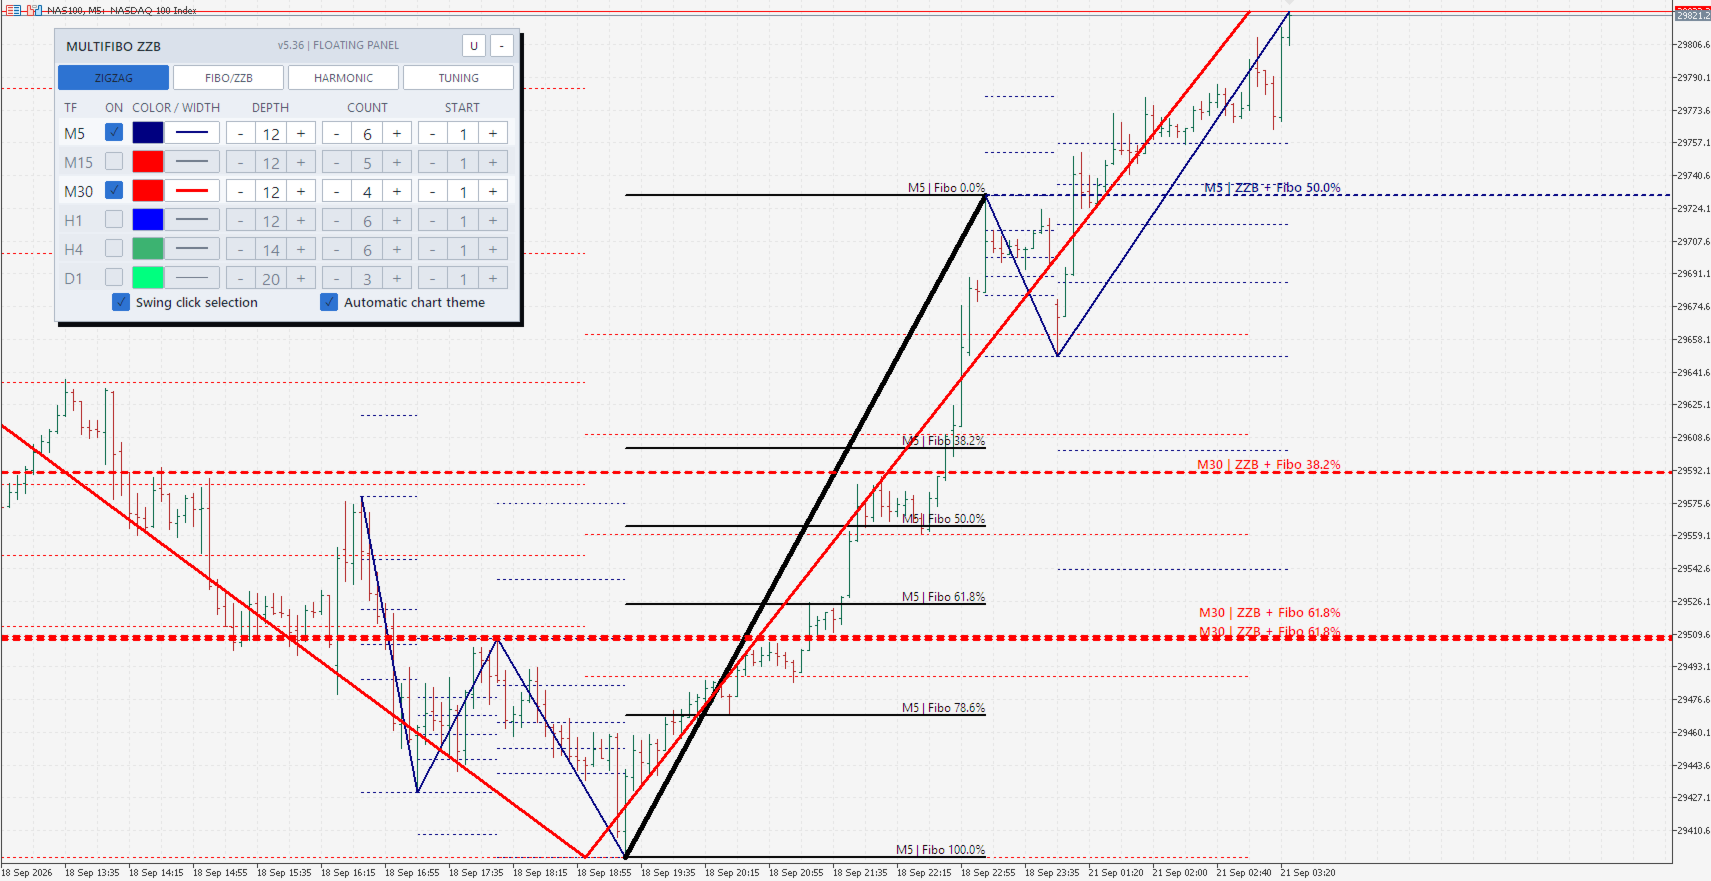
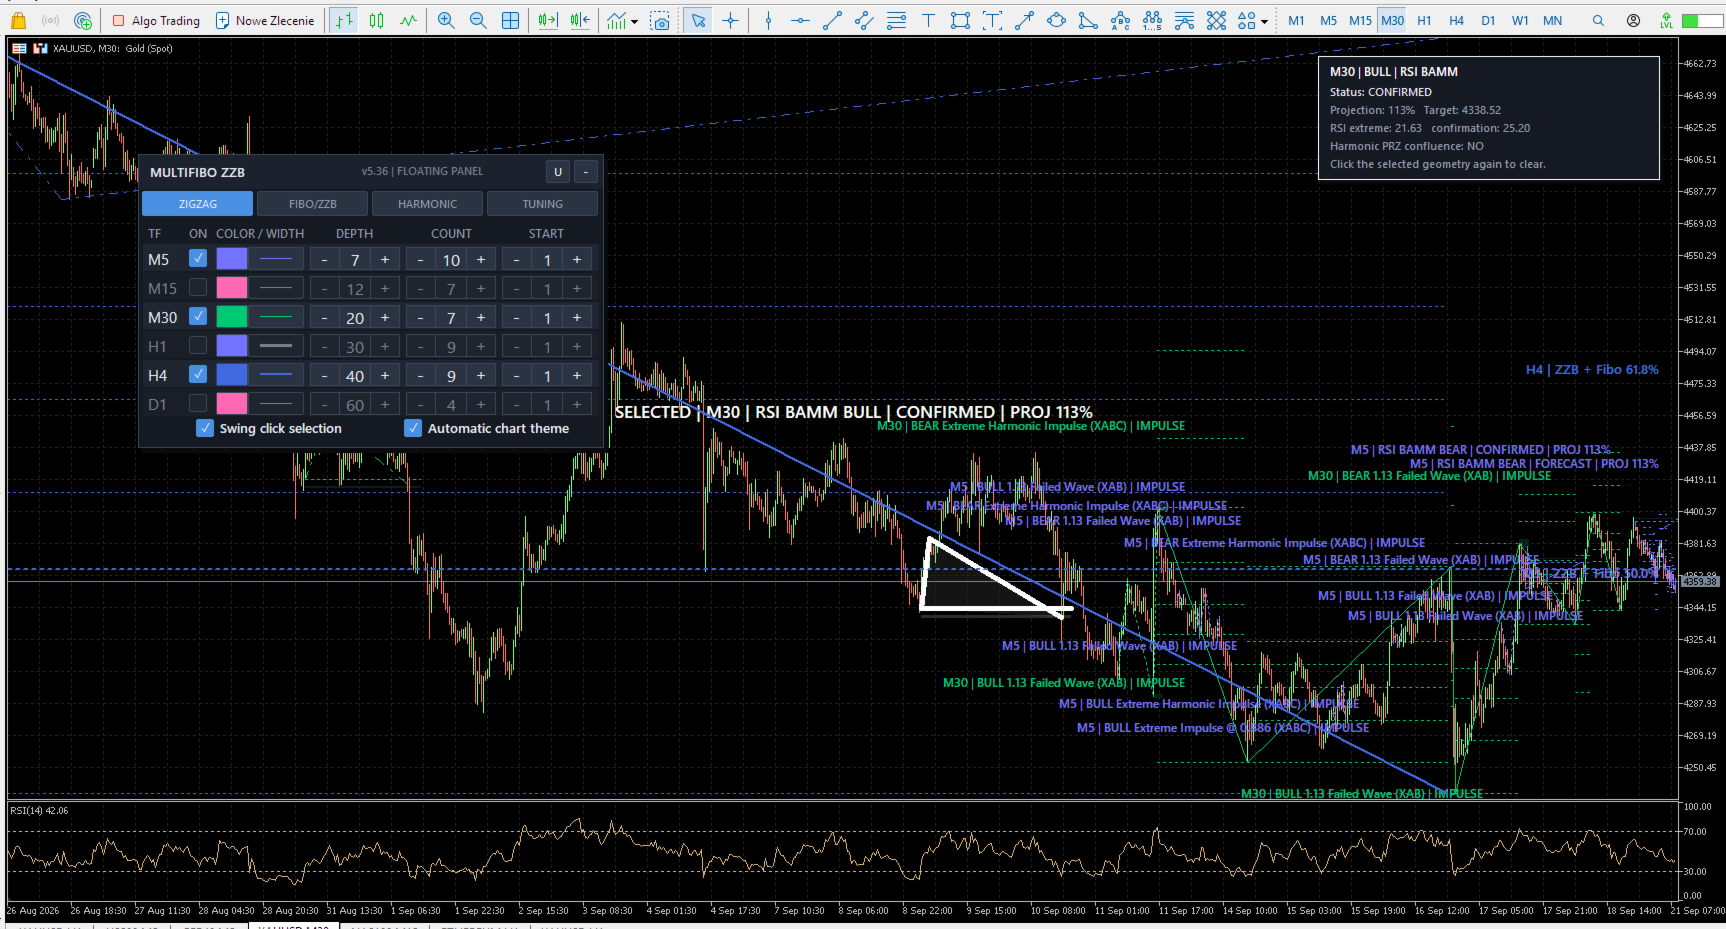
- Multi-timeframe ZigZag: independent M5, M15, M30, H1, H4 and D1 analysis on the active chart.
- Fibonacci tools: configurable retracement and extension levels, including a user-defined level, drawn from individual swings.
- ZZB polarity levels: levels based on confirmed breaks and configurable tolerance.
- FTS PHI + phi zones: projected price areas derived from two Fibonacci relationships.
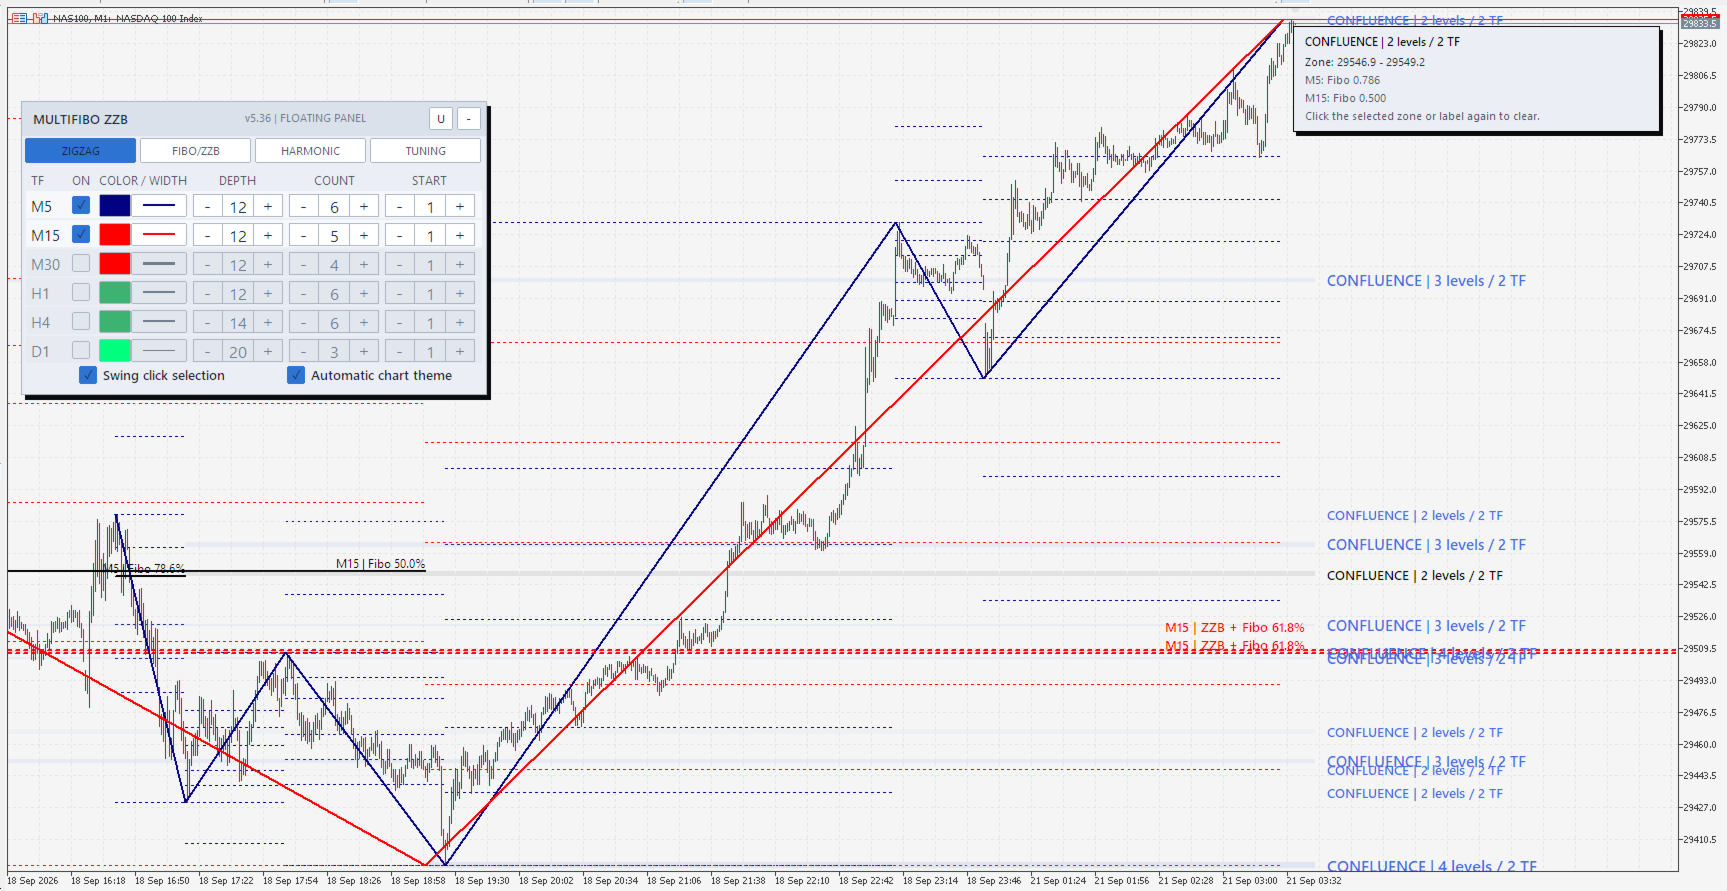
- Confluence zones: overlapping Fibonacci sources are grouped into price areas; the label shows the number of contributing levels and timeframes.
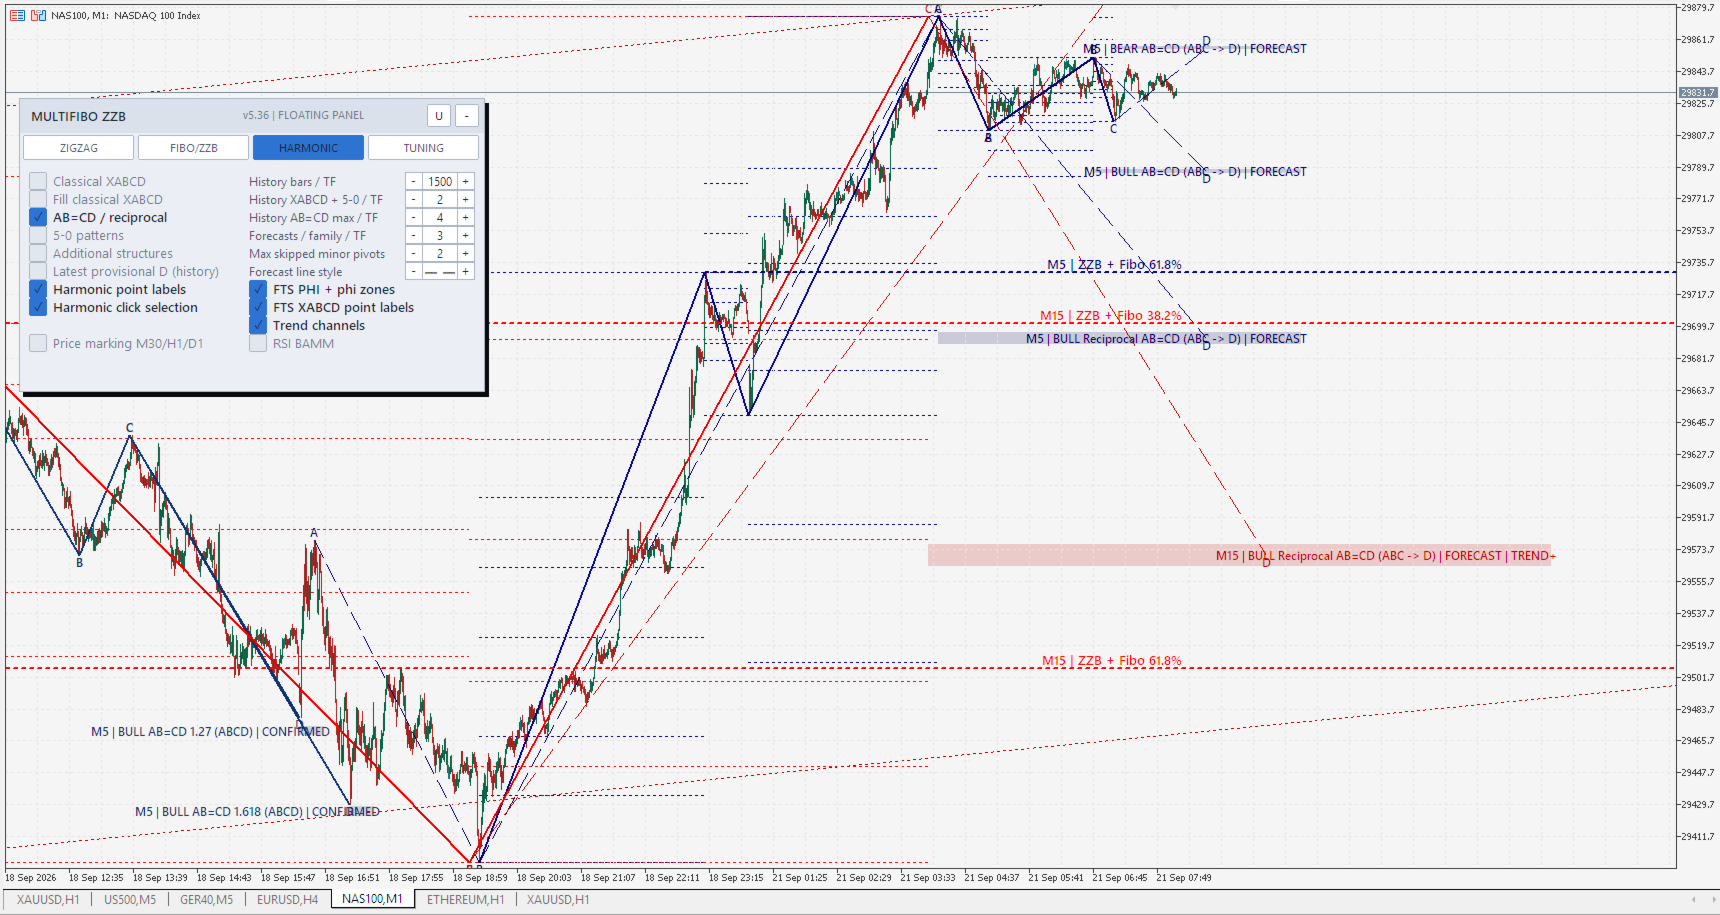
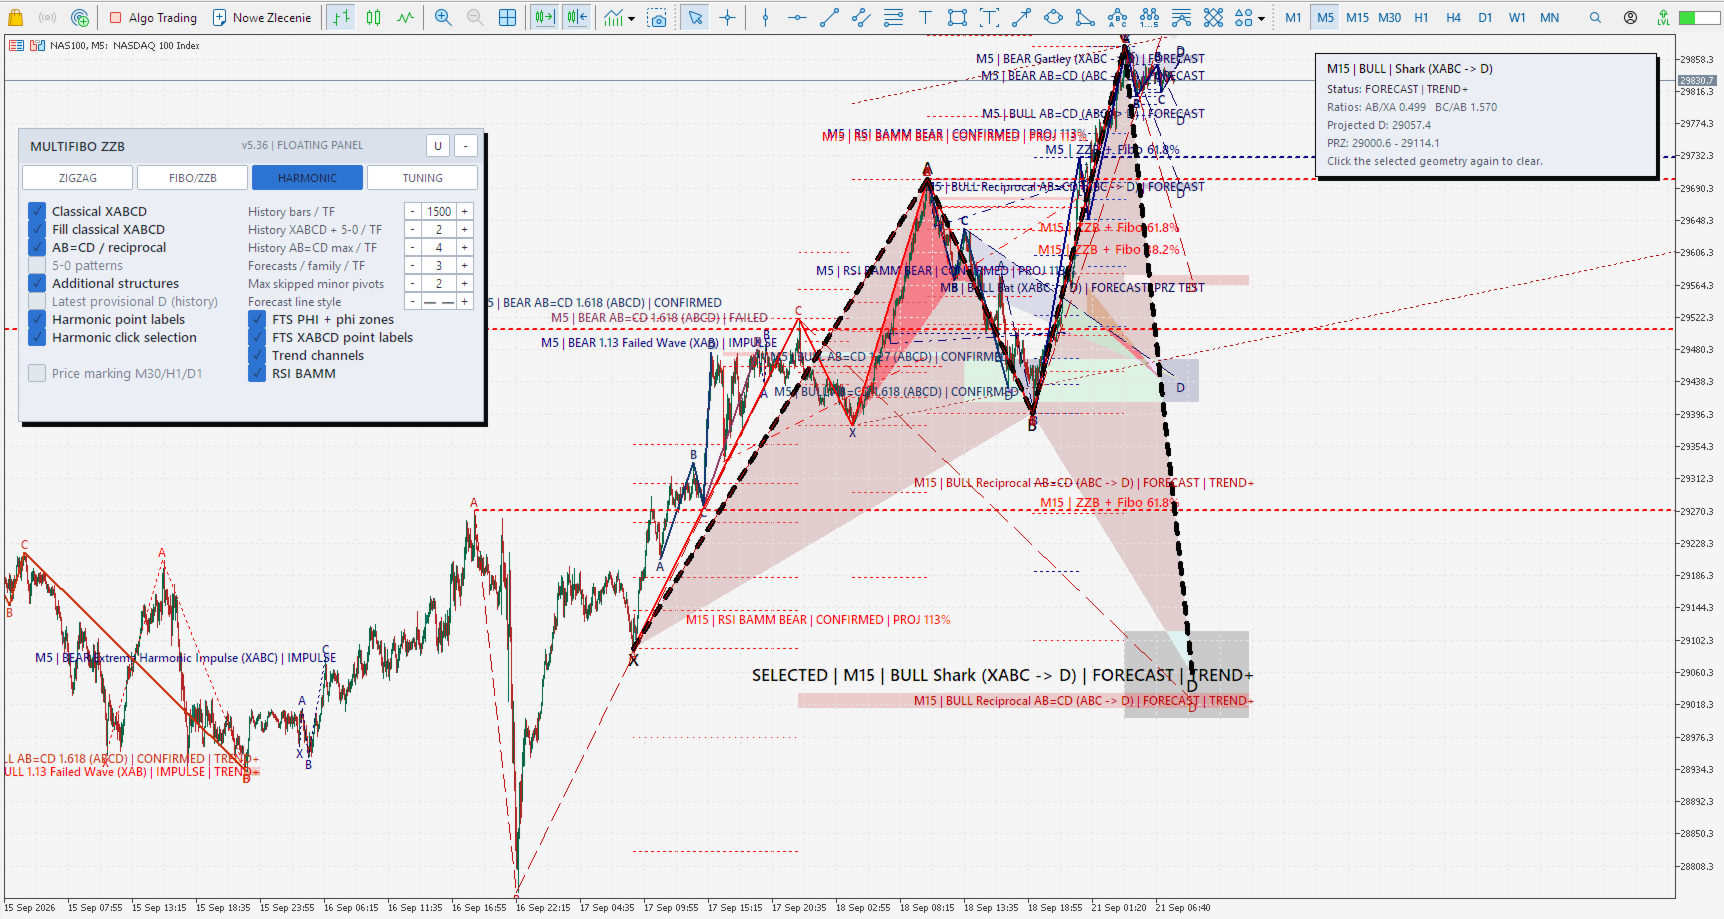
- Harmonic structures: Gartley, Bat, Alternate Bat, Butterfly, Crab, Deep Crab, AB=CD, Reciprocal AB=CD and 5-0 patterns.
- Emerging-pattern projections: projected D / PRZ areas for structures whose available geometry has passed the configured checks.
- Optional context layers: trend channels, BAMM markers, RSI BAMM structures, 1.13 Failed Waves and Extreme Harmonic Impulse structures.
- Automatic chart-theme adaptation: supports both light and dark chart themes.
Interactive operation
- Click a ZigZag swing or one of its Fibonacci levels to highlight that swing and its related finite Fibonacci levels.
- Click a harmonic structure to emphasize its geometry and display a compact information card.
- Click an FTS zone or its description to highlight the zone, its source swings and the relevant Fibonacci levels.
- Click a confluence zone to highlight only the finite Fibonacci fragments that created the selected area.
- Click the selected element again to clear the selection.
- Move or lock the floating panel and keep frequently used settings available on the chart.
Main input groups
- ZigZag: visibility, color, depth, visible swings, start position and line width for every timeframe.
- Fibo / ZZB: Fibonacci levels, custom Fibonacci value, polarity levels, rays, descriptions, FTS and confluence settings.
- Harmonic: enabled pattern families, historical limits, forecast limit, pivot-skip limit, channels, labels and RSI BAMM options.
- Tuning: tolerances, projection ranges, zone widths, opacity, description size and selection appearance.
Quick start
- Attach the indicator to any chart.
- In the ZigZag tab, enable the timeframes required for the current analysis.
- In Fibo / ZZB, choose the Fibonacci, FTS and confluence layers you want to see.
- In Harmonic, enable only the pattern families relevant to your workflow.
- Use the floating panel to keep the chart readable: begin with one or two timeframes and add others when needed.
Important information
Harmonic forecasts and projected D / PRZ zones are analytical scenarios, not promises that price will reach a zone or reverse from it. The newest ZigZag endpoint and all provisional structures may move, change or disappear as new price data arrives. A PRZ test means that price touched the projected reversal zone; it does not confirm a reversal.
Please validate the indicator on your own symbols, timeframes and historical data before using any analytical conclusion in a trading decision.