Prodotti pubblicati
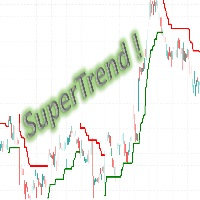
Il popolare indicatore "SuperTrend" è uno strumento di analisi tecnica che aiuta a identificare la direzione di un trend e i possibili punti di ingresso o uscita nei mercati finanziari. L'indicatore si basa sulla Media dell'Intervallo Effettivo (ATR), che misura la volatilità del mercato in base agli intervalli di prezzo. È gratuito su altre piattaforme e qui non c'è motivo per cui non dovrebbe esserlo! Viene comunemente utilizzato in tre modi: Per identificare il trend attuale: quando il prezzo
FREE

UT Bot Alerts — ATR Trailing Stop System Faithful MQL5 & MQL4 conversion of the legendary "UT Bot Alerts" indicator by QuantNomad from TradingView. Originally developed by Yo_adriiiiaan with the core idea by HPotter, and refined into Pine Script v4 with alerts by QuantNomad (Vadim Cissa) — one of the most followed quant developers on TradingView with over 100K followers. The original script has accumulated 1.1 million+ views and 35,500+ favorites on TradingView, making it one of the most popular
FREE

UT Bot Alerts — ATR Trailing Stop System Faithful MQL5 & MQL4 conversion of the legendary "UT Bot Alerts" indicator by QuantNomad from TradingView. Originally developed by Yo_adriiiiaan with the core idea by HPotter, and refined into Pine Script v4 with alerts by QuantNomad (Vadim Cissa) — one of the most followed quant developers on TradingView with over 100K followers. The original script has accumulated 1.1 million+ views and 35,500+ favorites on TradingView, making it one of the most popular
FREE

### Donchian Channels Trend v1.0 A trend-following breakout indicator that encapsulates price action within a dynamic envelope based on historical highs and lows. Originally conceptualized for TradingView, this tool provides a clear visualization of the directional bias using state memory.
**How it works** The algorithm calculates the absolute maximum and minimum values over a specified lookback period. It utilizes a finite state machine (FSM) to maintain the current trend direction based on s
FREE

### Impulse MACD [ LazyBear ] v1.0
Port of LazyBear's open-source TradingView indicator, which has accumulated over 8,700 favorites since its publication in 2015. It filters out false MACD signals by measuring momentum only when price breaks outside a smoothed moving average channel.
#### How it works
The indicator builds a channel using two Smoothed Moving Averages (SMMA) applied to the High and Low. A Zero-Lag EMA (mathematically equivalent to DEMA) is computed on the typical price (HLC3).
FREE

### ADX and DI v1.00
Faithful MQL4/MQL5 port of BeikabuOyaji's "ADX and DI" indicator from TradingView, one of the most widely used ADX implementations on the platform with over 43,000 users. It displays +DI, −DI, and ADX in a single subwindow, using a hybrid smoothing approach — Wilder's method for the Directional Indexes and a simple moving average for the ADX line.
#### How it works
The indicator implements Welles Wilder's Directional Movement System with one notable variation in the fina
FREE

### Donchian Channels Trend v1.0 A trend-following breakout indicator that encapsulates price action within a dynamic envelope based on historical highs and lows. Originally conceptualized for TradingView, this tool provides a clear visualization of the directional bias using state memory.
**How it works** The algorithm calculates the absolute maximum and minimum values over a specified lookback period. It utilizes a finite state machine (FSM) to maintain the current trend direction based on s
FREE

### Bollinger + RSI, Double Strategy v1.1
Faithful MQL4/MQL5 port of ChartArt's popular TradingView strategy (41,800+ users, 990+ favorites). Generates buy and sell signals only when **both indicators confirm simultaneously** — RSI momentum shift + Bollinger Band breakout on the same candle.
**How it works**
The strategy uses an unconventional configuration: a fast RSI(6) with its crossover level set at 50 (acting as a momentum direction filter, not an overbought/oversold detector), combined
FREE

The popular "SuperTrend" indicator is a technical analysis tool designed to help identify trend direction and potential entry or exit points in financial markets. This indicator is built upon the Average True Range (ATR) , which gauges market volatility based on price ranges. It is available for free on other platforms, and this should be no exception! Common Use Cases The SuperTrend is typically utilized in three primary ways: Trend Identification: When the price is trading above the indicator
FREE
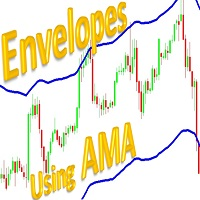
L'indicatore "Envelope of Adaptive Moving Average" è uno strumento progettato per aiutarti a prendere decisioni informate nel mercato finanziario. È stato sviluppato per fornirti una chiara visione della direzione del trend e dei potenziali punti di ingresso e uscita nelle tue operazioni.
Questo indicatore si basa su una media mobile adattativa, il che significa che si adatta automaticamente alle variazioni della volatilità di mercato. Ciò lo rende particolarmente utile in mercati che possono e
FREE

### Bollinger + RSI, Double Strategy v1.1
Faithful MQL4/MQL5 port of ChartArt's popular TradingView strategy (41,800+ users, 990+ favorites). Generates buy and sell signals only when **both indicators confirm simultaneously** — RSI momentum shift + Bollinger Band breakout on the same candle.
**How it works**
The strategy uses an unconventional configuration: a fast RSI(6) with its crossover level set at 50 (acting as a momentum direction filter, not an overbought/oversold detector), combined
FREE
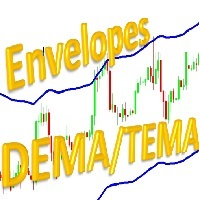
L'indicatore delle Envelopes delle Medie Mobili Esponenziali (doppie o triple) è uno strumento di analisi tecnica progettato per aiutarti a identificare le tendenze e i potenziali punti di inversione nel mercato finanziario. Questo indicatore offre ai trader la flessibilità di scegliere tra due tipi di medie mobili esponenziali: la Media Mobile Esponenziale Doppia (DEMA) o la Media Mobile Esponenziale Tripla (TEMA).
Caratteristiche principali:
- Doppie o Triple Medie Mobili Esponenziali: Passa
FREE

### Coral Trend Indicator v1.0
The Coral Trend Indicator is a faithful port of LazyBear's TradingView script (10,900+ favorites) to MetaTrader 4 and MetaTrader 5. It applies Tim Tillson's T3 Moving Average algorithm (1998) as a color-coded trend filter on the price chart.
#### How it works
The indicator passes the price through six cascaded Exponential Moving Averages, then combines stages 3 through 6 using binomial polynomial coefficients derived from the Constant D parameter. This pro
FREE

### ADX and DI v1.00
Faithful MQL4/MQL5 port of BeikabuOyaji's "ADX and DI" indicator from TradingView, one of the most widely used ADX implementations on the platform with over 43,000 users. It displays +DI, −DI, and ADX in a single subwindow, using a hybrid smoothing approach — Wilder's method for the Directional Indexes and a simple moving average for the ADX line.
#### How it works
The indicator implements Welles Wilder's Directional Movement System with one notable variation in the fina
FREE

Heikin Ashi Trend Indicator v2.1
MQL5/MQL4 port of the Heikin Ashi Trend Indicator originally published on TradingView by dman103 (2,300+ likes, 80,000+ views). It combines Heikin Ashi candle smoothing with the Tilson T3 moving average to produce clean, noise-reduced trend signals directly on the price chart.
#### How it works
The indicator processes price data in two stages. First, it computes Heikin Ashi OHLC values from the regular candlestick data. Then, it applies the Tilson T3 moving a
FREE

### Impulse MACD [ LazyBear ] v1.0
Port of LazyBear's open-source TradingView indicator, which has accumulated over 8,700 favorites since its publication in 2015. It filters out false MACD signals by measuring momentum only when price breaks outside a smoothed moving average channel.
#### How it works
The indicator builds a channel using two Smoothed Moving Averages (SMMA) applied to the High and Low. A Zero-Lag EMA (mathematically equivalent to DEMA) is computed on the typical price (HLC3).
FREE

### Heikin Ashi Trend Indicator v2.1
MQL5/MQL4 port of the Heikin Ashi Trend Indicator originally published on TradingView by dman103 (2,300+ likes, 80,000+ views). It combines Heikin Ashi candle smoothing with the Tilson T3 moving average to produce clean, noise-reduced trend signals directly on the price chart.
#### How it works
The indicator processes price data in two stages. First, it computes Heikin Ashi OHLC values from the regular candlestick data. Then, it applies the Tilson T3
FREE

### Coral Trend Indicator v1.0
The Coral Trend Indicator is a faithful port of LazyBear's TradingView script (10,900+ favorites) to MetaTrader 4 and MetaTrader 5. It applies Tim Tillson's T3 Moving Average algorithm (1998) as a color-coded trend filter on the price chart.
#### How it works
The indicator passes the price through six cascaded Exponential Moving Averages, then combines stages 3 through 6 using binomial polynomial coefficients derived from the Constant D parameter. This pro
FREE

Exobeacon Telemetry è un overlay di analisi del sentiment che mostra in tempo reale come le notizie attuali stanno impattando i mercati che operi. Il prodotto utilizza il backend di Exobeacon Labs (backend proprietario su api.exobeacon.com ), che monitora 49 fonti di notizie e processa ogni batch con analisi semantica tramite LLM. Il risultato: un punteggio di sentiment consolidato per asset, aggiornato ogni minuto, visualizzato direttamente sul tuo grafico. A differenza dei calendari economici
FREE

## Italiano
### Correlated MT5 v8.1
Correlated MT5 v8.1 è un Expert Advisor multi-simbolo per MetaTrader 5 che analizza panieri di asset, correlazione e ritorno alla media. Può essere usato come pannello di lettura del mercato o come sistema automatico con controllo di esposizione, dimensione della posizione e rischio.
#### Come funziona
- Costruisce un paniere con 3-10 simboli e normalizza i prezzi. - Calcola una matrice di correlazione e può filtrare il rumore con Random Matrix Theor

Italiano
### ExoPanels v7.1
ExoPanels v7.1 è un pannello di analisi per MetaTrader 5 che mostra correlazioni, rendimenti e metriche statistiche di più simboli in un’unica vista. La sua funzione principale è aiutare a individuare una possibile sovraesposizione tra asset e confrontare il comportamento del mercato senza cambiare continuamente grafico.
#### Come funziona
L’indicatore legge i simboli configurati, carica i dati storici del timeframe attivo e calcola una matrice di correlazio